- Q3 GDP growth doubles BoC and consensus forecasts…
- …pushing the economy further into excess demand…
- ...with the positive surprise adding to the likelihood of +50bps & open bias next week
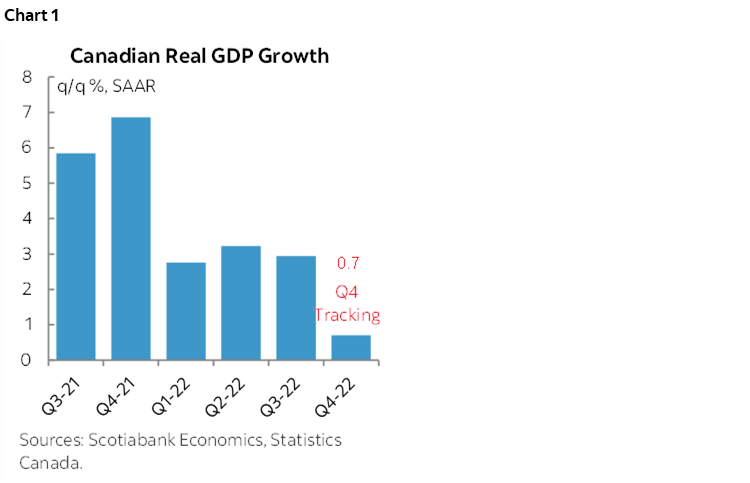
- Q4 growth is very tentatively tracking slower, but not by enough to appease the BoC
- The Feds are driving government spending more than the provinces.
- Canadian GDP, m/m % SA // q/q % SAAR:
- Actual: 0.1 / 2.9
- Scotia: 0.1 / 1.5
- Consensus: 0.1 / 1.5
- Prior: 0.3 / 3.2 (revised from 0.1 / 3.3)
- October ‘flash’: “essentially unchanged”
Canada’s economy continues to outshine just about everyone else’s by posting much stronger than expected GDP growth of 2.9% in Q3 while pushing out the narrative that growth is slowing into the fourth quarter of the year. We’ll see, as the slowing narrative is based upon very tentative data and was supposed to have happened in Q3 but did not.
For now, however, the strong upside surprise to GDP growth in Q3 keeps Canada’s economy pushing further into excess demand conditions which stymies the Bank of Canada’s efforts to cool inflationary pressures. Growth basically doubled the Bank of Canada’s forecast of 1.5% in Q3 in the October MPR. A cooling economy likely lies ahead and the monthly GDP figures are suggesting this is just beginning to happen. The new information likely means that the risk of downshifting the pace of rate hikes in December has gone down and a 50bps hike is looking more likely given the positive surprise. OIS markets are mostly priced for a half point rise.
Markets shrugged. CAD actually depreciated in the wake of the numbers, but that was partly due to a broadly based movement in the USD against other crosses. Perhaps the strong Johnson Redbook retail sales figures for the week that ended Saturday (+10.4% y/y) over the same week last year explains why. The start of the holiday shopping season appears to have been pretty strong and supported by other evidence like Shopify’s announcement yesterday. The Canadian two-year yield is up 2bps on the day.
UNRIVALLED STRENGTH
Tell me one other notable economy out there that is performing better than Canada’s. It can’t be done. GDP growth has been on fire for five consecutive quarters and hence throughout a period that has been marked by much weaker performances elsewhere from the US to Germany, France, the UK and Japan to name a few.
The proof? It started back in 2021Q3 with growth of 5.3% followed by 6.6% in Q4. When the calendar flipped over to 2022 we saw growth of 3.1% in Q1, 3.3% in Q2 and now 2.9% in Q3 (chart 1). That’s five consecutive quarters of ripping economic growth that is well above the capacity of the economy to grow the supply side even if the supply side were not damaged as it is in reality. Hence the economy pushed into excess demand conditions throughout this period of time and drove employment to an all-time record high by October pending Friday’s November tally.
DRIVERS
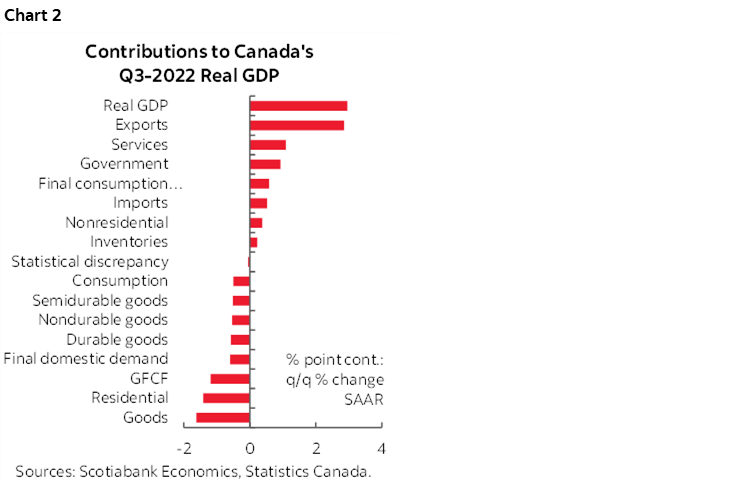
Drivers of Q3 growth are broken down in terms of weighted contributions in chart 2. Much of the growth was driven by exports that added a weighted 2.9 percentage points to GDP growth mostly through higher exports of goods. Lower imports added 0.5 ppts to GDP growth because of less of a leakage effect in the GDP accounts. Thus, net trade added about 3.3 ppts to GDP growth on its own.
THE FEDS WERE THE BIG SPENDERS
Higher government spending also added 1.1 ppts to GDP growth in Q3 as the Federal government led all levels of government toward higher tallies. This was driven by gains across all levels of government including a 19% q/q annualized increase in Federal government spending that accounted for just over half of the total rise across all levels of government. Provincial and territorial government spending was up 2.2% q/q SAAR and accounted for 23% of the total increase in spending across all levels of government. Local governments grew spending by 5.4% q/q SAAR for a 26% share of the rise in total spending.
This is significant because it goes against the narrative that is common in some quarters that the froth in spending is more focused upon provincial capitals. Not true, at least in the latest period during which a plethora of measures was introduced from Trudeau bucks to cash disbursements across provincial levels of government.
OTHER DRIVERS
The household sector was a net drag on growth in Q3. Consumption dragged 0.5 ppts off GDP in weighted terms which is pretty modest considering that consumption is 71% of GDP. Housing investment knocked 1.4 ppts off growth. Within consumption, goods subtracted 1.6 ppts from growth while services added 1.1 ppts which reflects the rotation of the sources of growth away from goods toward services.
Business investment added 0.4 ppts to GDP growth entirely due to nonresidential structures (+0.6 ppts) as machinery and equipment spending subtracted 0.26 ppts.
Inventory investment added 0.23 ppts to growth in Q3 for a minor assist.
SLOWING IS UNDERWAY
Q4 GDP growth is set to slow off of a stronger than expected starting point, but we thought the same into Q3 and it didn’t turn out that way. Using the monthly GDP accounts we can estimate ‘baked in’ GDP growth of 0.7% q/q in Q4 at a seasonally adjusted and annualized rate. That’s using Statcan’s preliminary guidance that October GDP was “essentially unchanged” combined with the updated guidance for monthly GDP through Q3.
Be careful here mind you. The slowing narrative is based upon very incomplete data for October and zero data for the rest of the quarter.
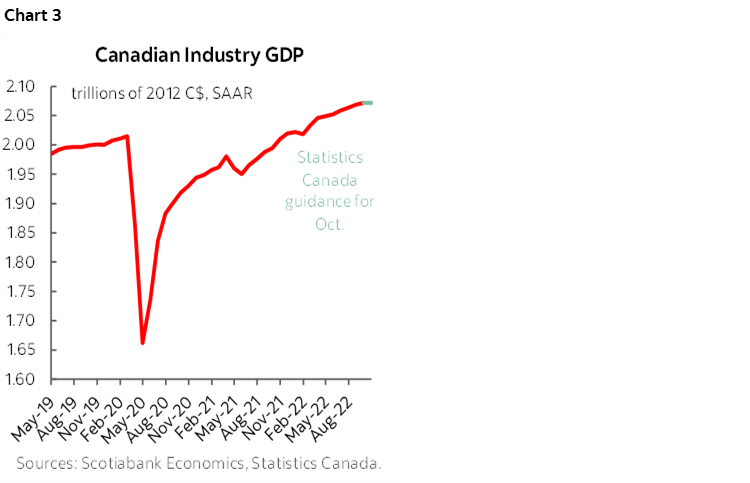
Overall, the economy has not only fully recovered from the pandemic’s hit quite some time ago, but is also 2.8 percentage points larger now than it was back in February 2020 and alongside a still damaged supply side (chart 3).
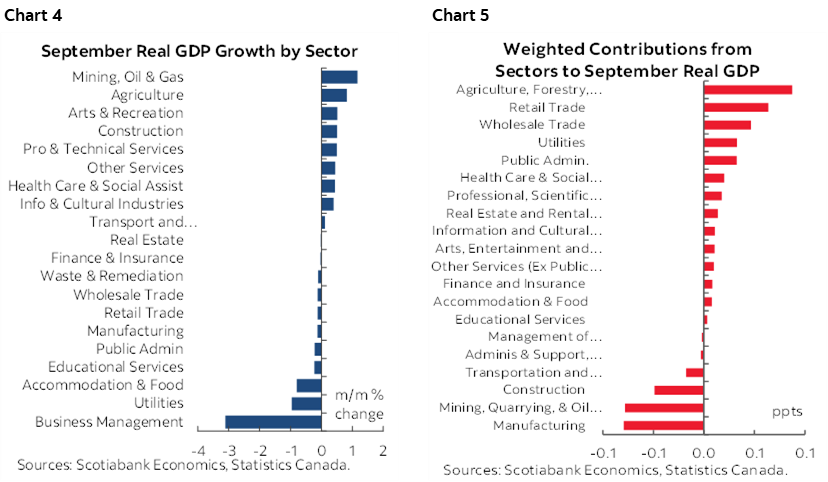
Charts 4 and 5 provide an unweighted breakdown of GDP growth in September over August and the weighted contributions to overall GDP growth in that month by sector to show which sectors did the heavy lifting after taking into account their relative sizes.
DISCLAIMER
This report has been prepared by Scotiabank Economics as a resource for the clients of Scotiabank. Opinions, estimates and projections contained herein are our own as of the date hereof and are subject to change without notice. The information and opinions contained herein have been compiled or arrived at from sources believed reliable but no representation or warranty, express or implied, is made as to their accuracy or completeness. Neither Scotiabank nor any of its officers, directors, partners, employees or affiliates accepts any liability whatsoever for any direct or consequential loss arising from any use of this report or its contents.
These reports are provided to you for informational purposes only. This report is not, and is not constructed as, an offer to sell or solicitation of any offer to buy any financial instrument, nor shall this report be construed as an opinion as to whether you should enter into any swap or trading strategy involving a swap or any other transaction. The information contained in this report is not intended to be, and does not constitute, a recommendation of a swap or trading strategy involving a swap within the meaning of U.S. Commodity Futures Trading Commission Regulation 23.434 and Appendix A thereto. This material is not intended to be individually tailored to your needs or characteristics and should not be viewed as a “call to action” or suggestion that you enter into a swap or trading strategy involving a swap or any other transaction. Scotiabank may engage in transactions in a manner inconsistent with the views discussed this report and may have positions, or be in the process of acquiring or disposing of positions, referred to in this report.
Scotiabank, its affiliates and any of their respective officers, directors and employees may from time to time take positions in currencies, act as managers, co-managers or underwriters of a public offering or act as principals or agents, deal in, own or act as market makers or advisors, brokers or commercial and/or investment bankers in relation to securities or related derivatives. As a result of these actions, Scotiabank may receive remuneration. All Scotiabank products and services are subject to the terms of applicable agreements and local regulations. Officers, directors and employees of Scotiabank and its affiliates may serve as directors of corporations.
Any securities discussed in this report may not be suitable for all investors. Scotiabank recommends that investors independently evaluate any issuer and security discussed in this report, and consult with any advisors they deem necessary prior to making any investment.
This report and all information, opinions and conclusions contained in it are protected by copyright. This information may not be reproduced without the prior express written consent of Scotiabank.
™ Trademark of The Bank of Nova Scotia. Used under license, where applicable.
Scotiabank, together with “Global Banking and Markets”, is a marketing name for the global corporate and investment banking and capital markets businesses of The Bank of Nova Scotia and certain of its affiliates in the countries where they operate, including; Scotiabank Europe plc; Scotiabank (Ireland) Designated Activity Company; Scotiabank Inverlat S.A., Institución de Banca Múltiple, Grupo Financiero Scotiabank Inverlat, Scotia Inverlat Casa de Bolsa, S.A. de C.V., Grupo Financiero Scotiabank Inverlat, Scotia Inverlat Derivados S.A. de C.V. – all members of the Scotiabank group and authorized users of the Scotiabank mark. The Bank of Nova Scotia is incorporated in Canada with limited liability and is authorised and regulated by the Office of the Superintendent of Financial Institutions Canada. The Bank of Nova Scotia is authorized by the UK Prudential Regulation Authority and is subject to regulation by the UK Financial Conduct Authority and limited regulation by the UK Prudential Regulation Authority. Details about the extent of The Bank of Nova Scotia's regulation by the UK Prudential Regulation Authority are available from us on request. Scotiabank Europe plc is authorized by the UK Prudential Regulation Authority and regulated by the UK Financial Conduct Authority and the UK Prudential Regulation Authority.
Scotiabank Inverlat, S.A., Scotia Inverlat Casa de Bolsa, S.A. de C.V, Grupo Financiero Scotiabank Inverlat, and Scotia Inverlat Derivados, S.A. de C.V., are each authorized and regulated by the Mexican financial authorities.
Not all products and services are offered in all jurisdictions. Services described are available in jurisdictions where permitted by law.