- Positive GDP revisions result in less slack, maybe a swing toward excess demand…
- ...possibly leading the BoC to revise inflation forecasts slightly higher…
- ...and supporting our view the BoC is done cutting, next move an eventual hike
- Q3 GDP was a massive beat—and why it was a massive head fake
- Fade some of October’s softness
- Hawkish market reaction was correct, even if for the wrong reasons
- Per capita incomes got a bit of a boost from revisions
- Canadian Q3 GDP, q/q SAAR %:
- Actual: 2.6
- Scotia: 0.5
- Consensus: 0.5
- Prior: -1.8 (revised from -1.6)
- Canadian GDP, September, m/m % SA:
- Actual: 0.2
- Scotia: 0.2
- Consensus: 0.2
- Prior: -0.1 (revised from -0.3)
- October ‘flash’ estimate: -0.3
Could there be a messier set of GDP numbers? Not really. They made for fun trying to do instant coverage on the fly in chat rooms. I’m not sure that markets really understood what went on beneath the hood but they serendipitously wound up at the right conclusion regardless. CAD appreciated and Canadian bond yields moved higher across the board. The broad set of numbers needs further work but the conclusion is that they’ll keep the BoC sidelined.
The key lies in the revisions that I’ll turn to first. Second is why you should look right past the massive headline beat for Canadian GDP. Third is why you should also look past some of the weakness in October GDP.
REVISIONS POINT TO LESS SLACK
Statcan applied large upward revisions to GDP over 2022, 2023 and 2024. Statcan did not mention GDP revisions in their website line-up of daily releases, nor in the prior write-ups for monthly and Q2 GDP reports where they usually flag coming revisions. Where did they put it? Buried in a provincial GDP write-up where few macro watchers would bother to look. And yet this is probably the most important part of the overall set of numbers.
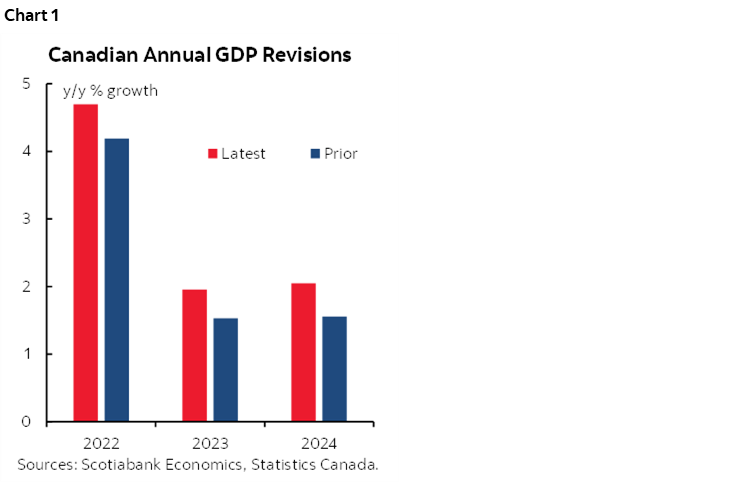
Annual GDP growth over the three years of 2022, 2023 and 2024 was revised up by about ½% each year (chart 1). Details are here.
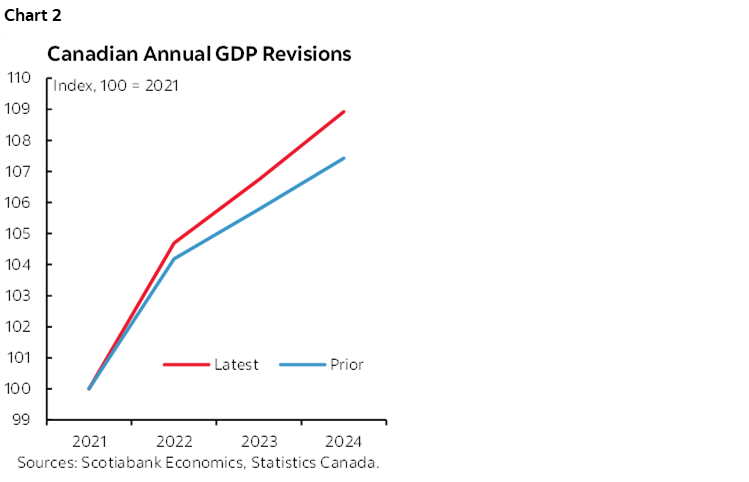
The level of GDP was revised up by a cumulative 1.7 percentage points by the end of 2024. That’s ’uuuuuge! Chart 2.
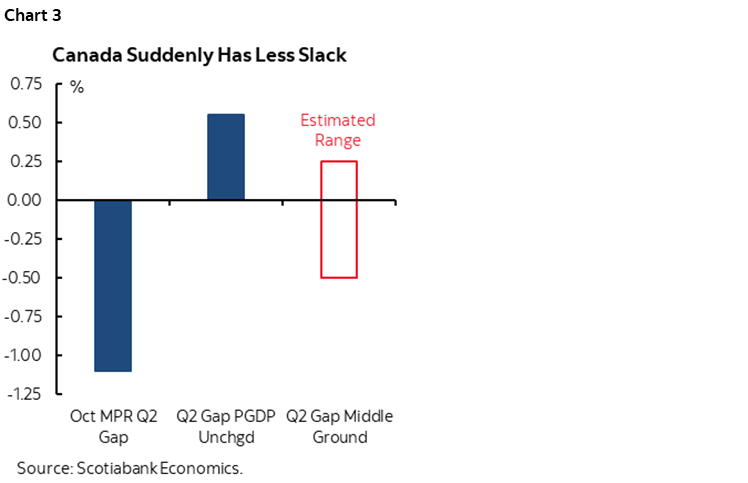
The impact this had was to reverse the Bank of Canada’s estimated amount of slack in the economy to net excess demand (chart 3). Recall that the October MPR estimated the output gap at -1.1% as at 2025Q2. If we only changed actual GDP in accordance with the revisions we just got and left potential GDP unchanged then the estimated amount of slack would swing to an estimated amount of net excess demand of +0.55% as at 2025Q2—a positive output gap. The BoC could go somewhere in the middle with a revised slack estimate of somewhere around +¼% which is still a big swing. At a minimum, they could cut in half the amount of estimated slack compared to previously. We’ll have a more precise estimate after thoroughly running the numbers.
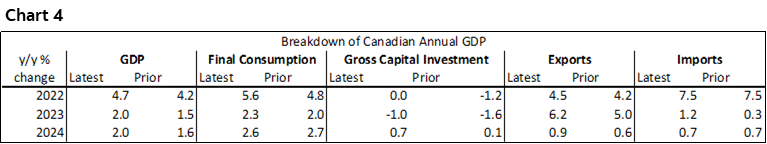
Why go in the middle? Because of the reasons for the GDP revisions. Some were due to upward revisions to consumer spending which adds to the demand side. Some were due to upward revisions to investment which adds to capacity. Chart 4 shows the drivers of the revisions by year.
Ergo, the BoC will use these numbers to revise up its estimates of the productive capacity of the economy as at 2025Q2, or potential GDP. Q3 may slightly widen that slack.
All of this matters because wiping out at least a material amount of slack means that we’re left with a possible explanation of sticky underlying inflation and continued upside pressure in light of other drivers like cost pressures. In the grand scheme of things, an output gap around the revised and spitballed estimate is relatively small in relation to other drivers of inflation like cost pressures that we’ve been emphasizing along with the Bank of Canada. In fact, the BoC’s October decomposition of the inflation forecast could shift toward more emphasis on cost pressures now, given the smaller amount of slack.
The net effect could see the Bank of Canada revise its inflation outlook higher when it publishes a fresh forecast at the end of January in the next MPR. It already expected inflation to persist just above the 2% inflation target in 2026 and 2027. It may go higher. At the margin they are not about to immediately turn hawkish, but this emboldens our view that the BoC is sidelined for an extended period.
HERE’S WHAT DROVE Q3 GDP
Economists collectively blew it, right? I mean GDP growth of 2.6% q/q SAAR in Q3 when everyone was around –0.5% q/q SAAR isn’t terribly flattering. But hold on a sec here before you pile into the hater’s spin.
The main driver of Q3 GDP growth was less of an import leakage effect on GDP. Imports fell. In a GDP accounting sense, that means less activity ‘leaked out’ of the economy which lifts GDP growth. This is strictly an accounting effect and misinterpreted at times by protectionists. Chart 5 shows the role played by imports that added 2.9 percentage points to Q3 GDP growth.
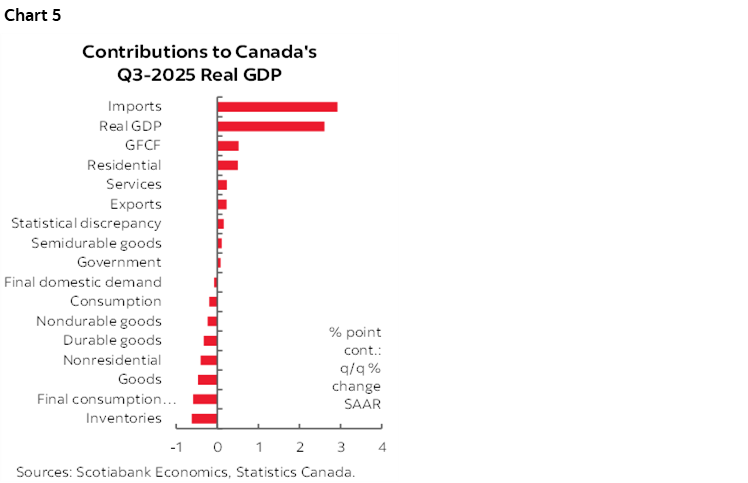
Further, I have minimal trust in the trade figures. The US government shutdown is making their estimation a game of guesswork until we get a full set of numbers up to September. Also, the precious metals distortions accounted for a good chunk of the drop in imports during Q3 which doesn’t reflect true underlying economic activity.
Chart 6 shows what’s more important. Final domestic demand—that adds consumption, investment and government spending—was flat (-0.08% q/q SAAR).
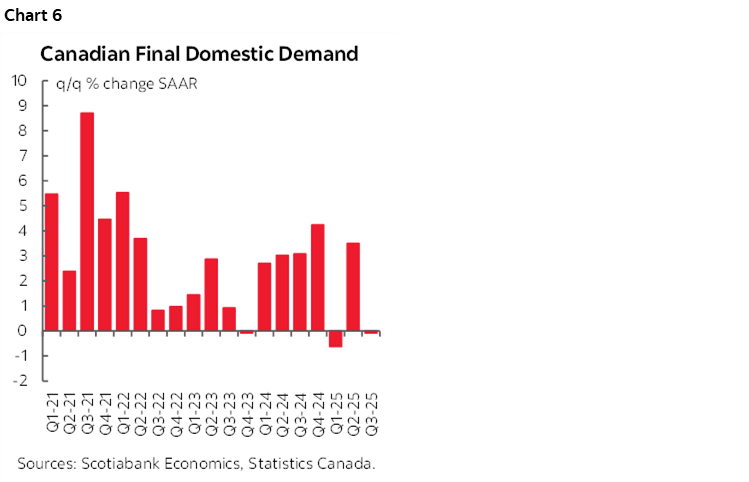
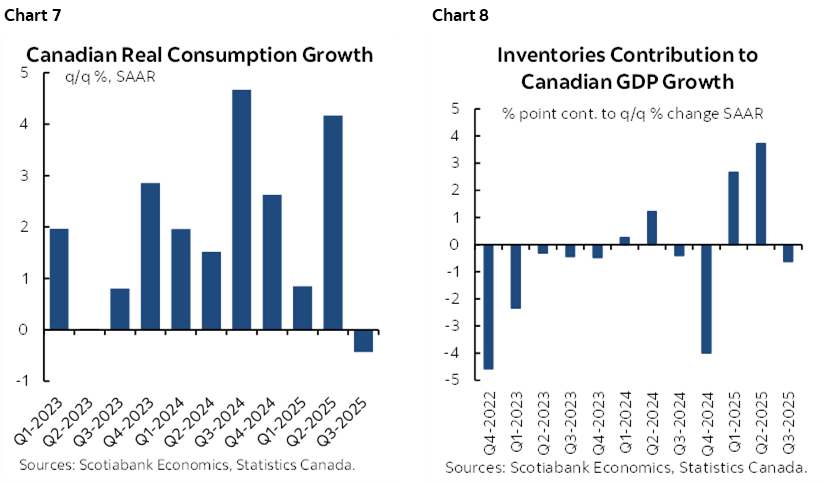
That’s not very surprising. What drove FDD in Q3 was flat consumption. That, in turn, was a moderation from the torrid pace of growth in Q2 (chart 7). Inventories were a minor influence this time after front-loading orders to get ahead of tariffs drove stockpiling over q1 and q2 (chart 8).
FADE OCTOBER’S SOFTNESS
September GDP landed as expected at 0.2% m/m SA but the momentum up to that point was stronger than expected including the upward revisions to August GDP (-0.1% m/m SA instead of –0.3%).
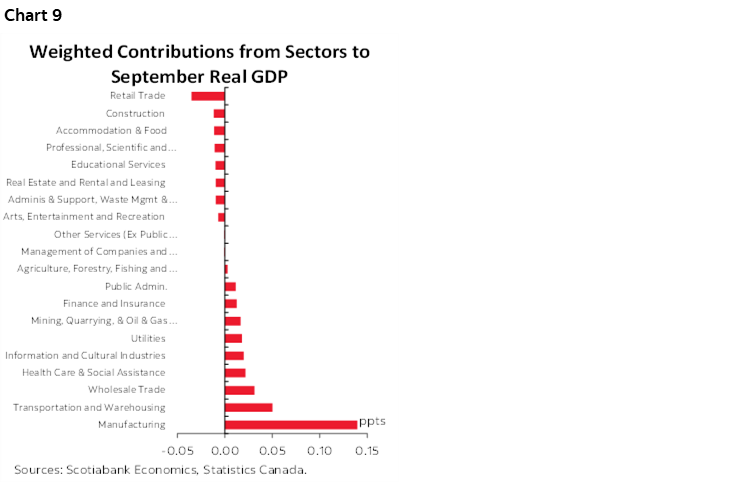
Chart 9 shows that manufacturing was the biggest positive contributor to growth which aligns with the surprising resilience of manufacturing employment. Most other sectors were little changed.
Statcan guided that October GDP is tentatively tracking a drop of –0.3% m/m SA.
Statcan does not provide details for its preliminary estimate of monthly GDP for October. It merely states “Decreases in oil and gas extraction, educational services, and manufacturing were partially offset by increases in mining, quarrying and support services.” Some of this should be faded because of strikes that hit hours worked, since GDP is hours worked times labour productivity. Those strikes were by Alberta teachers and postal workers and also had indirect effects as working parents in Alberta struggled to adapt. There will be a rebound from this effect in November.
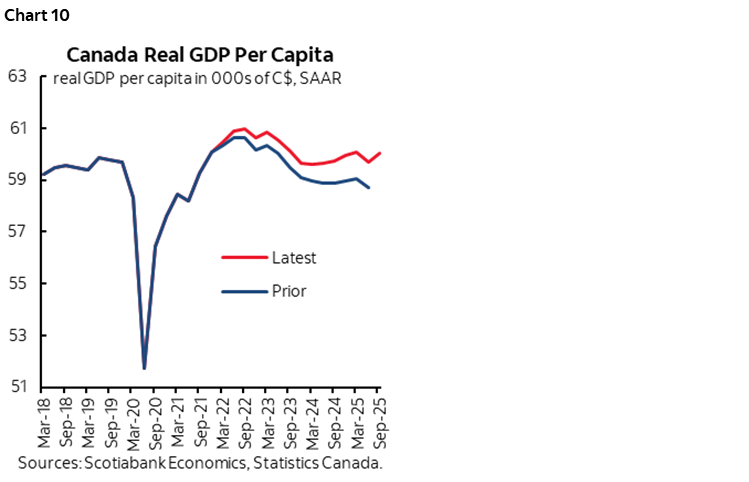
PER CAPITA INCOMES GOT A BOOST
The impact of the GDP revisions raised estimates of per capita income (chart 10). The chart shows GDP per average individual. It’s still poor, but the contraction since 2022 is lower. It’s also the case that the surge of immigration over the 2022-onward period depressed per capita GDP particularly in terms of surging temps. As population growth grinds to a near halt with tighter immigration policy we’re likely to see these per capita numbers begin to turn higher going over coming years.
DISCLAIMER
This report has been prepared by Scotiabank Economics as a resource for the clients of Scotiabank. Opinions, estimates and projections contained herein are our own as of the date hereof and are subject to change without notice. The information and opinions contained herein have been compiled or arrived at from sources believed reliable but no representation or warranty, express or implied, is made as to their accuracy or completeness. Neither Scotiabank nor any of its officers, directors, partners, employees or affiliates accepts any liability whatsoever for any direct or consequential loss arising from any use of this report or its contents.
These reports are provided to you for informational purposes only. This report is not, and is not constructed as, an offer to sell or solicitation of any offer to buy any financial instrument, nor shall this report be construed as an opinion as to whether you should enter into any swap or trading strategy involving a swap or any other transaction. The information contained in this report is not intended to be, and does not constitute, a recommendation of a swap or trading strategy involving a swap within the meaning of U.S. Commodity Futures Trading Commission Regulation 23.434 and Appendix A thereto. This material is not intended to be individually tailored to your needs or characteristics and should not be viewed as a “call to action” or suggestion that you enter into a swap or trading strategy involving a swap or any other transaction. Scotiabank may engage in transactions in a manner inconsistent with the views discussed this report and may have positions, or be in the process of acquiring or disposing of positions, referred to in this report.
Scotiabank, its affiliates and any of their respective officers, directors and employees may from time to time take positions in currencies, act as managers, co-managers or underwriters of a public offering or act as principals or agents, deal in, own or act as market makers or advisors, brokers or commercial and/or investment bankers in relation to securities or related derivatives. As a result of these actions, Scotiabank may receive remuneration. All Scotiabank products and services are subject to the terms of applicable agreements and local regulations. Officers, directors and employees of Scotiabank and its affiliates may serve as directors of corporations.
Any securities discussed in this report may not be suitable for all investors. Scotiabank recommends that investors independently evaluate any issuer and security discussed in this report, and consult with any advisors they deem necessary prior to making any investment.
This report and all information, opinions and conclusions contained in it are protected by copyright. This information may not be reproduced without the prior express written consent of Scotiabank.
™ Trademark of The Bank of Nova Scotia. Used under license, where applicable.
Scotiabank, together with “Global Banking and Markets”, is a marketing name for the global corporate and investment banking and capital markets businesses of The Bank of Nova Scotia and certain of its affiliates in the countries where they operate, including; Scotiabank Europe plc; Scotiabank (Ireland) Designated Activity Company; Scotiabank Inverlat S.A., Institución de Banca Múltiple, Grupo Financiero Scotiabank Inverlat, Scotia Inverlat Casa de Bolsa, S.A. de C.V., Grupo Financiero Scotiabank Inverlat, Scotia Inverlat Derivados S.A. de C.V. – all members of the Scotiabank group and authorized users of the Scotiabank mark. The Bank of Nova Scotia is incorporated in Canada with limited liability and is authorised and regulated by the Office of the Superintendent of Financial Institutions Canada. The Bank of Nova Scotia is authorized by the UK Prudential Regulation Authority and is subject to regulation by the UK Financial Conduct Authority and limited regulation by the UK Prudential Regulation Authority. Details about the extent of The Bank of Nova Scotia's regulation by the UK Prudential Regulation Authority are available from us on request. Scotiabank Europe plc is authorized by the UK Prudential Regulation Authority and regulated by the UK Financial Conduct Authority and the UK Prudential Regulation Authority.
Scotiabank Inverlat, S.A., Scotia Inverlat Casa de Bolsa, S.A. de C.V, Grupo Financiero Scotiabank Inverlat, and Scotia Inverlat Derivados, S.A. de C.V., are each authorized and regulated by the Mexican financial authorities.
Not all products and services are offered in all jurisdictions. Services described are available in jurisdictions where permitted by law.