- After slipping in September, retail sales surged in October…
- ….but beware money illusion...
- ...as the large majority of that gain was due to higher prices
- Large gains in manufacturing and wholesale sales in October…
- ...probably also had big contributions from higher prices
- Overall, GDP growth has slowed toward 1½% at an annualized rate in 2022H2…
- ...after a torrid world beating pace of growth over 2021Q3 to 2022Q2
- Canada’s economy therefore remains well into excess demand conditions…
- ...with no evidence of aggregate slack emerging as growth is matching potential…
- ...which keeps the pressure on the BoC in the context of lagging effects…
- ...that so far continue to tile toward the greater risk of undertightening
Trend Canadian economic growth is definitely slowing by a material mount but not fast enough to make any progress toward the goal of getting inflationary pressures in line with the BoC’s target. This conclusion is derived by updating tracking figures with attempts at converting Statcan guidance for changes in a suite of nominal indicators made available this morning to volume-based readings.
AFTER TORRID GROWTH, SOMETHING SLOWER IS WELCOME
After posting Q2 GDP growth of 4.2% q/q at a seasonally adjusted and annualized rate (SAAR), I'm tracking growth of about 1½% in Q3 (numbers out next week) and Q4 is running at a similar pace on an extremely tentative basis since obviously we don't have much Q4 data. September GDP is estimated at 0% m/m while October is tracking growth of 0.3% m/m.
That's not bad mind you. It suggests that actual GDP growth is keeping pace with very rough guesstimates for potential GDP growth and so far the economy is avoiding a contraction in 2022H2 after the explosive world-beating growth from 2021Q3 through to Q2 of this year.
It also says that the economy is not yet opening up any disinflationary slack which requires a protracted period of actual GDP growth below the economy's potential GDP growth that takes into account expansion of the labour force, cap ex, tech changes etc etc.
If no slack is opening up then that in turn says that the BoC should still view the economy as stuck in material excess demand conditions with an incredibly strong job market as employment is at a record high with the 108k gain in October. Canada is generating quicker wage growth than the US because its labour market is tighter and I don’t subscribe to the BoC’s narrative that wage growth is peaking as opposed to viewing that as a product of exercising its moral suasion powers. This is also more inflation in Canada because of the country’s awful performance on labour productivity that has tumbled during the pandemic. A tight economy generating wage gains above the growth rate in productivity alongside an undervalued currency is courting a protracted challenge to the BoC’s inflation target that probably slants the risks more toward undertightening than overtightening.
There are of course lagging effects of tightening monetary policy and it’s too early to assess these lags given that the BoC’s slow footed withdrawal of stimulus began (on rates) with the first hike just eight months ago. The only point to the comments above is that Canada needs to open up a lot of slack in the economy in order to cool inflationary pressures that have both demand-side and supply-side drivers and both of these sets of drivers should be targeted by monetary policy in order to align the two over time.
Assumptions
To arrive at this, I’m using a simple regression fit of monthly GDP that is based on production accounts against a limited number of high frequency volume measures, several of which were updated this morning.
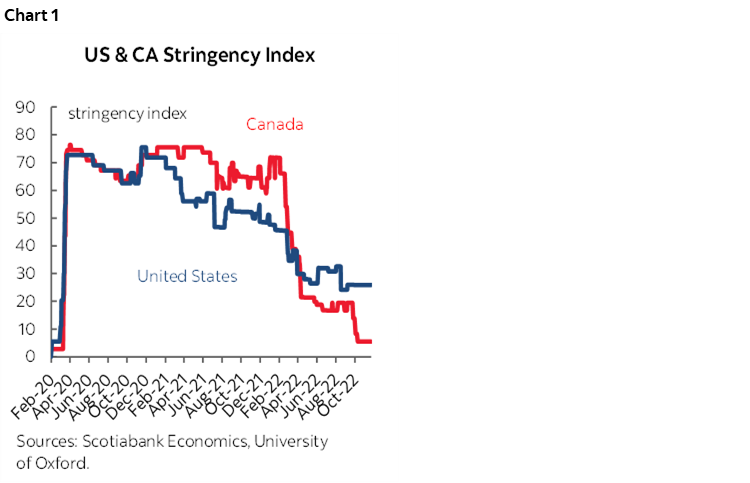
Because most of our tracking ability through official statistics is based upon the old economy that was skewed toward goods production, we have to then make adjustments for what we think is going on in services. I think there are upside risks to both the September and October readings because service sector indicators are looking strong as Canadian COVID-19 restrictions have been easier than the US and at their lowest levels of the pandemic (chart 1). The implication is that pent-up services demand is doing a little better for longer in Canada than the US. The flip side is that I still think one reason US retail sales beat expectations for October is that Americans rotated back into goods spending and away from services that are under-sampled in US retail sales.
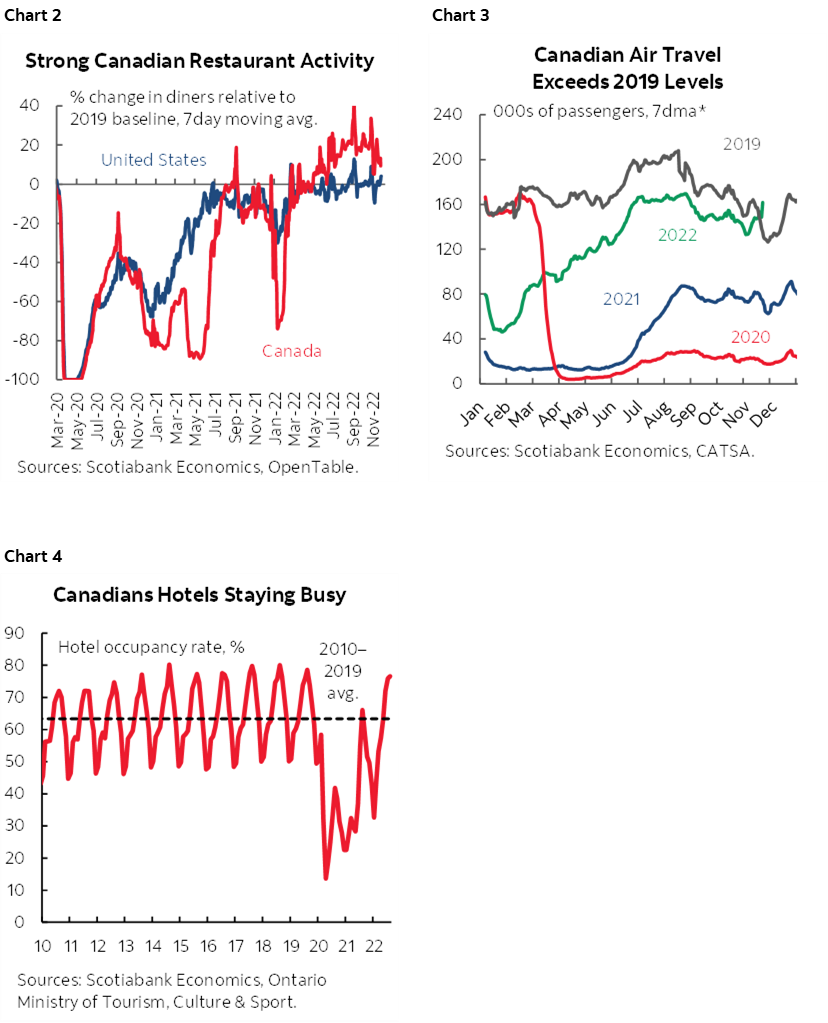
Charts 2–4 show a few indications of this. Canadian restaurants are more active than in the US. Flights, well, took off as mask requirements and the ill-fated Arrivecan app were eliminated and business travel has improved. Hotel occupancy is more dated with figures only up to August but also shows the rebound.
This approach to forecasting GDP using monthly accounts stands in contrast to expenditure-based GDP that is quarterly and which is what most forecasters including the Bank of Canada focus upon. There can be deviations in the two concepts, such as the fact that expenditure-based GDP takes into account how higher output was achieved by considering inventory and import swings that are not considered in monthly GDP.
It’s also important to note that I’ve made rough attempts at converting Statcan ‘flash’ guidance for activity in October that is only available in nominal terms to volume concepts that better align with GDP concepts as a crude proxy for changes in value added activity upon which GDP is based. To not make such an attempt and simply point to strong gains in nominal variables flunks Econ-101 by succumbing to the concept of money illusion.
WHAT WERE THOSE INDICATORS?
1. Retail sales
Canadian retail sales were up by 1.5% m/m in October after declining by 0.5% m/m in September with the prior month’s 0.7% m/m rise revised down to 0.4%. These are all percentage changes to dollar amounts.
The volume of sales fell 0.1% m/m in September and so lower prices did most of the damage to the 0.5% m/m decline in total retail sales that month.
Statcan does not provide any indication of what happened to the volume of sales in October. However, the 10% weight on gas station sales in nominal retail sales and the 9% m/m rise in gas prices that month probably meant that higher gas prices accounted for about 0.9 ppts of the 1.5% 'flash' guidance for October's total nominal retail sales growth. Then add on general inflation aside from higher gas prices that drove prices ex-energy up by 0.5% m/m SA and you probably had only a minor increase in the volume of sales during October in the low tenths of percentage points in October. In my calculations I assumed that retail sales volumes were up by only around 0.3% m/m in October.
Quarterly tracking of the growth in the volume of Canadian retail sales isn't terribly flattering. They were up by 2.2% q/q SAAR in Q2, down 5.4% in Q3 and Q4 tentatively has 1.9% baked in based solely on the Q3 avg and the October start assuming Nov and Dec are flat in order to focus the math on the known factors thus far.
Chart 5 shows the tracking of the level of sales in dollar and volume terms.
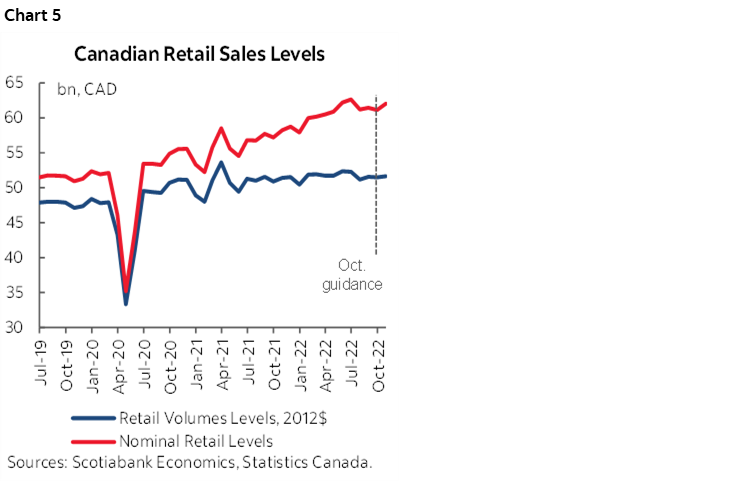
Chart 6 shows the tracking of quarterly annualized growth in retail sales volumes over time.
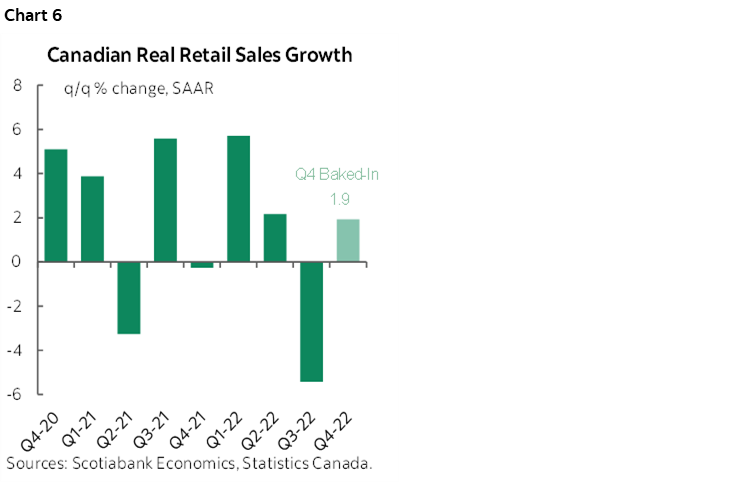
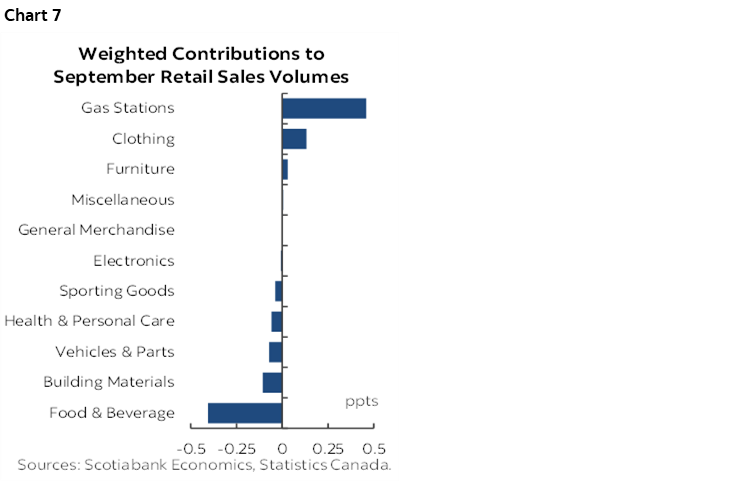
Chart 7 shows the breakdown of the weighted contributions to the -0.1% m/m decline in September's retail sales volumes. Other than gas station volumes and a minor assist from clothing sales there wasn’t much else on the plus side. In essence, as gas prices fell and either gasoline volumes increased with more driving and/or folks bought a lot of other junk at gas stations, or both. Beyond that it was pretty weak aside from a minor assist from clothing.
2. Manufacturing and wholesale sectors assisted growth
Beyond retail, there were other 'flash' estimates provided for October.
Manufacturing sales were up 2% m/m in that month with drivers including food, chemical and energy sectors. We don't know how much of this was driven by volumes versus prices as they don't provide that detail in the flashes. I’ve assumed half of that was due to higher volumes in the GDP calcs.
The Canadian wholesale sales 'flash' was up by 1.3% m/m "largely reflecting higher sales in the building material and supplies sector". The same issue exists here in that it’s only a dollar change estimate with no details to inform volumes. I’ve estimated that less than half of that was due to higher volumes.
DISCLAIMER
This report has been prepared by Scotiabank Economics as a resource for the clients of Scotiabank. Opinions, estimates and projections contained herein are our own as of the date hereof and are subject to change without notice. The information and opinions contained herein have been compiled or arrived at from sources believed reliable but no representation or warranty, express or implied, is made as to their accuracy or completeness. Neither Scotiabank nor any of its officers, directors, partners, employees or affiliates accepts any liability whatsoever for any direct or consequential loss arising from any use of this report or its contents.
These reports are provided to you for informational purposes only. This report is not, and is not constructed as, an offer to sell or solicitation of any offer to buy any financial instrument, nor shall this report be construed as an opinion as to whether you should enter into any swap or trading strategy involving a swap or any other transaction. The information contained in this report is not intended to be, and does not constitute, a recommendation of a swap or trading strategy involving a swap within the meaning of U.S. Commodity Futures Trading Commission Regulation 23.434 and Appendix A thereto. This material is not intended to be individually tailored to your needs or characteristics and should not be viewed as a “call to action” or suggestion that you enter into a swap or trading strategy involving a swap or any other transaction. Scotiabank may engage in transactions in a manner inconsistent with the views discussed this report and may have positions, or be in the process of acquiring or disposing of positions, referred to in this report.
Scotiabank, its affiliates and any of their respective officers, directors and employees may from time to time take positions in currencies, act as managers, co-managers or underwriters of a public offering or act as principals or agents, deal in, own or act as market makers or advisors, brokers or commercial and/or investment bankers in relation to securities or related derivatives. As a result of these actions, Scotiabank may receive remuneration. All Scotiabank products and services are subject to the terms of applicable agreements and local regulations. Officers, directors and employees of Scotiabank and its affiliates may serve as directors of corporations.
Any securities discussed in this report may not be suitable for all investors. Scotiabank recommends that investors independently evaluate any issuer and security discussed in this report, and consult with any advisors they deem necessary prior to making any investment.
This report and all information, opinions and conclusions contained in it are protected by copyright. This information may not be reproduced without the prior express written consent of Scotiabank.
™ Trademark of The Bank of Nova Scotia. Used under license, where applicable.
Scotiabank, together with “Global Banking and Markets”, is a marketing name for the global corporate and investment banking and capital markets businesses of The Bank of Nova Scotia and certain of its affiliates in the countries where they operate, including; Scotiabank Europe plc; Scotiabank (Ireland) Designated Activity Company; Scotiabank Inverlat S.A., Institución de Banca Múltiple, Grupo Financiero Scotiabank Inverlat, Scotia Inverlat Casa de Bolsa, S.A. de C.V., Grupo Financiero Scotiabank Inverlat, Scotia Inverlat Derivados S.A. de C.V. – all members of the Scotiabank group and authorized users of the Scotiabank mark. The Bank of Nova Scotia is incorporated in Canada with limited liability and is authorised and regulated by the Office of the Superintendent of Financial Institutions Canada. The Bank of Nova Scotia is authorized by the UK Prudential Regulation Authority and is subject to regulation by the UK Financial Conduct Authority and limited regulation by the UK Prudential Regulation Authority. Details about the extent of The Bank of Nova Scotia's regulation by the UK Prudential Regulation Authority are available from us on request. Scotiabank Europe plc is authorized by the UK Prudential Regulation Authority and regulated by the UK Financial Conduct Authority and the UK Prudential Regulation Authority.
Scotiabank Inverlat, S.A., Scotia Inverlat Casa de Bolsa, S.A. de C.V, Grupo Financiero Scotiabank Inverlat, and Scotia Inverlat Derivados, S.A. de C.V., are each authorized and regulated by the Mexican financial authorities.
Not all products and services are offered in all jurisdictions. Services described are available in jurisdictions where permitted by law.