- Decent headline, lousy details
- Fudged seasonal adjustments avoided a payroll drop
- There was very poor breadth as most of the job market has ground to a halt
- Highest continuing claims point to rising unemployment
- Markets reacted dovishly to the details and claims data. So should FOMC officials.
- Nonfarm payrolls, m/m 000s / UR %, SA, September:
- Actual: 119 / 4.4
- Scotia: -20 / 4.2
- Consensus: 51 / 4.3
- Prior: -4 / 4.3 (revised from 22 / 4.3)
Putting aside the grievance that I was wrong about the headline this time given 119k payroll jobs were added in September (but on details made money for clients given the market reaction), I’m still calling this report a near disaster. It should be good enough for the FOMC to cut in December and I’ll explain why. Pairing the report to continuing claims data strengthens this argument on the path to the October and November readings. I now have more confidence in my -90k call for October payrolls.
Markets responded by pushing Treasury yields lower with 2s through 10s down by about 3–4bps. The dollar weakened in the aftermath. Pricing for the December FOMC meeting moved up by 3bps to about 9bps of a cut priced at the moment. My reading of vote-weighted FOMC members is such that I think December pricing is probably too low.
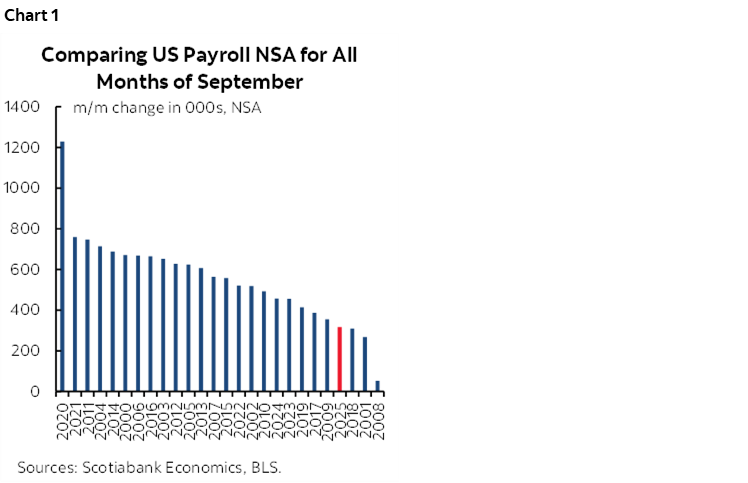
First, the seasonally unadjusted pace of hiring was close to my expectations. I had figured about 350k m/m and it came in at 317k. Seasonally unadjusted hiring is usually positive in September (think school year etc) but this September registered the fourth weakest month on record (chart 1).
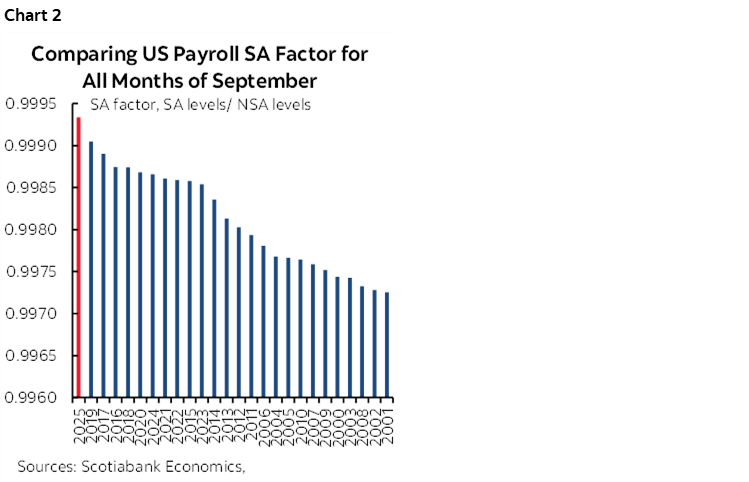
Second, what was offsetting, however, was the strongest seasonal adjustment factor ever applied on record for a month of September (chart 2). With no explanation. These factors are fudged and subject to distortions imo.
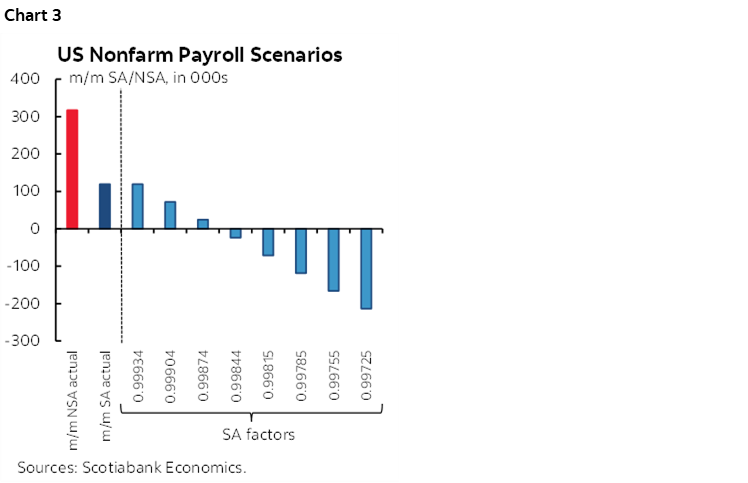
Third, to give a sense of how much this matters, see chart 3. At almost any other typical SA factor for the month of September, payrolls would have shrunk. Perhaps by a lot!
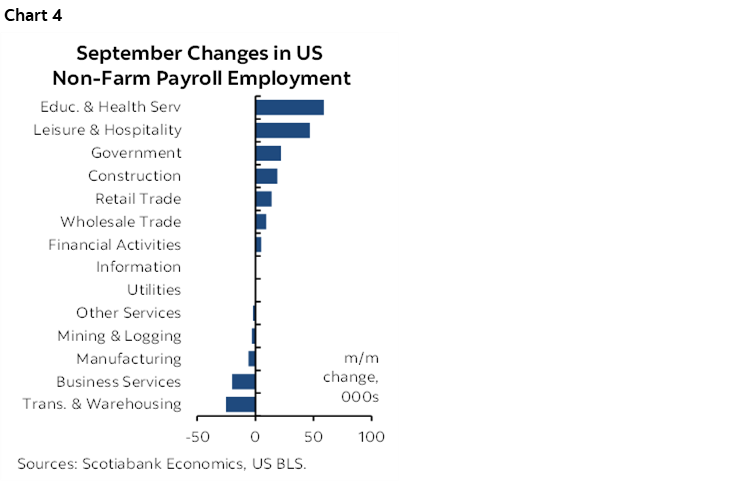
Fourth, there was very low breadth to the gain. Leisure/hospitality was up by 47k and the education sector added 57K. There was literally nothing material across all other sectors certainly in the private sector (chart 4).
Fifth, one minor exception is that government added 22k entirely at the state and local levels as the federal government shed only 3k. Funny, I thought DOGE packages were expiring last month and that while more would drop off in October, there would be a pickup in the number of lost jobs in the federal government from the prior month’s 14k as they secured other jobs before packages ran out. Either they didn’t or be careful here.
Sixth, some of the job gain would be a perverse reaction to ICE raids. A growing number of jobs in the health care sector are accompanied by Visas and green card sponsorship which may reflect hotter demand as a way of avoiding expulsion than what was already becoming apparent before the raids (here). The share of Indeed job postings that include visas or green card sponsorships has been rising since 2021. Outside of health, job postings are tumbling and we’re weeks away from when about $35 billion of funding in the Affordable Care Act expires at year-end, driving insurance premiums sharply higher for an estimated 22 millions Americans and with it perhaps less demand for healthcare workers that may have been over-hired.
Seventh, the trend is soft. Only 193k jobs have been added in the five months since April.
Eighth, revisions removed 33k jobs over the prior two months. August turned negative.
OTHER DETAILS ADDED TO THE SOFT TONE
The unemployment rate edged up to 4.4% which has nothing to do with nonfarm as it’s derived from the household survey. The wonky household survey registered +251k jobs but the labour force expanded by 470k. The confidence bands on the household survey are multiples higher than nonfarm's.
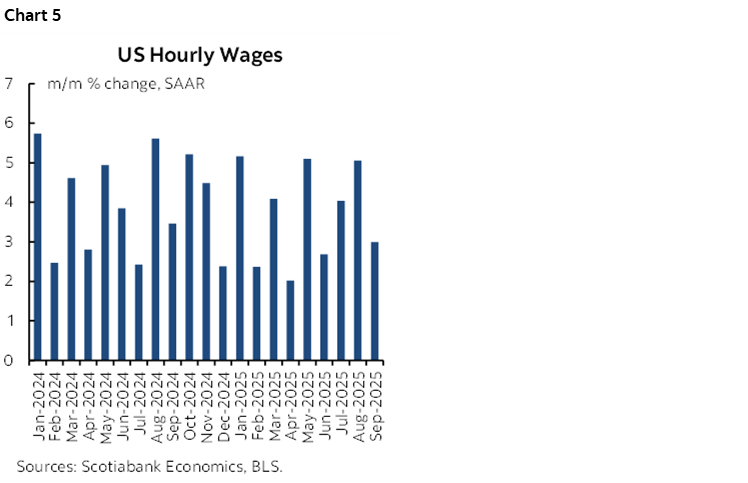
There was little wage growth in September (0.2% m/m SA, 3% m/m SAAR). Chart 5.
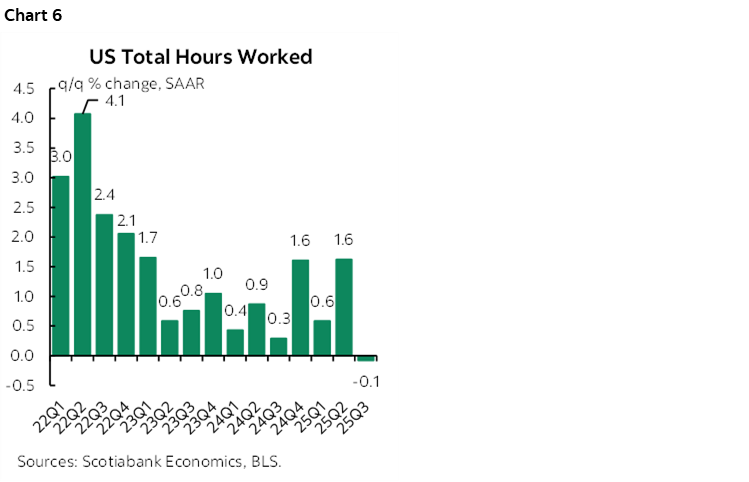
Hours worked were flat (+0.07% m/m SA). Hours worked have ground to a halt in Q3 (-0.08% q/q SAAR) which means that solid Q3 GDP tracking is entirely driven by productivity (chart 6). Hours times wages get folks paid and they both came in softly. A flattening of hours worked while productivity accelerates is a telltale first-response cyclical warning sign for employment going forward.
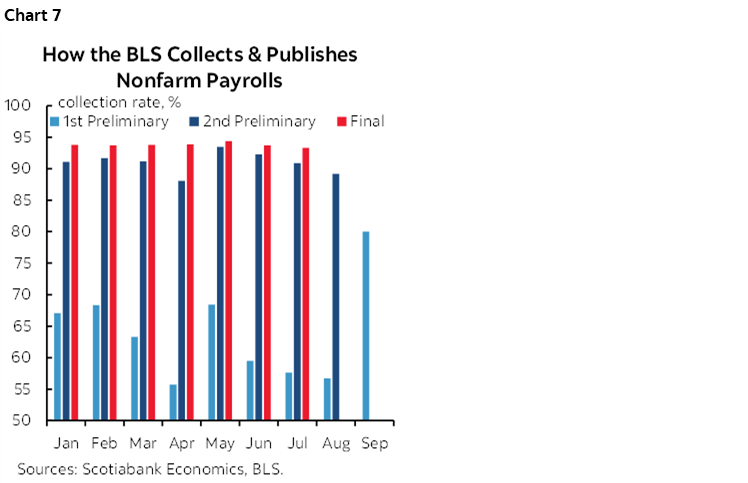
There was a much higher collection rate this time given they had more time to collect the data (chart 7). That means lower revision risk to September when the next numbers come around.
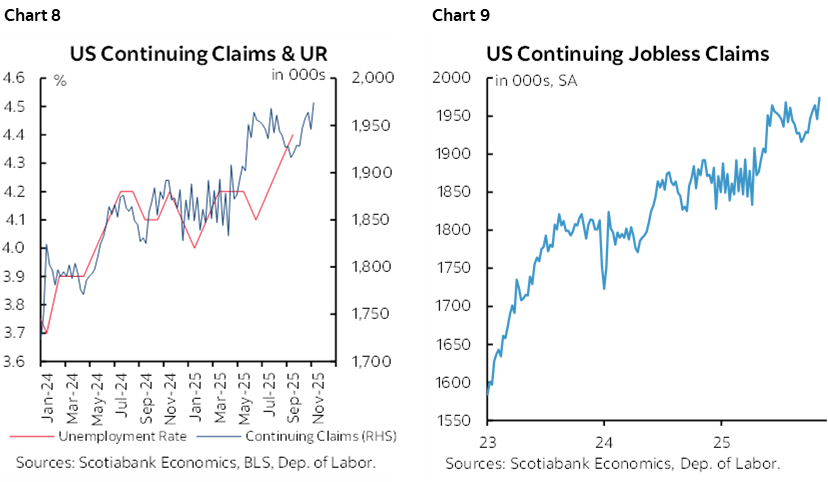
Weekly continuing claims shouldn't surprise anyone given advance tracking using the sum of states after applying seasonal adjustments, but they are at the highest levels since late 2021. Fired workers are not getting reabsorbed. Charts 8, 9.
DISCLAIMER
This report has been prepared by Scotiabank Economics as a resource for the clients of Scotiabank. Opinions, estimates and projections contained herein are our own as of the date hereof and are subject to change without notice. The information and opinions contained herein have been compiled or arrived at from sources believed reliable but no representation or warranty, express or implied, is made as to their accuracy or completeness. Neither Scotiabank nor any of its officers, directors, partners, employees or affiliates accepts any liability whatsoever for any direct or consequential loss arising from any use of this report or its contents.
These reports are provided to you for informational purposes only. This report is not, and is not constructed as, an offer to sell or solicitation of any offer to buy any financial instrument, nor shall this report be construed as an opinion as to whether you should enter into any swap or trading strategy involving a swap or any other transaction. The information contained in this report is not intended to be, and does not constitute, a recommendation of a swap or trading strategy involving a swap within the meaning of U.S. Commodity Futures Trading Commission Regulation 23.434 and Appendix A thereto. This material is not intended to be individually tailored to your needs or characteristics and should not be viewed as a “call to action” or suggestion that you enter into a swap or trading strategy involving a swap or any other transaction. Scotiabank may engage in transactions in a manner inconsistent with the views discussed this report and may have positions, or be in the process of acquiring or disposing of positions, referred to in this report.
Scotiabank, its affiliates and any of their respective officers, directors and employees may from time to time take positions in currencies, act as managers, co-managers or underwriters of a public offering or act as principals or agents, deal in, own or act as market makers or advisors, brokers or commercial and/or investment bankers in relation to securities or related derivatives. As a result of these actions, Scotiabank may receive remuneration. All Scotiabank products and services are subject to the terms of applicable agreements and local regulations. Officers, directors and employees of Scotiabank and its affiliates may serve as directors of corporations.
Any securities discussed in this report may not be suitable for all investors. Scotiabank recommends that investors independently evaluate any issuer and security discussed in this report, and consult with any advisors they deem necessary prior to making any investment.
This report and all information, opinions and conclusions contained in it are protected by copyright. This information may not be reproduced without the prior express written consent of Scotiabank.
™ Trademark of The Bank of Nova Scotia. Used under license, where applicable.
Scotiabank, together with “Global Banking and Markets”, is a marketing name for the global corporate and investment banking and capital markets businesses of The Bank of Nova Scotia and certain of its affiliates in the countries where they operate, including; Scotiabank Europe plc; Scotiabank (Ireland) Designated Activity Company; Scotiabank Inverlat S.A., Institución de Banca Múltiple, Grupo Financiero Scotiabank Inverlat, Scotia Inverlat Casa de Bolsa, S.A. de C.V., Grupo Financiero Scotiabank Inverlat, Scotia Inverlat Derivados S.A. de C.V. – all members of the Scotiabank group and authorized users of the Scotiabank mark. The Bank of Nova Scotia is incorporated in Canada with limited liability and is authorised and regulated by the Office of the Superintendent of Financial Institutions Canada. The Bank of Nova Scotia is authorized by the UK Prudential Regulation Authority and is subject to regulation by the UK Financial Conduct Authority and limited regulation by the UK Prudential Regulation Authority. Details about the extent of The Bank of Nova Scotia's regulation by the UK Prudential Regulation Authority are available from us on request. Scotiabank Europe plc is authorized by the UK Prudential Regulation Authority and regulated by the UK Financial Conduct Authority and the UK Prudential Regulation Authority.
Scotiabank Inverlat, S.A., Scotia Inverlat Casa de Bolsa, S.A. de C.V, Grupo Financiero Scotiabank Inverlat, and Scotia Inverlat Derivados, S.A. de C.V., are each authorized and regulated by the Mexican financial authorities.
Not all products and services are offered in all jurisdictions. Services described are available in jurisdictions where permitted by law.