- Canadian headline inflation lands on consensus, markets yawned
- Most core inflation readings remain too warm to have eased…
- …or to contemplate further easing…
- …as the BoC has strongly signalled a prolonged pause
- CDN CPI, m/m % / y/y %, NSA, October:
- Actual: 0.2 / 2.2
- Scotia: 0.2 / 2.1
- Consensus: 0.2 / 2.1
- Prior: 0.1 / 2.4
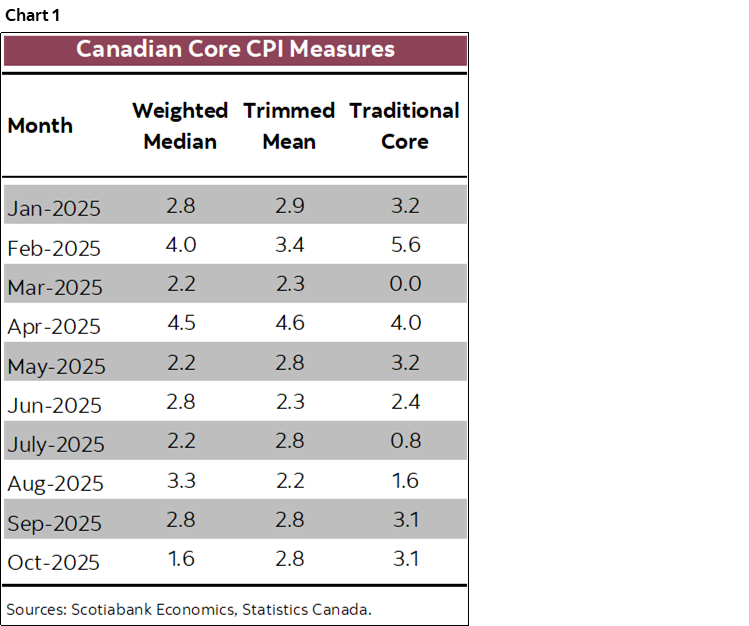
- Main core measures, m/m % SAAR, October:
- Trimmed mean CPI: 2.8
- Weighted median CPI: 1.6
- CPI ex-f&e: 3.1 (prior revised up to 3.1% from 2.3%)
Well, this was the predictable yawner. CAD and government bond yields barely flinched when they saw the CPI readings. Headline was on consensus and the core gauges are a mixed grab bag of readings that on balance came in quite warm. In fact, the suite of the core measures suggest core pressures at the margin that question recent easing.
In any event, the BoC doesn’t seem to know which measure(s) of core inflation it’s primarily interested in and so markets also have difficulty determining how the BoC would view the readings. Regardless, the clear message from the BoC is that it is on a prolonged hold barring major shocks.
Details
Total inflation was up 0.2% m/m seasonally unadjusted (NSA) and 0.1% m/m SA. The year-over-year rate eased to 2.1% from 2.4% mainly on shifting year-ago base effects.
The core inflation measures were highly dispersed but three out of the four main ones were all rather warm. At seasonally adjusted and annualized rates, traditional core CPI (ex-food and energy) was up 3.1% and the prior month’s reading was revised sharply higher to 3.1% from 2.3%. At the opposite end was weighted median CPI at 1.6%. In the upper middle of the range was trimmed mean CPI at 2.8%. CPI excluding the eight most volatile items that used to be the BoC’s preferred gauge was up by 3.8% for a second consecutive month. Chart 1 shows some of them.
The usual caution against using y/y measures for trimmed mean and weighted median CPI remains focused on how they are not spot readings; they are rolling weighted m/m readings that are very slow moving in response to recent developments. As such, the fresher m/m measures provide a better picture of inflationary pressures at the margin.
These are not light readings on balance. The suite of them over recent months indicates that core inflation remains too persistently too warm to a) have eased of late, and b) for any further easing to be contemplated.
Inflation was driven by services again as goods price inflation remains tame (charts 2, 3).
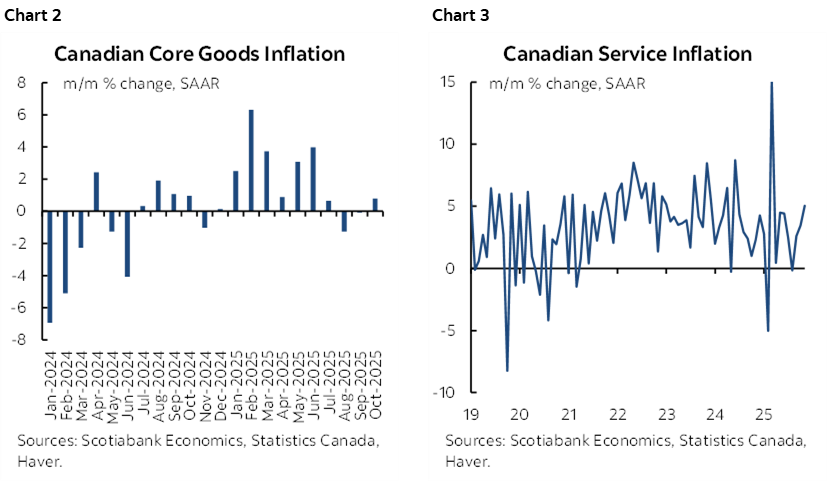
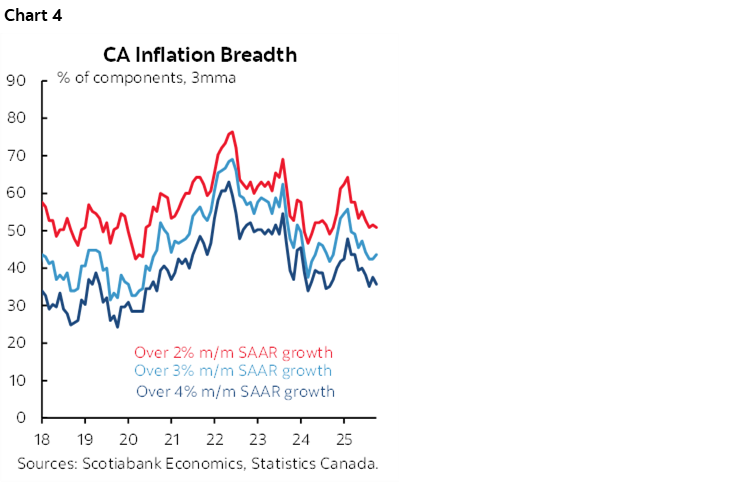
Chart 4 shows that breadth of inflationary pressures stabilized.
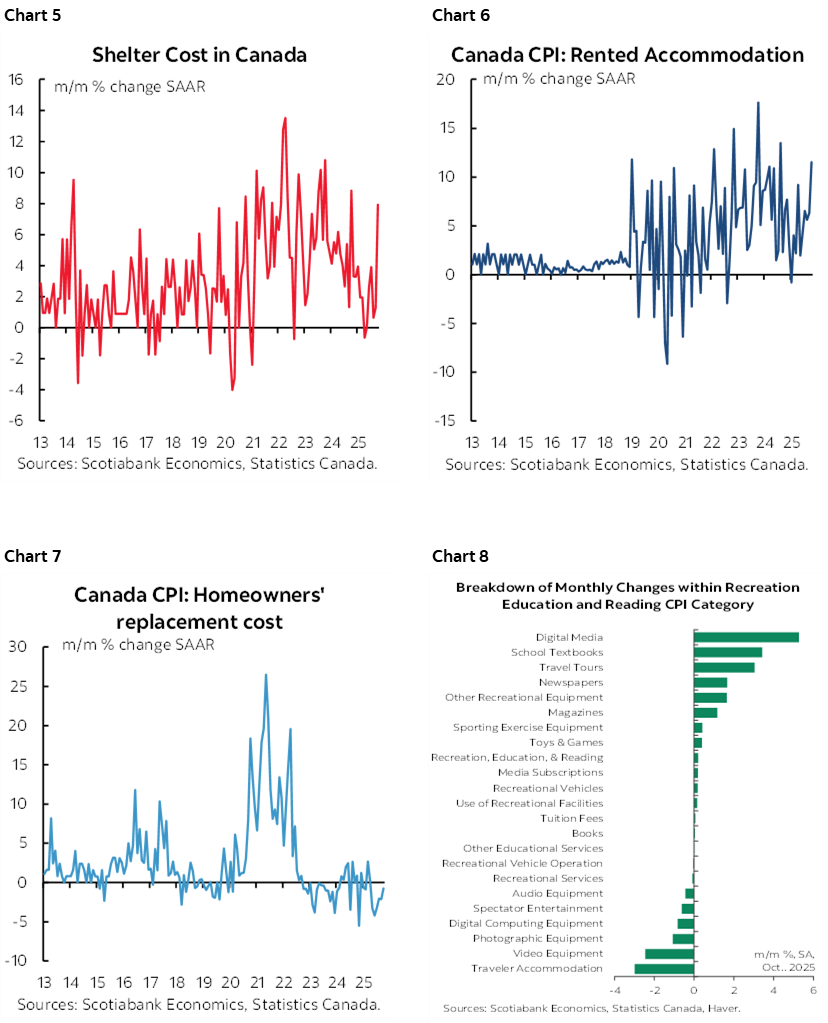
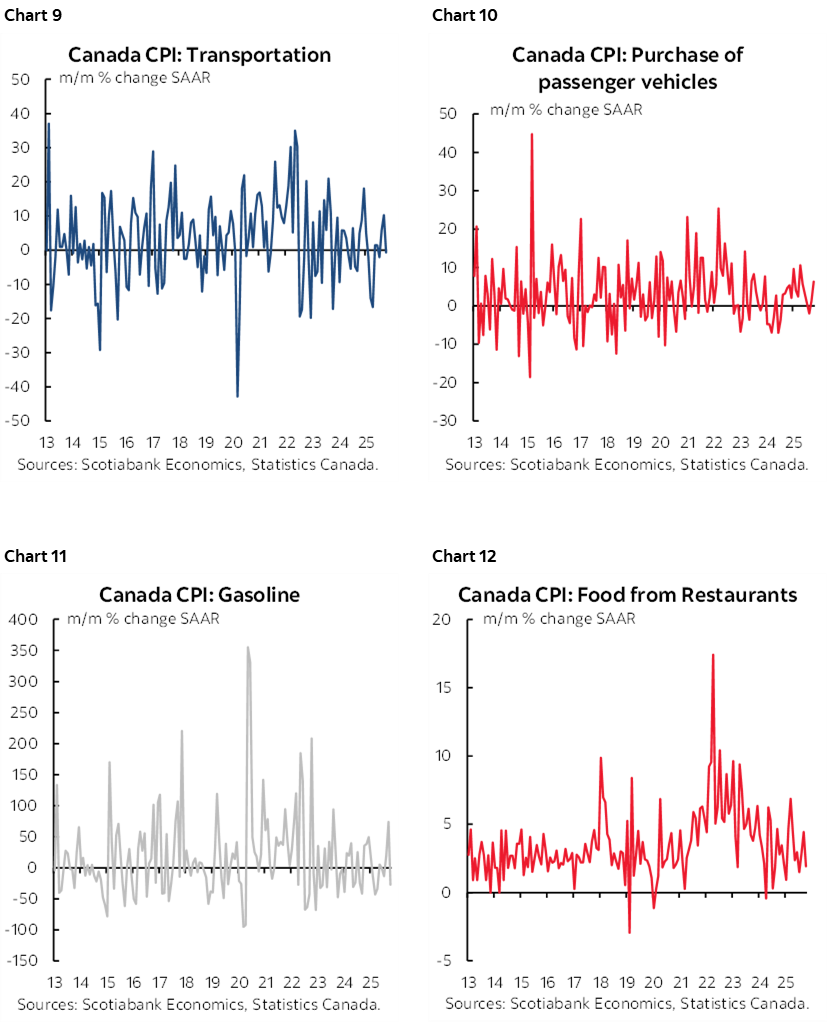
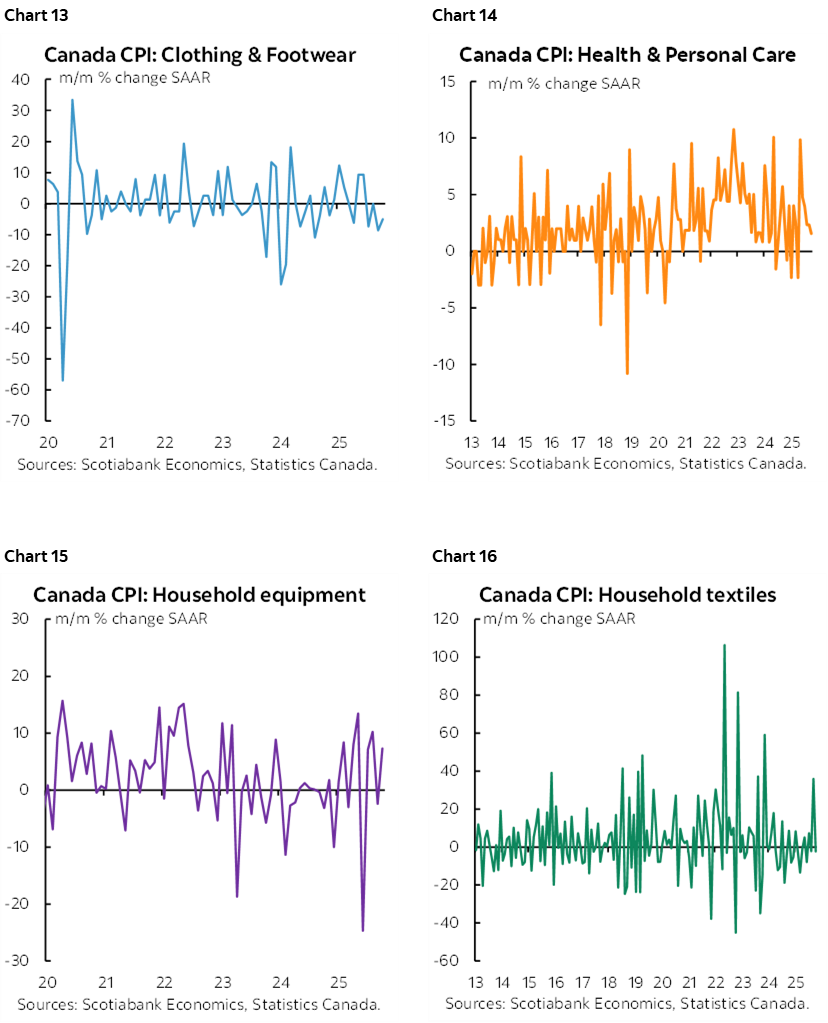
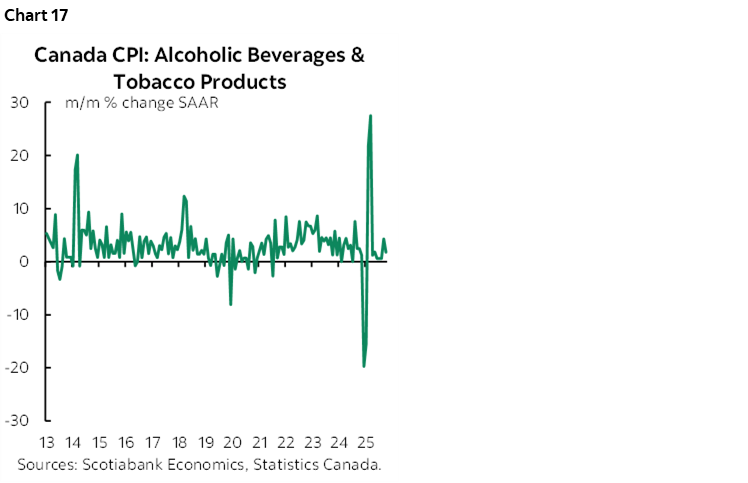
Charts 5–17 show individual parts of the CPI basket. Shelter was hot and driven by surging rent despite stories of fewer temp residents causing less rent inflation. The rec/reading/education category was driven by several components including new school year costs.
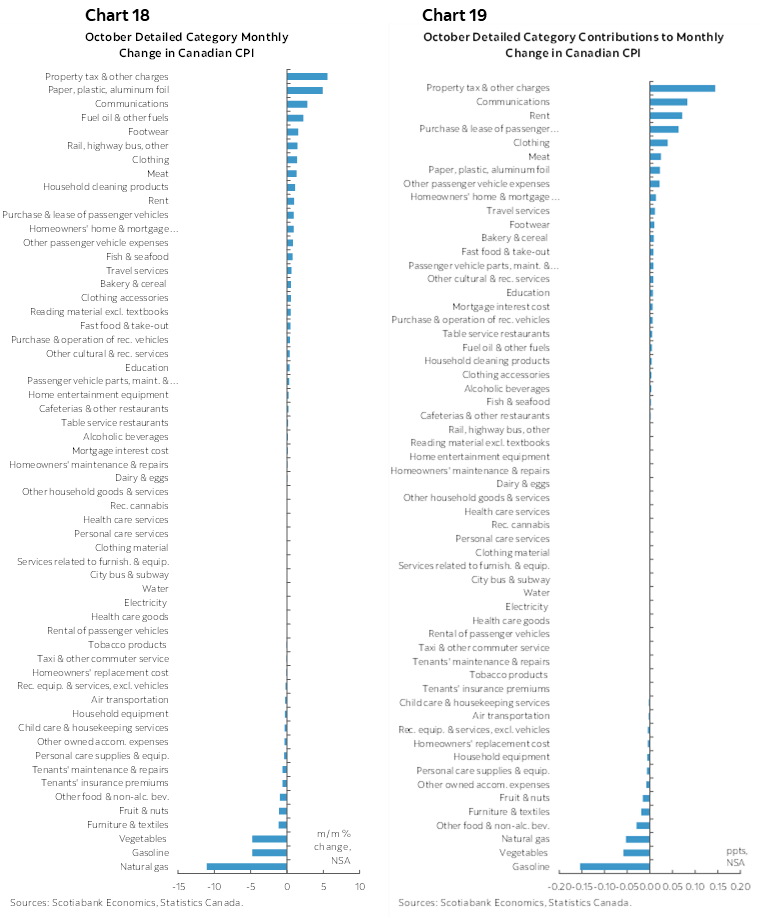
Charts 18–19 break down the CPI basket in unweighted m/m terms and in terms of weighted contributions to the overall rate of inflation.
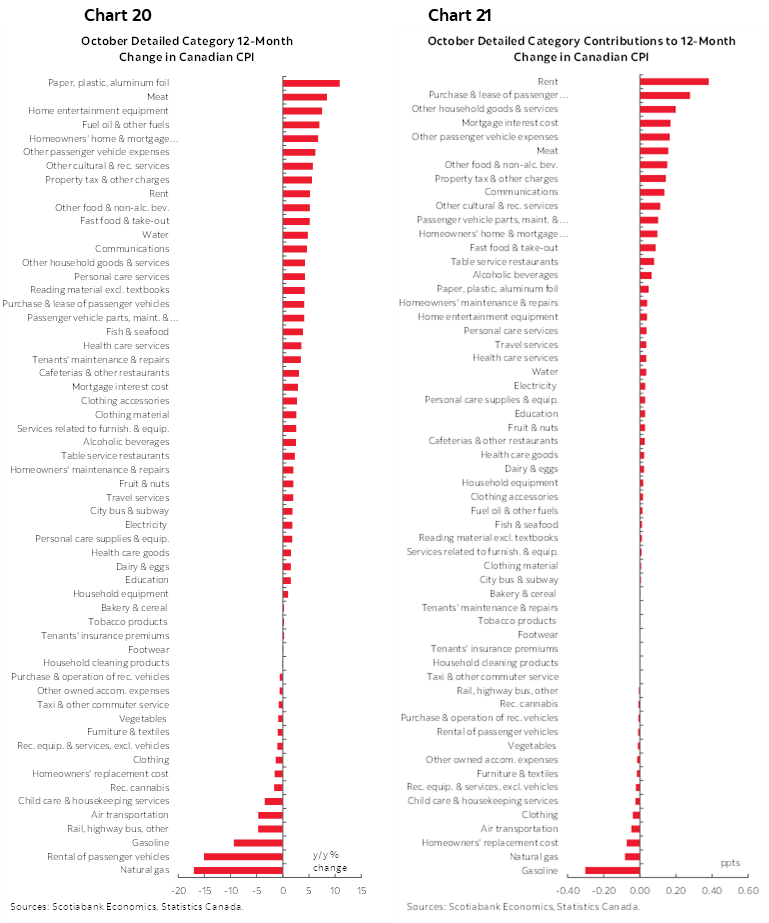
Charts 20–21 do likewise in y/y terms.
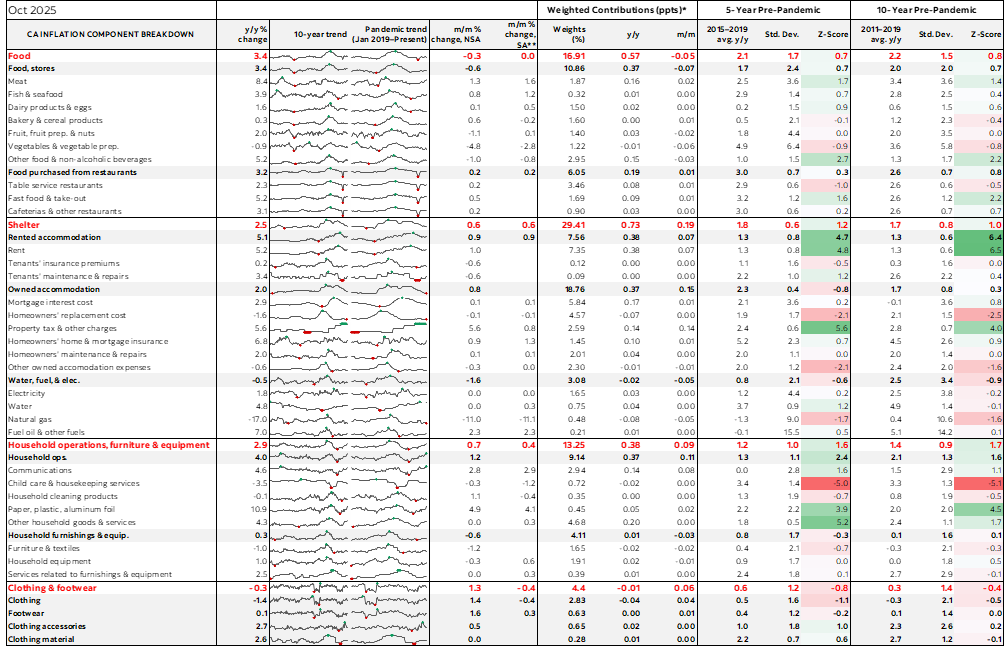
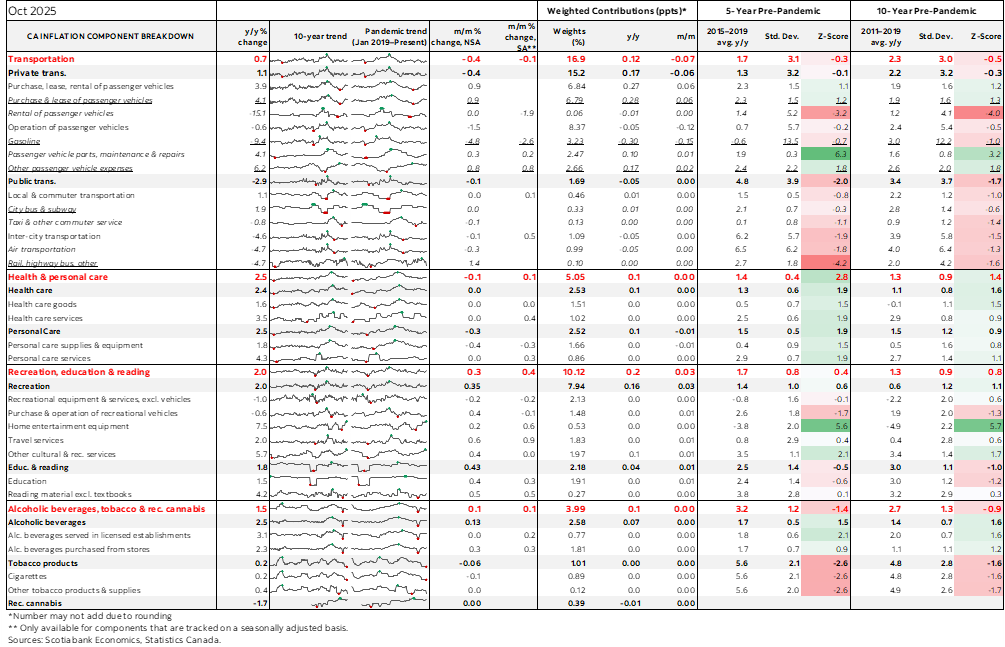
Please also see the accompanying detailed table with more measures and micro charts.
DISCLAIMER
This report has been prepared by Scotiabank Economics as a resource for the clients of Scotiabank. Opinions, estimates and projections contained herein are our own as of the date hereof and are subject to change without notice. The information and opinions contained herein have been compiled or arrived at from sources believed reliable but no representation or warranty, express or implied, is made as to their accuracy or completeness. Neither Scotiabank nor any of its officers, directors, partners, employees or affiliates accepts any liability whatsoever for any direct or consequential loss arising from any use of this report or its contents.
These reports are provided to you for informational purposes only. This report is not, and is not constructed as, an offer to sell or solicitation of any offer to buy any financial instrument, nor shall this report be construed as an opinion as to whether you should enter into any swap or trading strategy involving a swap or any other transaction. The information contained in this report is not intended to be, and does not constitute, a recommendation of a swap or trading strategy involving a swap within the meaning of U.S. Commodity Futures Trading Commission Regulation 23.434 and Appendix A thereto. This material is not intended to be individually tailored to your needs or characteristics and should not be viewed as a “call to action” or suggestion that you enter into a swap or trading strategy involving a swap or any other transaction. Scotiabank may engage in transactions in a manner inconsistent with the views discussed this report and may have positions, or be in the process of acquiring or disposing of positions, referred to in this report.
Scotiabank, its affiliates and any of their respective officers, directors and employees may from time to time take positions in currencies, act as managers, co-managers or underwriters of a public offering or act as principals or agents, deal in, own or act as market makers or advisors, brokers or commercial and/or investment bankers in relation to securities or related derivatives. As a result of these actions, Scotiabank may receive remuneration. All Scotiabank products and services are subject to the terms of applicable agreements and local regulations. Officers, directors and employees of Scotiabank and its affiliates may serve as directors of corporations.
Any securities discussed in this report may not be suitable for all investors. Scotiabank recommends that investors independently evaluate any issuer and security discussed in this report, and consult with any advisors they deem necessary prior to making any investment.
This report and all information, opinions and conclusions contained in it are protected by copyright. This information may not be reproduced without the prior express written consent of Scotiabank.
™ Trademark of The Bank of Nova Scotia. Used under license, where applicable.
Scotiabank, together with “Global Banking and Markets”, is a marketing name for the global corporate and investment banking and capital markets businesses of The Bank of Nova Scotia and certain of its affiliates in the countries where they operate, including; Scotiabank Europe plc; Scotiabank (Ireland) Designated Activity Company; Scotiabank Inverlat S.A., Institución de Banca Múltiple, Grupo Financiero Scotiabank Inverlat, Scotia Inverlat Casa de Bolsa, S.A. de C.V., Grupo Financiero Scotiabank Inverlat, Scotia Inverlat Derivados S.A. de C.V. – all members of the Scotiabank group and authorized users of the Scotiabank mark. The Bank of Nova Scotia is incorporated in Canada with limited liability and is authorised and regulated by the Office of the Superintendent of Financial Institutions Canada. The Bank of Nova Scotia is authorized by the UK Prudential Regulation Authority and is subject to regulation by the UK Financial Conduct Authority and limited regulation by the UK Prudential Regulation Authority. Details about the extent of The Bank of Nova Scotia's regulation by the UK Prudential Regulation Authority are available from us on request. Scotiabank Europe plc is authorized by the UK Prudential Regulation Authority and regulated by the UK Financial Conduct Authority and the UK Prudential Regulation Authority.
Scotiabank Inverlat, S.A., Scotia Inverlat Casa de Bolsa, S.A. de C.V, Grupo Financiero Scotiabank Inverlat, and Scotia Inverlat Derivados, S.A. de C.V., are each authorized and regulated by the Mexican financial authorities.
Not all products and services are offered in all jurisdictions. Services described are available in jurisdictions where permitted by law.