- Inflation surprised well below nowcasts while remaining above target…
- ...prompting a massive risk-on rally across asset classes…
- ...that may be overdone…
- …if this just proves to be a third head fake this year
- PCE inflation and one more CPI report arrive before the Fed’s next decision
- The main drivers of everyone’s views on inflation in 2023
- US CPI, m/m % SA // y/y %, October:
- Actual: 0.4 / 7.7
- Scotia: 0.8 / 8.1
- Consensus: 0.6 / 7.9
- Prior: 0.4 / 8.2
- US core CPI, m/m % SA // y/y %, October:
- Actual: 0.3 / 6.3
- Scotia: 0.6 / 6.6
- Consensus: 0.5 / 6.5
- Prior: 0.6 / 6.6
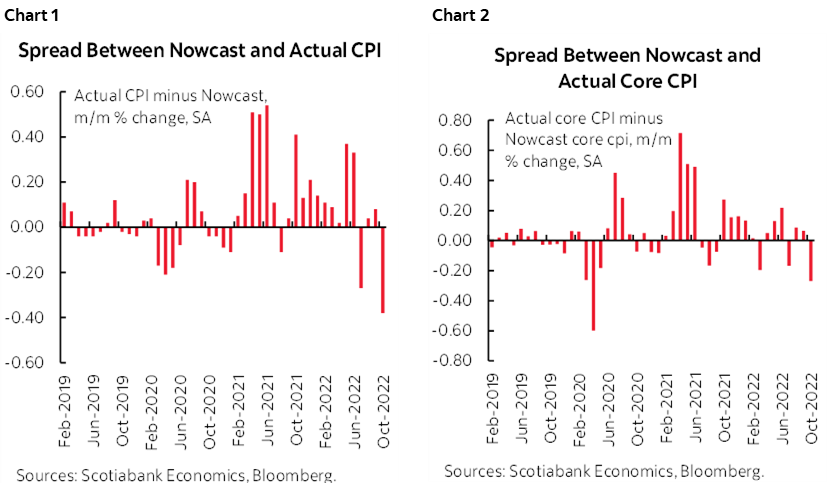
US CPI significantly undershot expectations and drove a massive rally in a rare undershoot of inflation nowcasts and everyone’s forecasts. The undershoot to the Cleveland Fed’s nowcast was the biggest since it became available (chart 1). The undershoot by core CPI compared to the same nowcast source was the biggest since the start of the pandemic (chart 2). My own tracking was also too high, so misery abounds this morning but with plenty of company apparently. The two-year yield dropped off a cliff and fell by 27bps with the 10-year yield declining by 22bps in the aftermath. The dollar depreciated by about 2.2% on a DXY basis. The S&P 500 shot higher by 4.4% compared to yesterday’s close. If that then we’ll see if the Fed allows easing financial conditions at this stage.
Furthermore, pricing for the Fed funds target rate reverted to +50bps on December 14th followed by halfway between 25 and 50 at the next meeting on February 1st and shifted pricing for the terminal rate down to between 4¾% and 5% by March. President Biden was sounding rather cocky when he said “Today’s report shows that we are making progress on bringing inflation down, without giving up all of the progress we have made on economic growth and job creation.”
TWO CAUTIONS
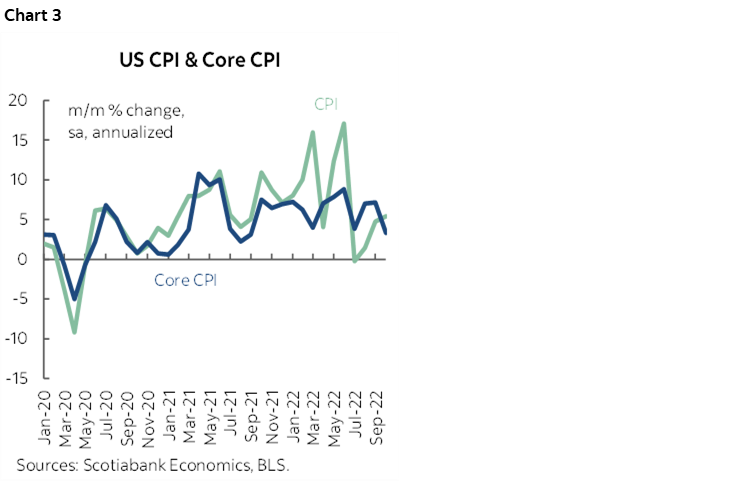
Chart 3 shows the volatility in month-over-month annualized inflation readings. Every down month this year like this one has been followed by a surge the next time. Woo hoo inflation’s ebbing, whoops it’s not, rinse, repeat. I’ll cover the drivers below after an important caution. I think the massive market reaction is a combination of a hope-driven rally and positioning squeeze much more than is sensible with the modest new evidence at hand. There are two reasons for this.
One is that we don’t know if the relatively soft core inflation reading is simply a third head fake this year and at risk of being a repeat of the prior two occasions that were surrounded by otherwise hot readings. Recall that the softer than expected 0.3% m/m core reading in July prompted a sucker’s rally and stridently premature declarations of victory over inflation before a pair of 0.6% prints followed. String a few together and then we’ll see.
Second is that we’ll get another CPI report on the eve of the next FOMC meeting on December 14th. Recall that FOMC participants submit their forecasts and ‘dots’ on the Friday before the start of the meeting on Tuesday but can change their forecasts and dots right up to the eve of the decision (ie: Tuesday night). There is probably going to be a high bar to risking abrupt changes to what they submit after the next batch of inflation readings, but it’s possible if CPI surprises in either direction again. I suspect the way we’re leaning now is toward 50bps in December pending further information and possibly higher terminal rate guidance in the dots based on Powell’s recent press conference.
DETAILS
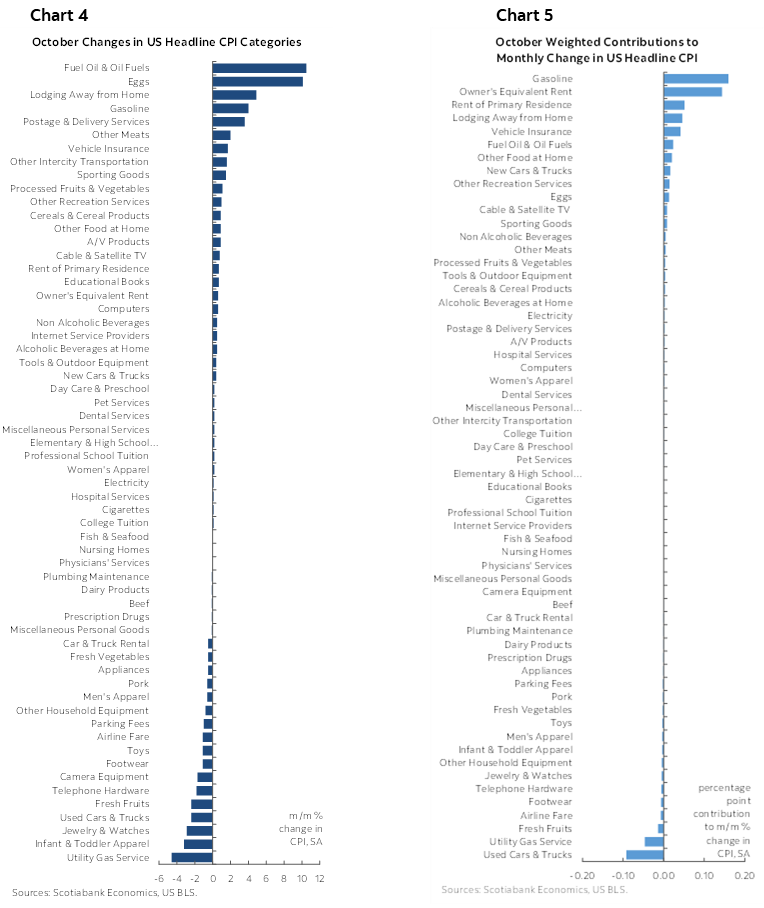
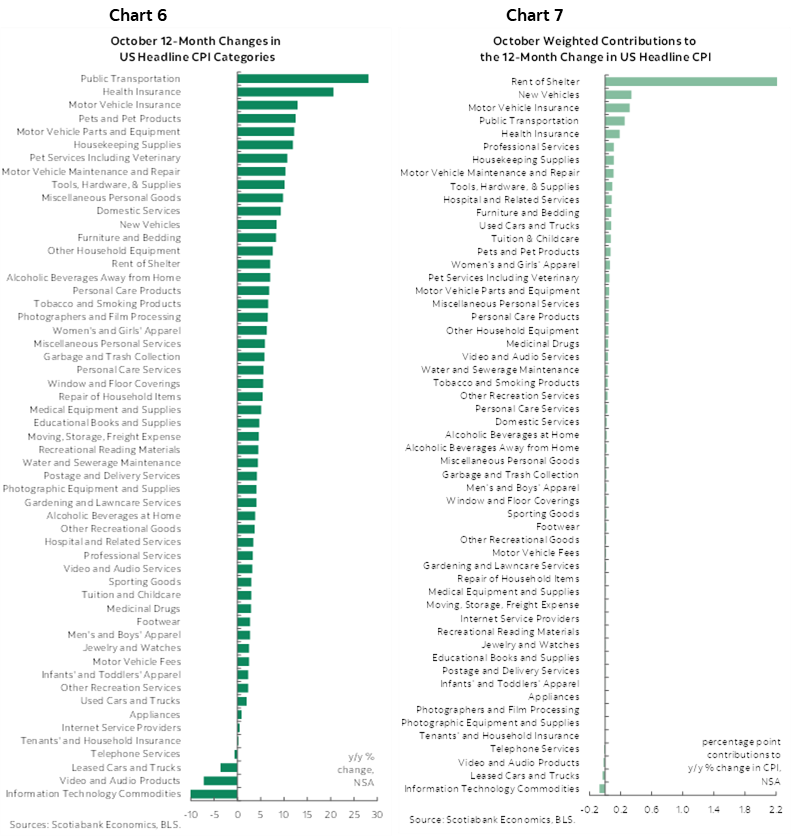
Charts 4 and 5 show the unweighted m/m price changes and the weighted contributions to the overall m/m change in CPI inflation respectively. Charts 6 and 7 do likewise for year-over-year measures.
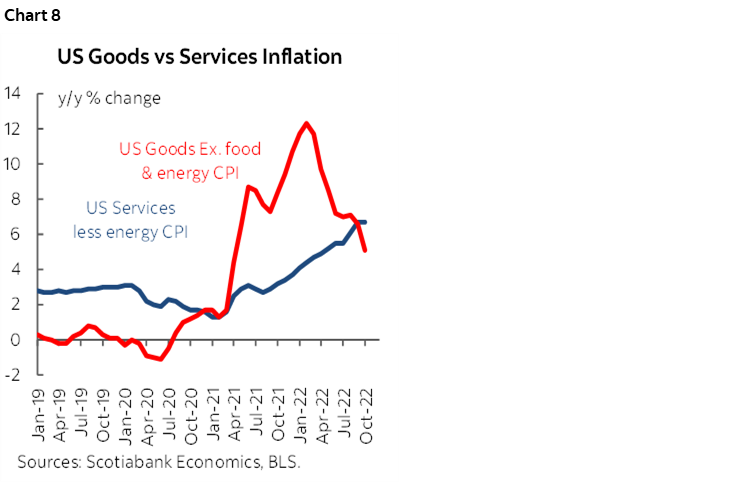
So what drove the undershoot? See the next page’s collection of charts. Both core goods inflation (ex-food and energy) and core services inflation (ex energy services) decelerated. It’s pretty rare so far during the pandemic to see both effects moving in similar directions (chart 8).
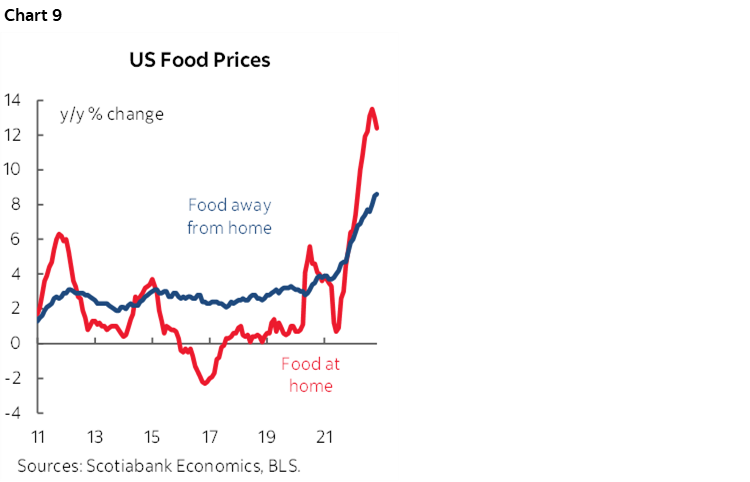
Food inflation ebbed a bit by landing at 0.6% m/m and while still hot, the deceleration was driven by groceries (0.4% m/m) as food away from home including take-out was up by a still hot 0.9%. Year-over-year food inflation may be cresting at least for groceries (chart 9).
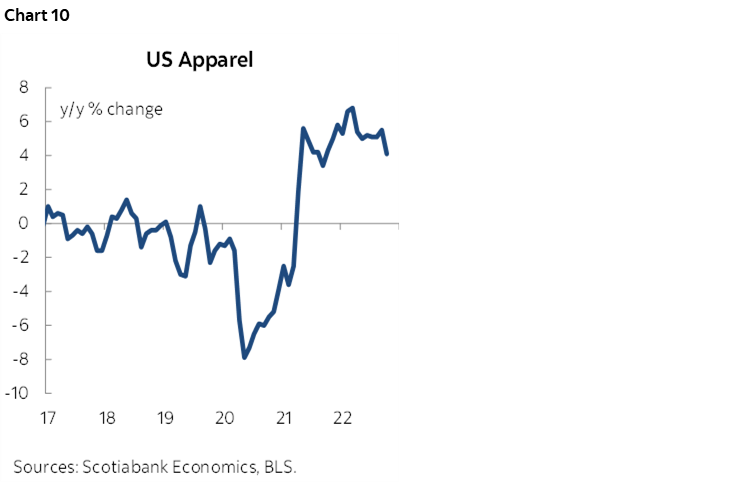
Apparel prices fell 0.7% m/m mostly due to men’s clothing and footwear. Perhaps milder than usual weather in the northern states contributed to this and we’ll have to see the holiday shopping effect into the next couple of reports. Chart 10 shows the plateauing apparel price inflation.
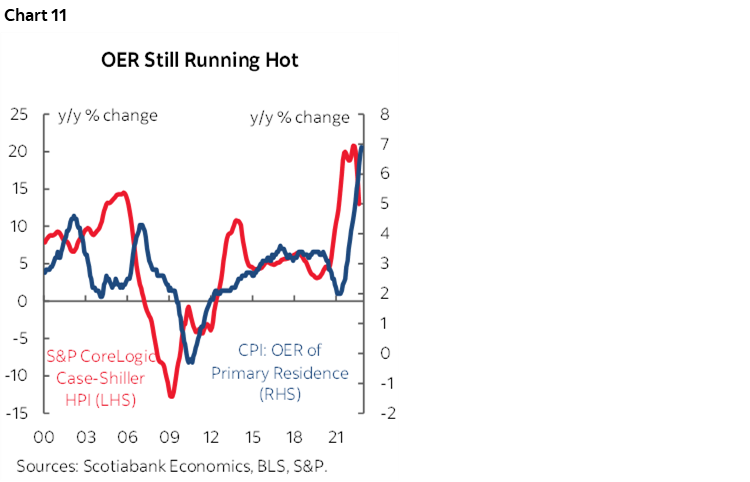
Owners equivalent rent (chart 11) was up by 0.6% m/m which was 0.1–0.2 points softer than prior months while still hot.
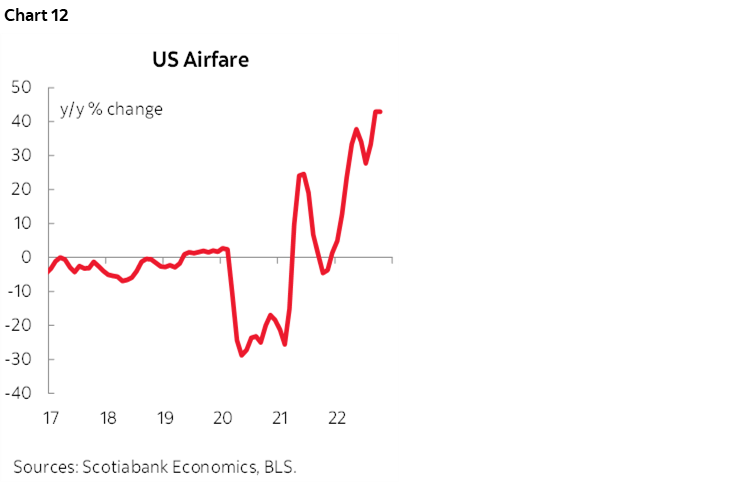
Pandemic related categories were mixed. Airfare fell 1.1% but at a puny 0.6% weight which had it contributing nothing, although its year-over-year climb is not yet abating (chart 12). Car rental prices fell 0.5% m/m, but lodging prices were up by a large 4.9% m/m.
Rent was also solid at 0.7% m/m.
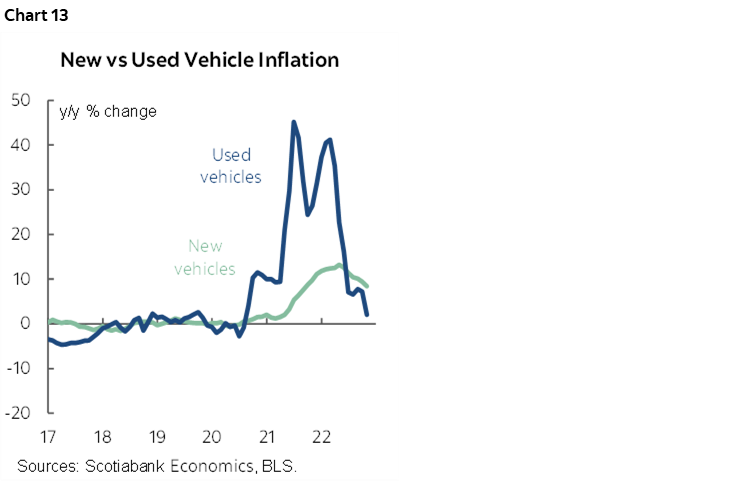
New and used vehicle prices were up 0.4% m/m and down 2.4% m/m respectively, but their modest weights of around 4% each resulted in little net contribution to the overall change in CPI. Both are ebbing influences in year-over-year terms (chart 13).
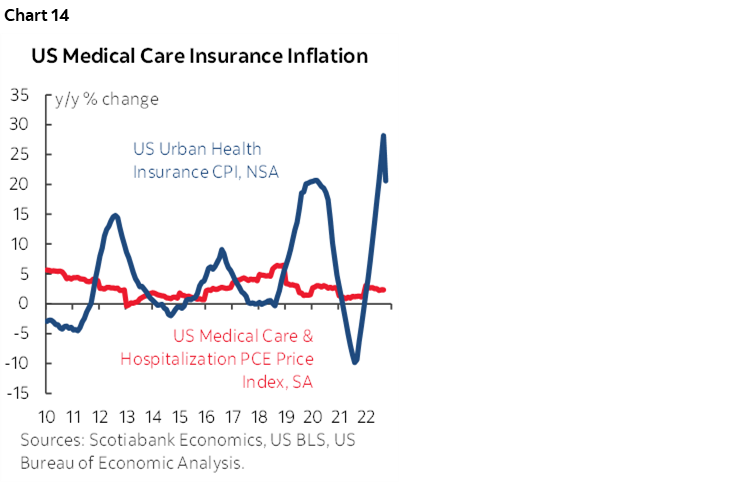
Medical insurance premiums also softened (chart 14).
THE MAIN DRIVER OF THE CONSENSUS 2023 INFLATION FORECAST
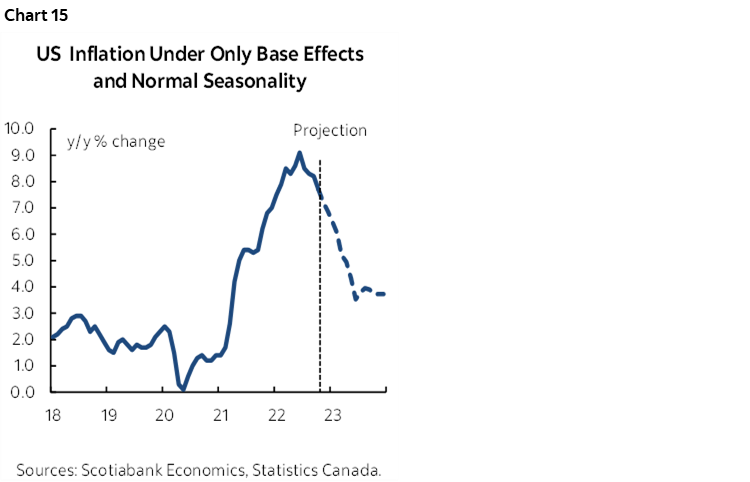
Everyone is forecasting cooler inflation into next year with consensus forecast CPI to end 2023 at 3% and Scotia Economics at 3.5%. Almost all shops within Bloomberg’s consensus foresee inflation ending next year at between 2½% y/y and 4% y/y. Multiple forecast methods are used by various shops, but most of this consensus view can be derived through the simplest of all approaches.
Letting just base effects and average monthly CPI seasonality work through the next year’s numbers would alone have CPI inflation ending 2023 at about 3¾% y/y which would be just under half of the present rate (chart 15). In reality, the key will be the reasonableness of assuming simple mean reversion toward normal seasonality in prices changes month to month in the context of the humbling nature of forecasting inflation over time. We’ll see if that kind of guesswork—if it proves correct—would be enough to motivate Fed policy easing.
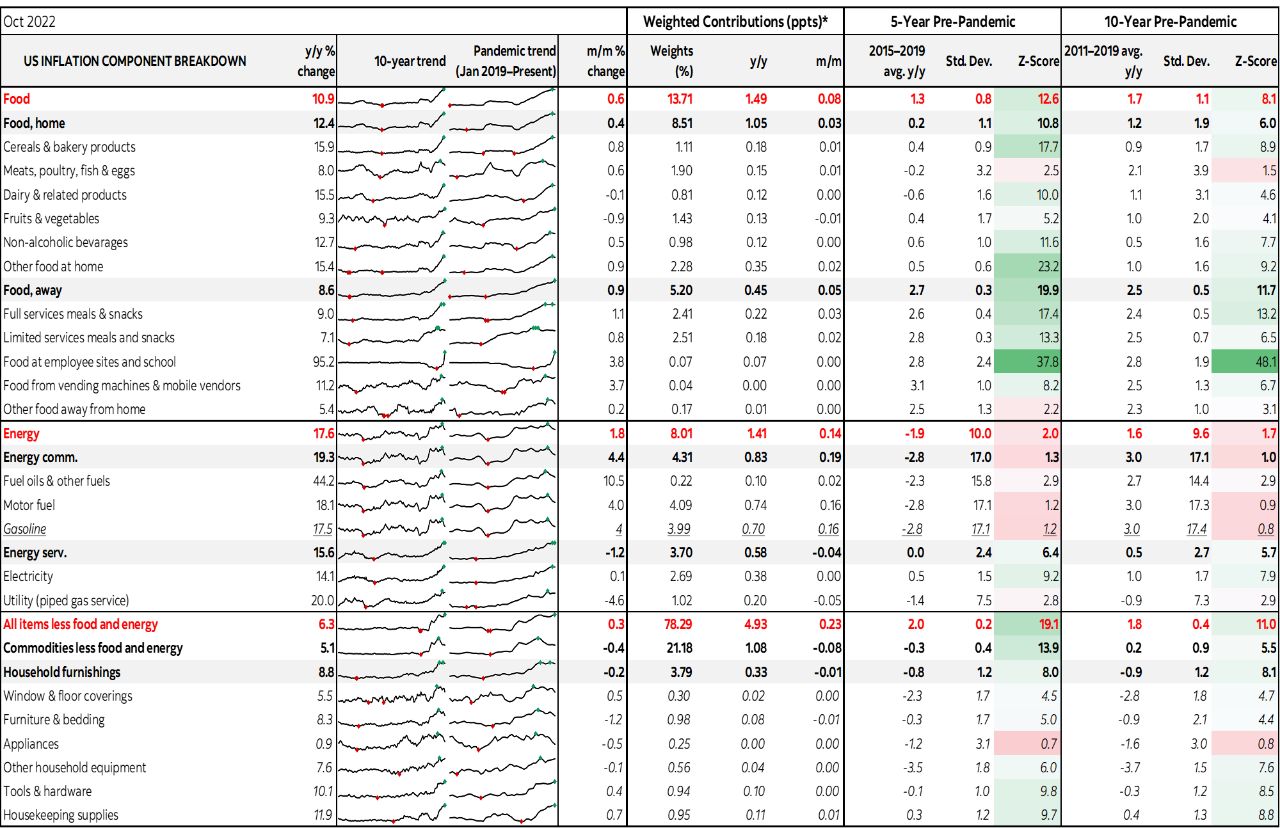
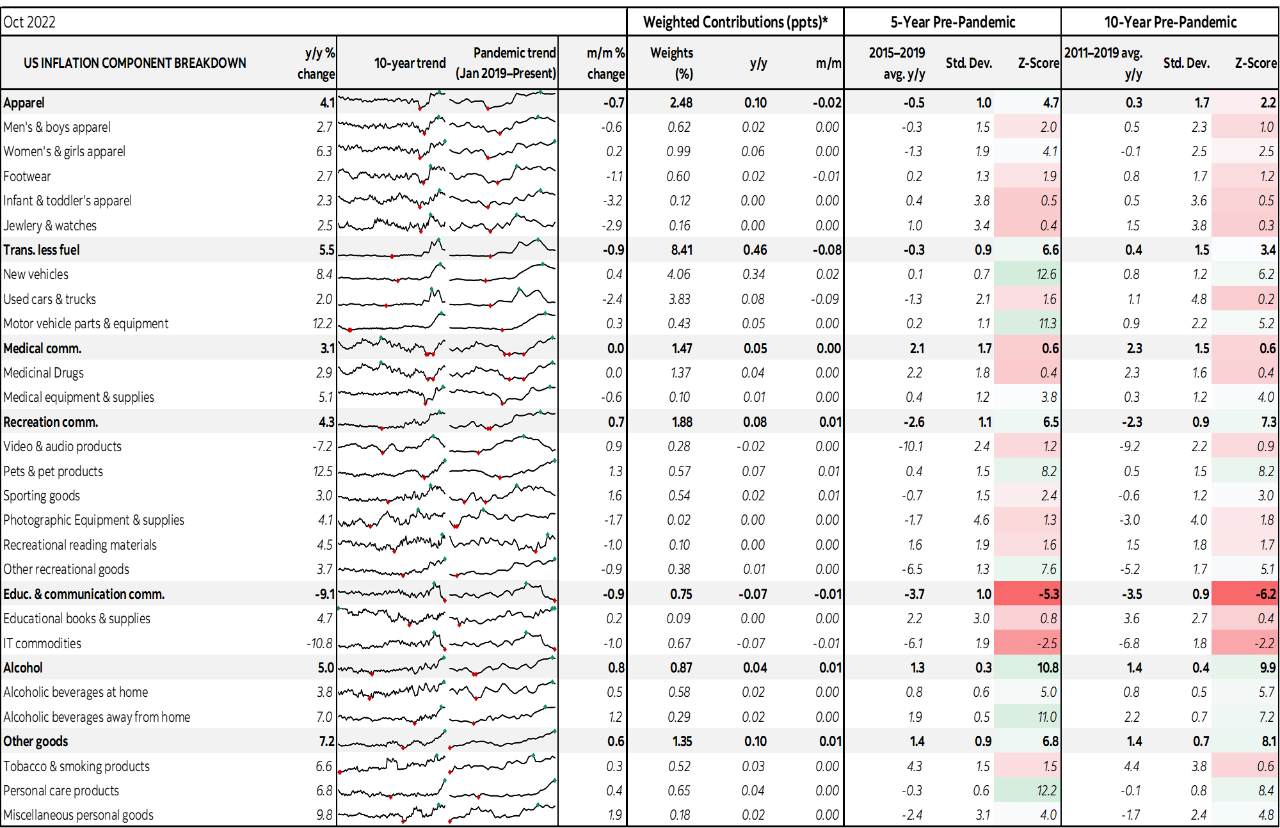
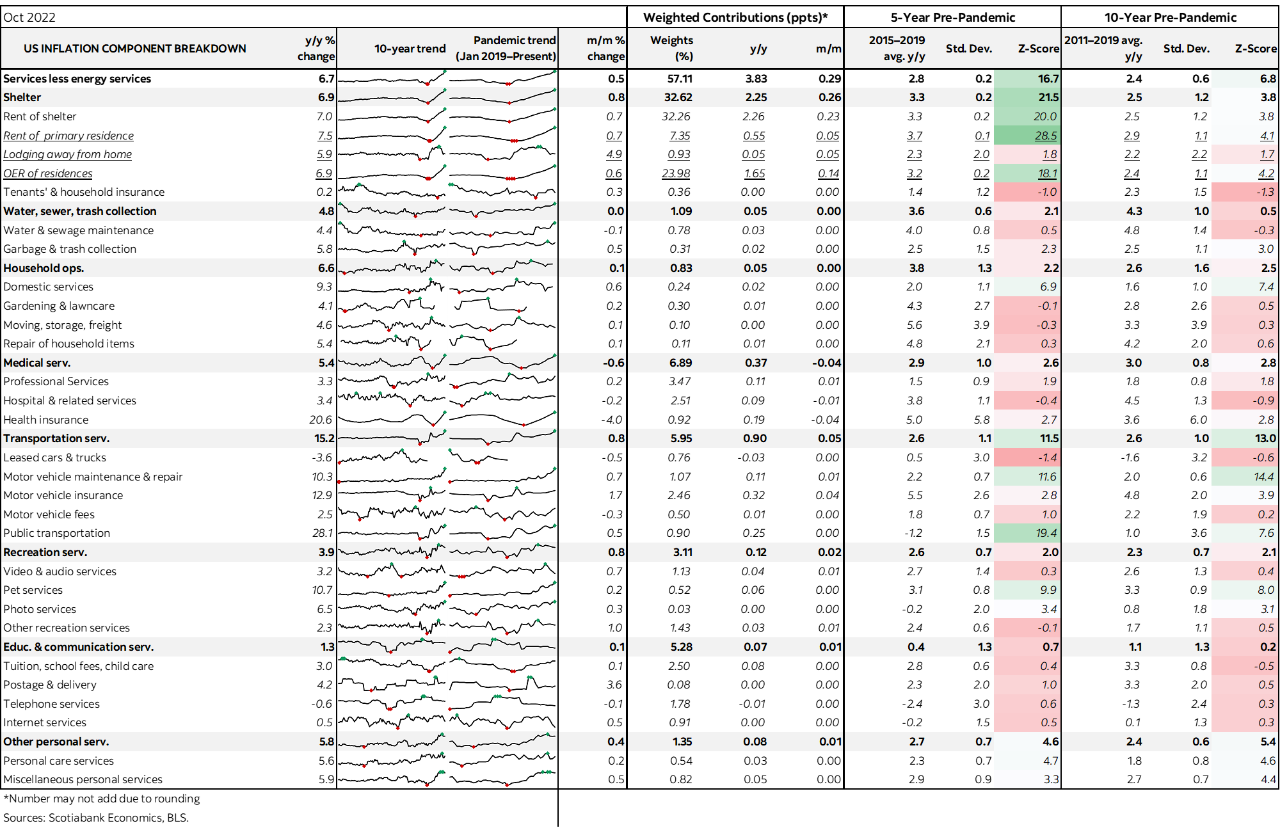
Please see the accompanying table at the back that includes further details with micro charts and z-score measures of deviations from norms.
DISCLAIMER
This report has been prepared by Scotiabank Economics as a resource for the clients of Scotiabank. Opinions, estimates and projections contained herein are our own as of the date hereof and are subject to change without notice. The information and opinions contained herein have been compiled or arrived at from sources believed reliable but no representation or warranty, express or implied, is made as to their accuracy or completeness. Neither Scotiabank nor any of its officers, directors, partners, employees or affiliates accepts any liability whatsoever for any direct or consequential loss arising from any use of this report or its contents.
These reports are provided to you for informational purposes only. This report is not, and is not constructed as, an offer to sell or solicitation of any offer to buy any financial instrument, nor shall this report be construed as an opinion as to whether you should enter into any swap or trading strategy involving a swap or any other transaction. The information contained in this report is not intended to be, and does not constitute, a recommendation of a swap or trading strategy involving a swap within the meaning of U.S. Commodity Futures Trading Commission Regulation 23.434 and Appendix A thereto. This material is not intended to be individually tailored to your needs or characteristics and should not be viewed as a “call to action” or suggestion that you enter into a swap or trading strategy involving a swap or any other transaction. Scotiabank may engage in transactions in a manner inconsistent with the views discussed this report and may have positions, or be in the process of acquiring or disposing of positions, referred to in this report.
Scotiabank, its affiliates and any of their respective officers, directors and employees may from time to time take positions in currencies, act as managers, co-managers or underwriters of a public offering or act as principals or agents, deal in, own or act as market makers or advisors, brokers or commercial and/or investment bankers in relation to securities or related derivatives. As a result of these actions, Scotiabank may receive remuneration. All Scotiabank products and services are subject to the terms of applicable agreements and local regulations. Officers, directors and employees of Scotiabank and its affiliates may serve as directors of corporations.
Any securities discussed in this report may not be suitable for all investors. Scotiabank recommends that investors independently evaluate any issuer and security discussed in this report, and consult with any advisors they deem necessary prior to making any investment.
This report and all information, opinions and conclusions contained in it are protected by copyright. This information may not be reproduced without the prior express written consent of Scotiabank.
™ Trademark of The Bank of Nova Scotia. Used under license, where applicable.
Scotiabank, together with “Global Banking and Markets”, is a marketing name for the global corporate and investment banking and capital markets businesses of The Bank of Nova Scotia and certain of its affiliates in the countries where they operate, including; Scotiabank Europe plc; Scotiabank (Ireland) Designated Activity Company; Scotiabank Inverlat S.A., Institución de Banca Múltiple, Grupo Financiero Scotiabank Inverlat, Scotia Inverlat Casa de Bolsa, S.A. de C.V., Grupo Financiero Scotiabank Inverlat, Scotia Inverlat Derivados S.A. de C.V. – all members of the Scotiabank group and authorized users of the Scotiabank mark. The Bank of Nova Scotia is incorporated in Canada with limited liability and is authorised and regulated by the Office of the Superintendent of Financial Institutions Canada. The Bank of Nova Scotia is authorized by the UK Prudential Regulation Authority and is subject to regulation by the UK Financial Conduct Authority and limited regulation by the UK Prudential Regulation Authority. Details about the extent of The Bank of Nova Scotia's regulation by the UK Prudential Regulation Authority are available from us on request. Scotiabank Europe plc is authorized by the UK Prudential Regulation Authority and regulated by the UK Financial Conduct Authority and the UK Prudential Regulation Authority.
Scotiabank Inverlat, S.A., Scotia Inverlat Casa de Bolsa, S.A. de C.V, Grupo Financiero Scotiabank Inverlat, and Scotia Inverlat Derivados, S.A. de C.V., are each authorized and regulated by the Mexican financial authorities.
Not all products and services are offered in all jurisdictions. Services described are available in jurisdictions where permitted by law.