- Canadian inflation surpassed consensus expectations again
- There are no clear signs of slowing pressures
- Inflation and growth are exceeding BoC forecasts…
- ...as an aggressive rate path lies ahead
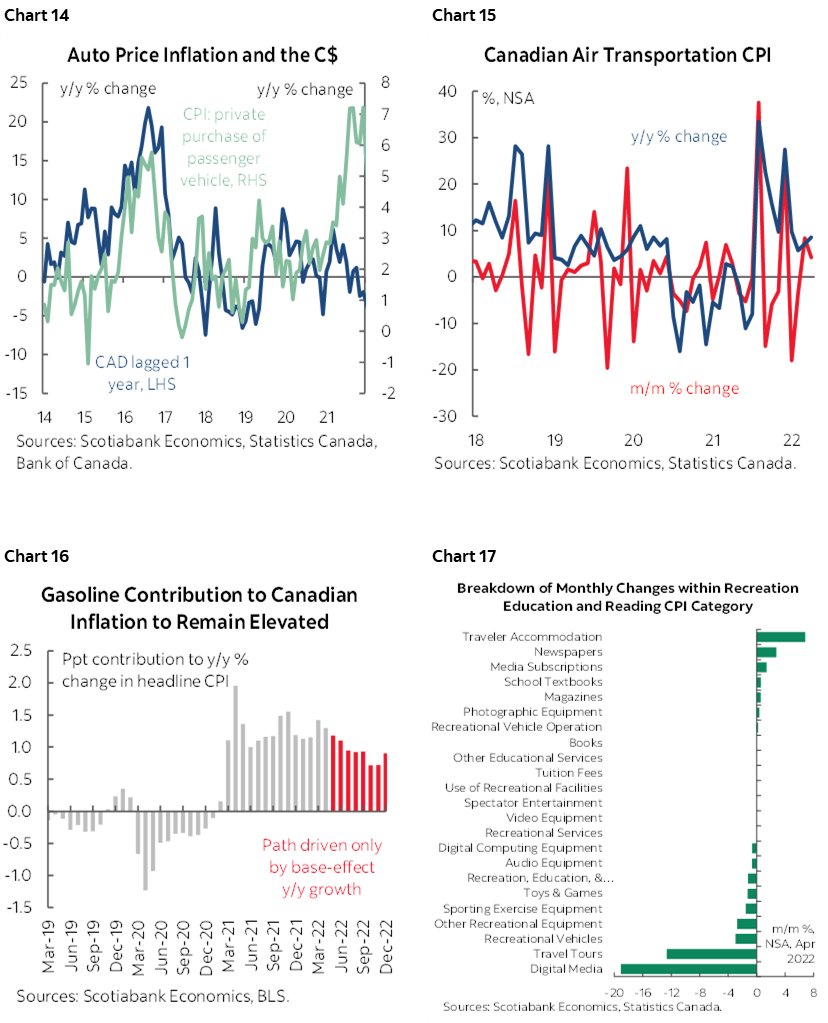
- Statcan’s way of incorporating used vehicle prices…
- ...will mean Canada won’t see the downdraft the US probably will
- Bank of Canada implications
Canadian CPI, m/m / y/y %, April:
Actual: 0.6 / 6.8
Scotia: 0.7 / 6.9
Consensus: 0.5 / 6.7
Prior: 1.4 / 6.7
Canadian core CPI, y/y % change, April:
Average: 4.2 (prior 3.9% revised up from 3.8%)
Weighted median: 4.4 (prior 4.0% revised up from 3.8%)
Common component: 3.2 (prior 3% revised up from 2.8%)
Trimmed mean: 5.1 (prior 4.8% revised up from 4.7%)
Inflation remains on an upward tear in Canada no matter how one slices it (see tables above). In month-ago terms, this was the fourth consecutive upward surprise to consensus expectations. Furthermore, I just don’t see any clear signs that inflation is decelerating. While inflation landed above consensus broadly in keeping with my estimates, I think the more important considerations lie in the details. I’ll return to what I think are meaningful BoC implications and address Statcan’s plans to include used vehicle prices in the next CPI report and what if anything that means to future inflation and the BoC.
The Canadian dollar initially appreciated but quickly shook off the results relative to the return of US dollar strength. Canada’s shorter-term yields are underperforming the US. Both countries saw their 2 year yields rally after the Canadian data but the US rally has been stronger. OIS markets added a few basis points to the pricing for a June 1st hike that now stands a little over half a percentage point and hence includes a fraction of an extra quarter point.
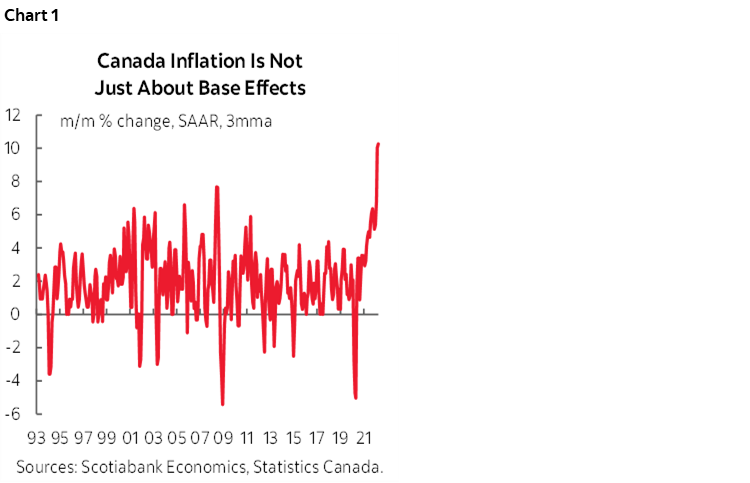
On a month-over-month seasonally adjusted and annualized basis inflation in April stood at 8.4%. That’s cooler than 12.4% the prior month when everything hit the inflation fan globally. It shouldn’t really be taken to mean that inflation eased since the April reading was still very hot and March was the most ridiculously month ever. On a smoothed 3 month moving average basis that reduces some of the monthly volatility to look at a trend we’re getting the hottest readings ever (chart 1).
Key are the multiple core measures and there are several points worth illustrating here.
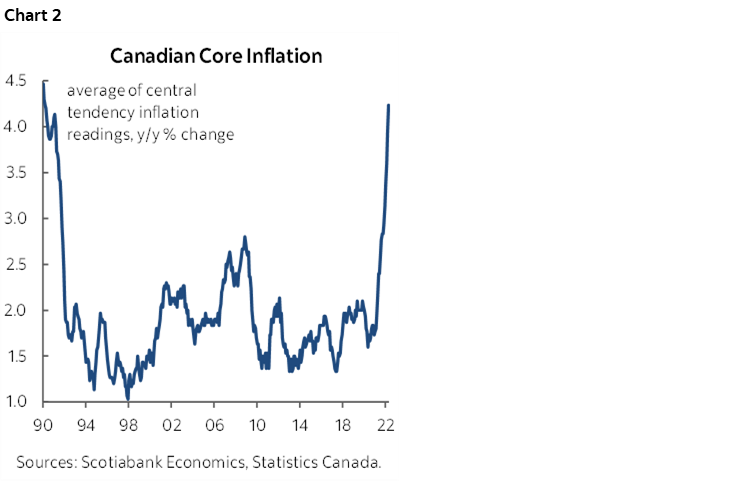
1. The average of the BoC’s three central tendency measures accelerated to 4.2% y/y and was revised up a tick to 3.9% the prior month. The last time we saw such a hot reading was way back in April 1990 which makes this a thirty-two year record high reading and takes us back to just before the BoC adopted inflation targeting (chart 2).
2. Alternative core measures were also very hot. A first approach is to look at y/y readings with CPI ex-food and energy holding steady at 4.62% y/y (4.65% prior) but see below for the strong caution on this point. CPIX picked up to 5.7% y/y from 5.5%.
3. Month-over-month core inflation pressures are hot, hot, hot. CPI ex-food and energy was up 6.2% m/m at a seasonally adjusted and annualized rate (SAAR) and while that’s cooler than 9% the prior month, it’s the hottest reading since last April. We can’t say this measure is cooling with much confidence just because it was softer than March’s massive global impulses. The amazing thing is that on the back of such March gains we saw such powerful increases extending into April. On a three-month moving average basis that tamps down some of this volatility, CPI ex-f&e was up 6.9% which is the hottest on record.
4. This prior point is backed up by other core measures. CPI ex-8 was up 10.5% m/m SAAR in April which is cooler than the prior month’s 12.4% but the only other double-digit reading since at least the early 1990s. A similar observation holds for CPIX.
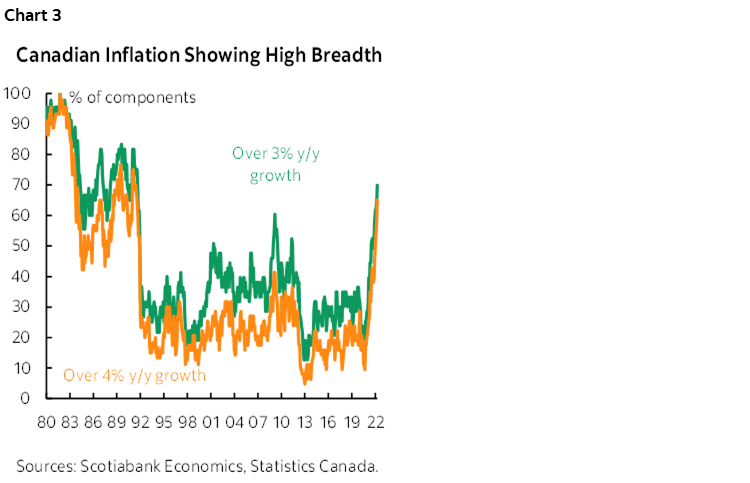
Inflation’s breadth remains extraordinarily high (chart 3). About 78% of the CPI basket is rising by more than the 2% inflation target, 70% of the basket is up by over 3% and 65% is up by more than 4%.
BANK OF CANADA IMPLICATIONS
Inflation is tracking considerably hotter than the Bank of Canada anticipated when it issued its Monetary Policy Report a little over a month ago on April 13th. Back then the BoC forecast Q1 headline inflation at 5.6% y/y and Q2 at 5.8%. Q1 landed at 5.8% y/y and Q2 is so far tracking 6.8% based solely upon April’s reading. In order for Q2 CPI to come in line with the BoC’s forecast—and assuming no revisions—prices would have to fully stall out with slight downward pressure on the indices in month-over-month terms during May and June which seems unlikely with what we know so far.
Growth is also tracking above BoC expectations. The BoC had forecast 3% growth in Q1 and it’s looking more like around 5%.
With both growth and inflation tracking above forecasts when the ink is barely dry it may drive a further sense of concern at the Bank of Canada toward expediting rate hikes. Governor Macklem has said 50bps will be considered at the June 1st meeting which is our forecast. He has also said he wishes to return to neutral fairly quickly. We have three 50bps hikes in June, July and September followed by quarter-point hikes in the final two meetings of the year. That would take the overnight rate to 3% in what is either the top end of the 2–3% neutral rate range as estimated by the BoC, or a mild overshoot of the mid-point of that range.
If I were them I would not be as confident in ruling out the need for a bigger move in June. The BoC’s policy rate should be at neutral—and beyond—under current circumstances, let alone months or quarters from now. The economy is in excess aggregate demand with inflation more than tripling the target, jobs nearly a half million higher than pre-pandemic levels with strong hiring intentions, fiscal policy continues to heap on stimulus by contrast to the US, Canada is importing a positive income shock through its terms of trade and the commodities boost. Every central bank is dealing with private debt and housing issues that I think will be manageable in Canada, but what other peer central bank in the world faces such fortuitous circumstances? If the BoC can’t be at neutral now—and beyond—then it’s a strong litmus test for whether other global central banks will be able to do so.
PLANNED INCLUSION of USED VEHICLES AND IMPLICATIONS
My my. Used vehicle prices have been ripping in the US and Canada across multiple benchmarks. Yet StatCan’s methodology (here) managed to tamp it all down to say that used vehicle prices would have only have contributed a weighted 0.2% y/y addition to headline inflation in March if they had done the right thing and included used vehicle prices ages ago like the US and UK. That’s by contrast to the one percentage point contribution of used vehicles to US CPI inflation using JD Power. If the effect on April is similar, then true Canadian inflation is bang on 7% y/y instead of this morning’s 6.8% y/y.
Why such a low contribution?
- They are using a price benchmark that is drawn from several choices that are all over the map. JD Power supplied the price database to Statcan and their measure was up 24.5% y/y in March. Other measures like Blackbook prices were up 39% y/y in March. Adesa’s used vehicle price index at wholesale auctions was down 13% y/y last month. Note that the dispersion of used vehicle price increases in Canada in year-over-year terms is nowhere nearly as wide in the US as it seems to be in Canada where what’s happening to prices seems to be anyone’s best guess. For example, the US Manheim auction measure stands at +14% y/y, US Blackbook was up 32.9% y/y in March and 21.7% y/y in April. That’s fine, the BLS also uses JD Power data for US CPI, but note that whatever measure of prices is used creates very high uncertainty toward how to incorporate used vehicles and whether this is being done accurately.
- Secondly, whereas the US BLS takes a higher quality younger sample of used vehicles aged 2–7 years to include in CPI, Statcan appears to have included the whole universe of used vehicles. I’m unsure of why Statcan and the BLS diverge on this issue. That could skew the reading lower by relatively weighting older vehicles higher in Canada than in the US on the assumption there aren’t that many used vehicles under 2 years as a share of the overall used market in either country relative to older ones. That might be a particularly powerful effect in Canada given Statcan noted the difference in sample composition of Canadian used vehicles compared to the US that contributes to different preferences for types of vehicles.
- Statcan stuck to its 1.8% basket weight for used vehicles which is well below the US weight at 4.1%. Basket weights will be updated next month.
- Further, hedonic quality adjustments to the whole sample of used vehicle prices removed some of the raw price inflation. There will always be uncertainty around quality adjusting used vehicle prices with equations but short of anything else we’ll have to go with how Statcan did it.
It’s also the case that used vehicle prices are probably peaking and so Statcan is going to be catching the downward path in CPI.
Still, Statcan will never backwardly revise CPI to include used vehicles and will start tracking them from May onward in the June report in an approach similar to what it did when it introduced other items in the past. That’s rather rigid and basically says the product didn’t exist before Statcan finally got around to best practices elsewhere.
What does it all mean to inflation going forward and the Bank of Canada? If used vehicles contributed a minimal amount to headline CPI on the upswing, then by corollary starting to include them when the year-over-year rates of price increases might be on the downswing could have very little effect on headline CPI. By extension, this should have little effect on the Bank of Canada’s policy stance going forward especially in terms of its multiple core measures that on balance are designed to look at central tendency measures anyway.
This last point could be particularly true for the BoC relative to the Federal Reserve. The bigger contributions to US inflation from used vehicles to date are likely to be a bigger drag on US CPI and PCE going forward than in Canada. That could mean that this one component could keep Canadian inflation more persistent than in the US going forward.
OTHER DETAILS
Chart 4 shows the range of all core inflation measures in y/y terms.
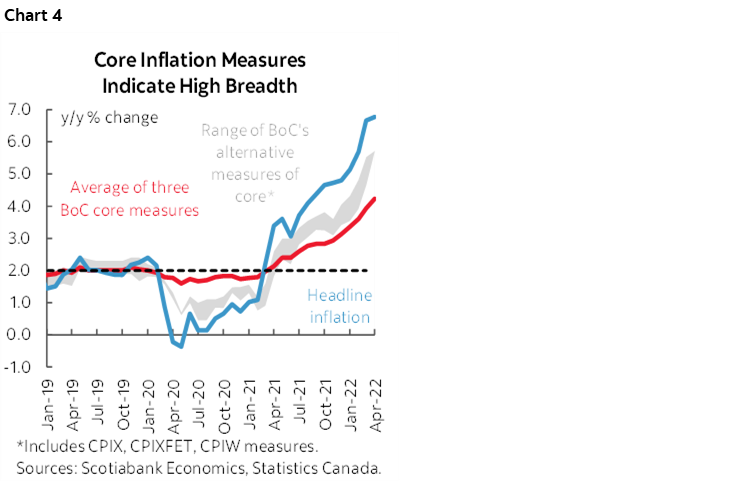
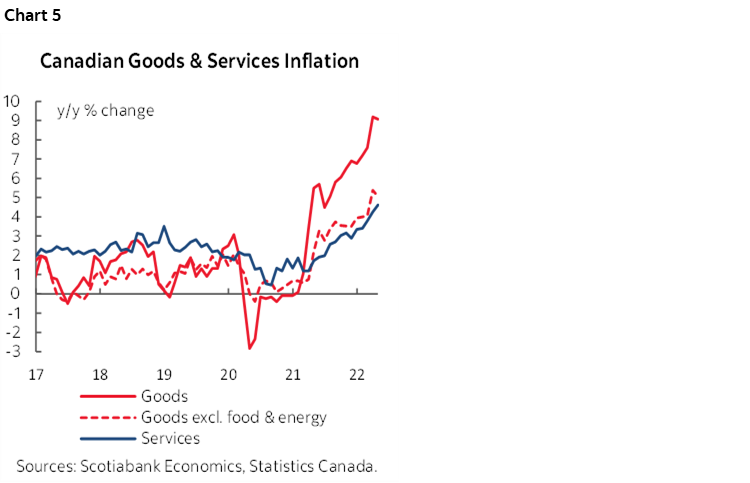
Chart 5 shows goods versus services inflation.
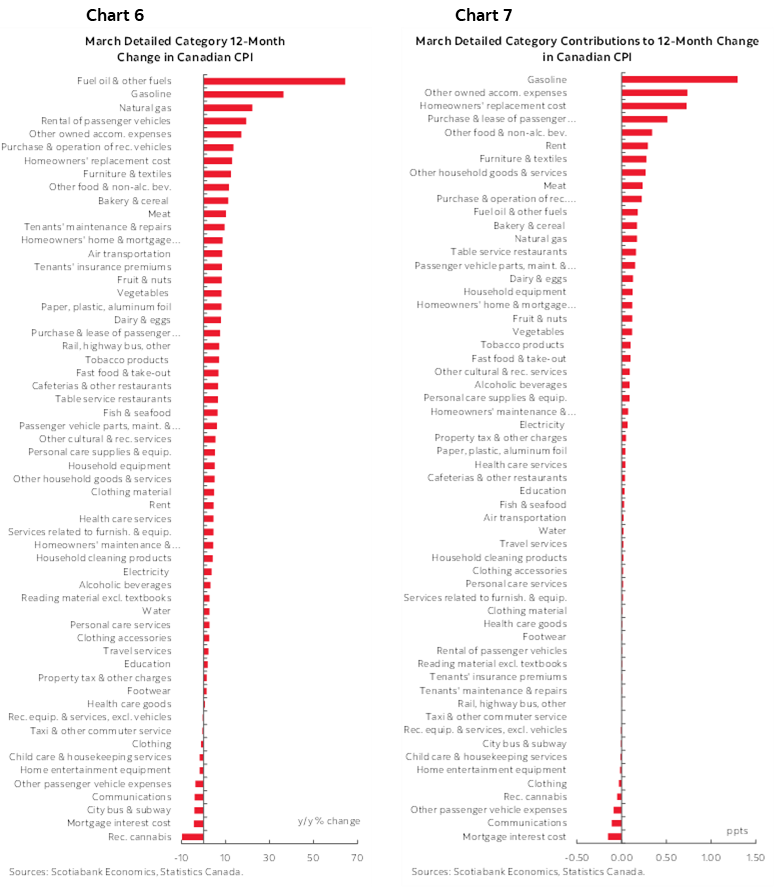
Charts 6 and 7 on the next page break down the basket in year-over-year terms first in unweighted terms and then in terms of weighted contributions to the rise in CPI.
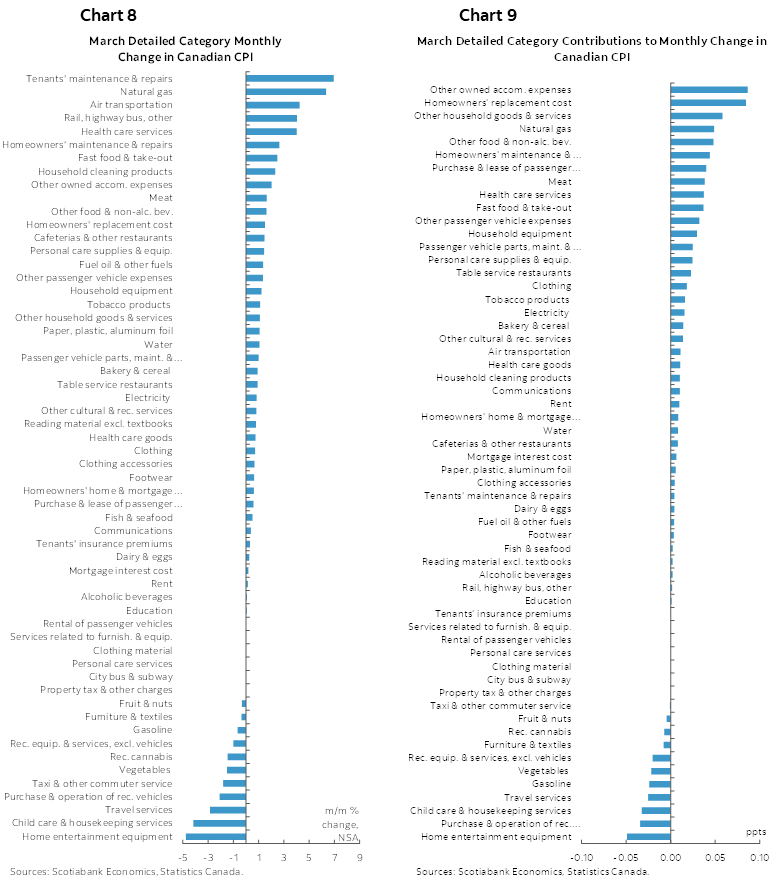
Charts 8 and 9 do likewise in month-over-month terms.
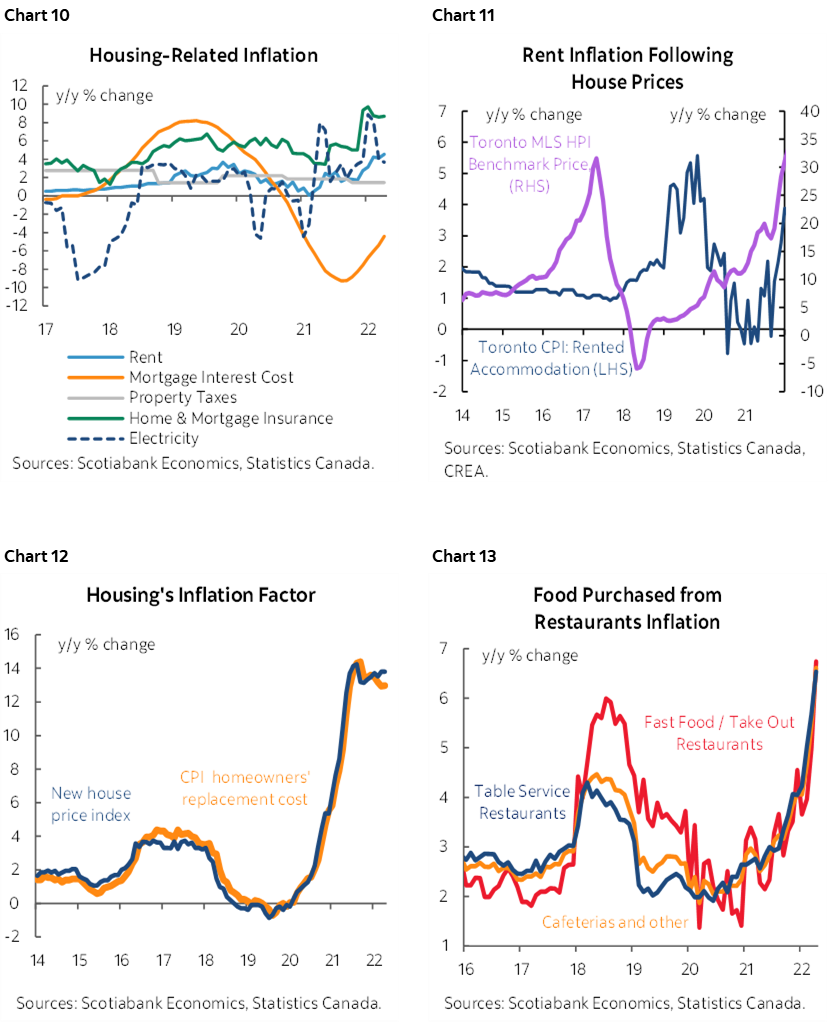
Charts 10–17 break down some of the details further in terms of the roles of housing, vehicles, food and select other categories.
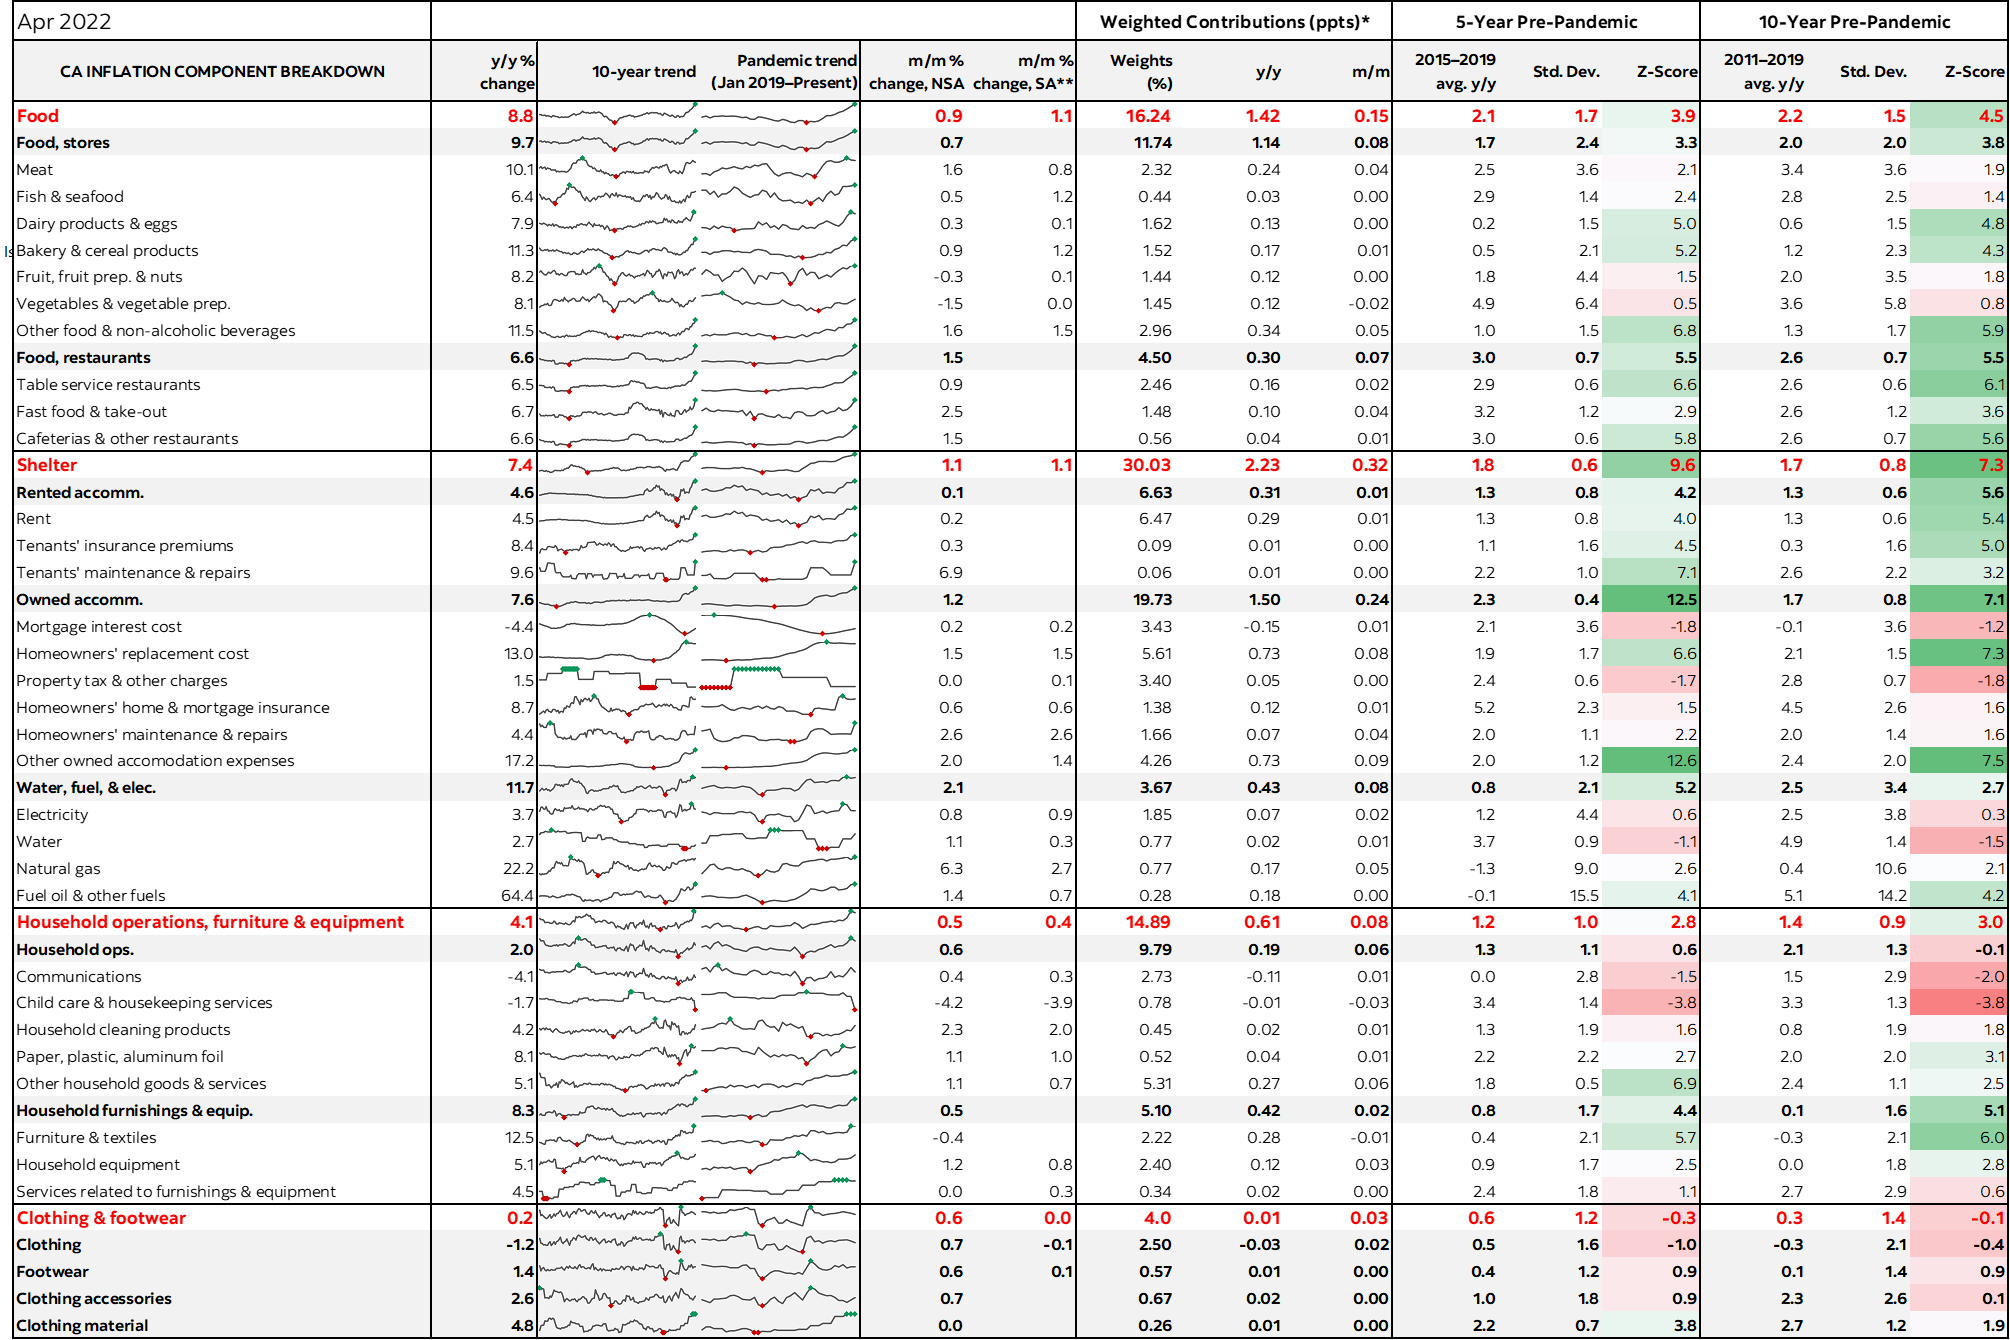
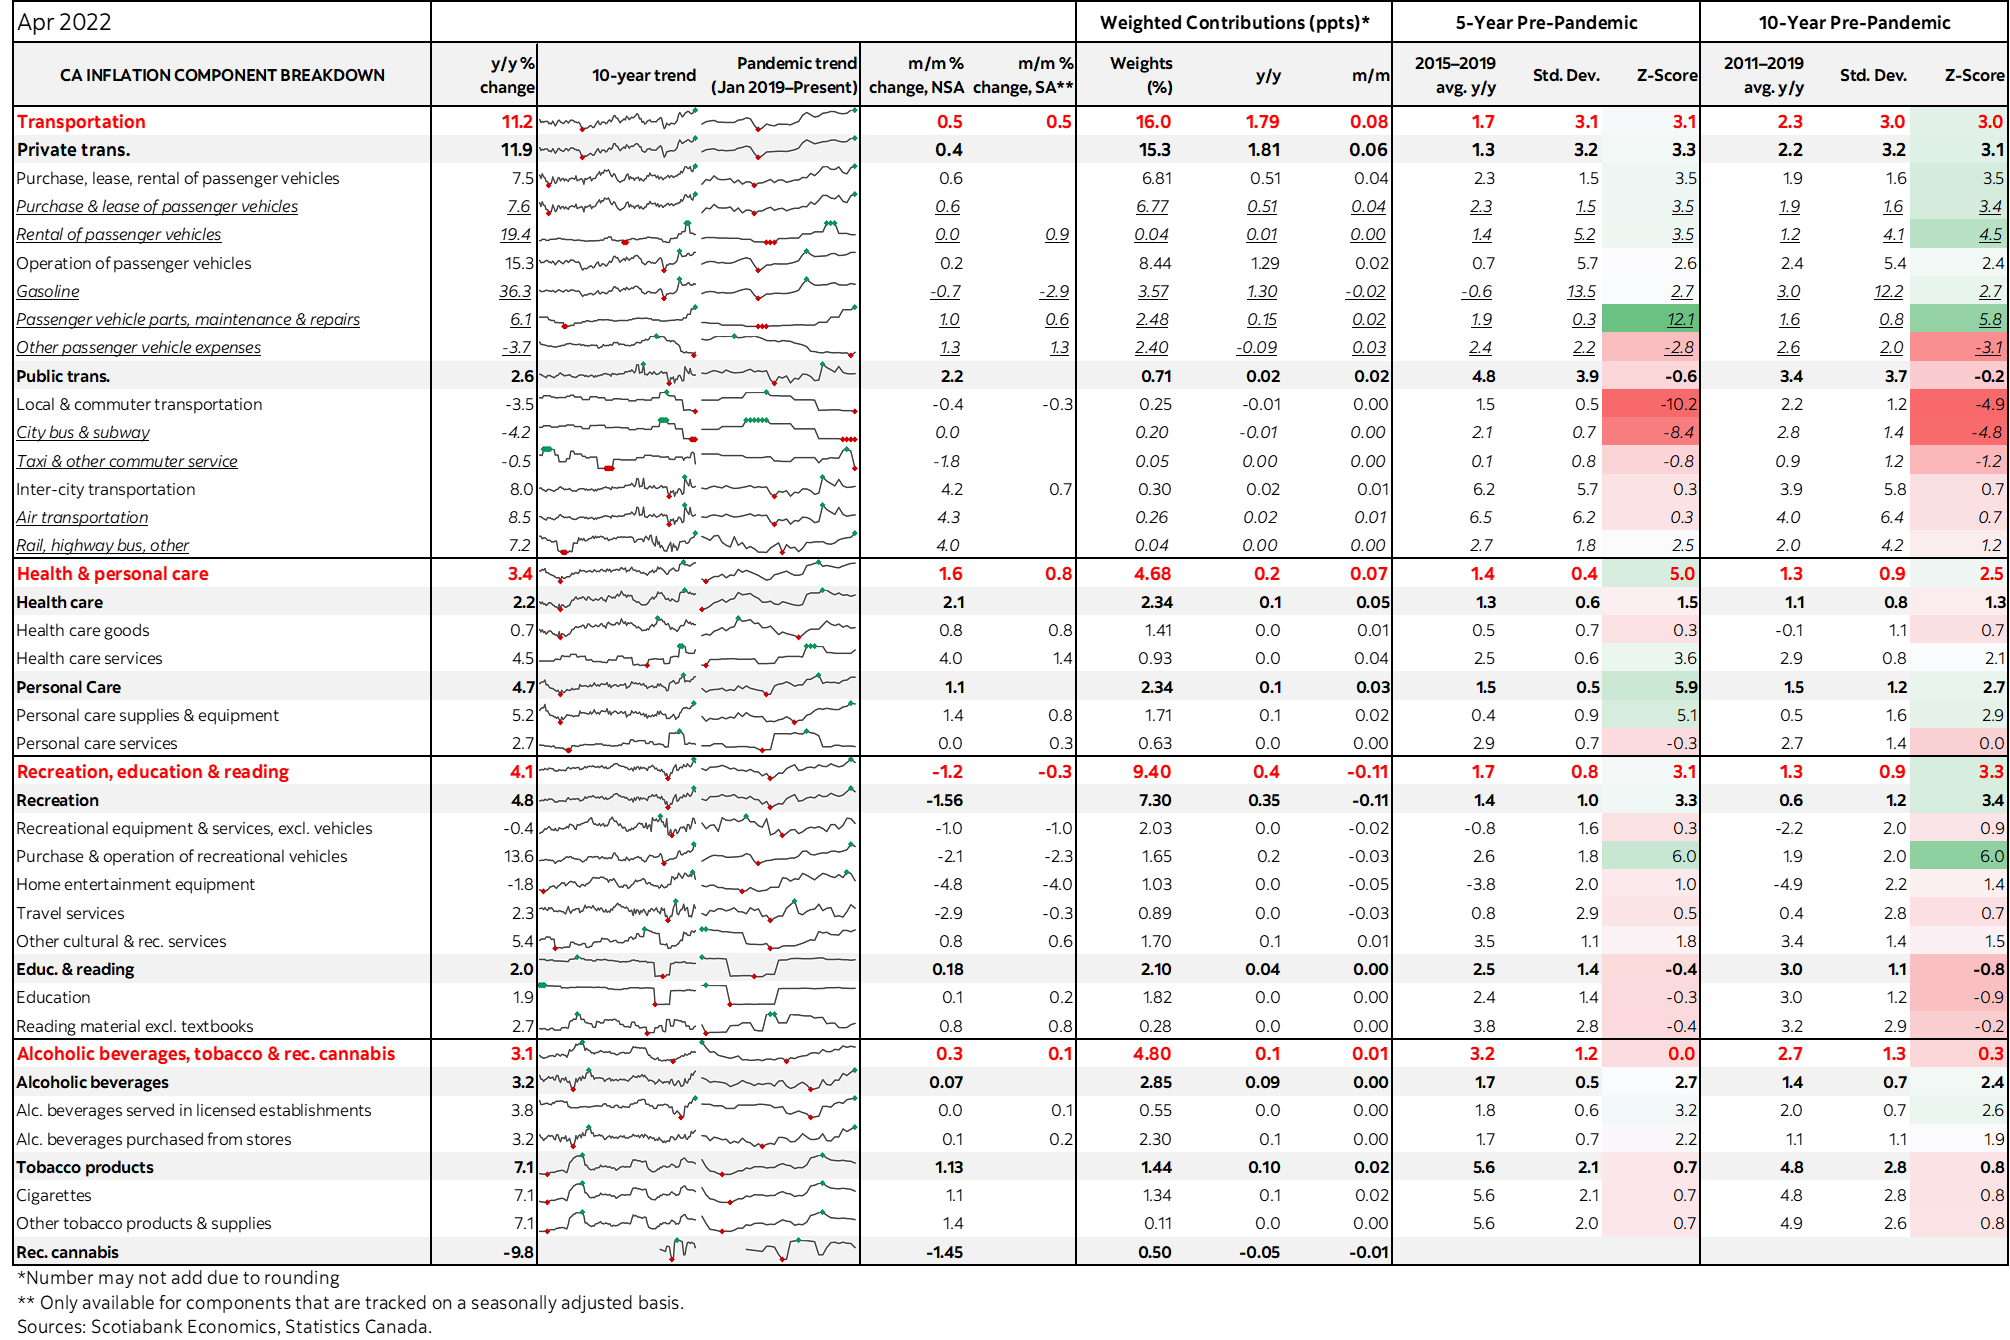
The accompanying table at the back offers richer details on the overall basket including micro-charts for each component.
DISCLAIMER
This report has been prepared by Scotiabank Economics as a resource for the clients of Scotiabank. Opinions, estimates and projections contained herein are our own as of the date hereof and are subject to change without notice. The information and opinions contained herein have been compiled or arrived at from sources believed reliable but no representation or warranty, express or implied, is made as to their accuracy or completeness. Neither Scotiabank nor any of its officers, directors, partners, employees or affiliates accepts any liability whatsoever for any direct or consequential loss arising from any use of this report or its contents.
These reports are provided to you for informational purposes only. This report is not, and is not constructed as, an offer to sell or solicitation of any offer to buy any financial instrument, nor shall this report be construed as an opinion as to whether you should enter into any swap or trading strategy involving a swap or any other transaction. The information contained in this report is not intended to be, and does not constitute, a recommendation of a swap or trading strategy involving a swap within the meaning of U.S. Commodity Futures Trading Commission Regulation 23.434 and Appendix A thereto. This material is not intended to be individually tailored to your needs or characteristics and should not be viewed as a “call to action” or suggestion that you enter into a swap or trading strategy involving a swap or any other transaction. Scotiabank may engage in transactions in a manner inconsistent with the views discussed this report and may have positions, or be in the process of acquiring or disposing of positions, referred to in this report.
Scotiabank, its affiliates and any of their respective officers, directors and employees may from time to time take positions in currencies, act as managers, co-managers or underwriters of a public offering or act as principals or agents, deal in, own or act as market makers or advisors, brokers or commercial and/or investment bankers in relation to securities or related derivatives. As a result of these actions, Scotiabank may receive remuneration. All Scotiabank products and services are subject to the terms of applicable agreements and local regulations. Officers, directors and employees of Scotiabank and its affiliates may serve as directors of corporations.
Any securities discussed in this report may not be suitable for all investors. Scotiabank recommends that investors independently evaluate any issuer and security discussed in this report, and consult with any advisors they deem necessary prior to making any investment.
This report and all information, opinions and conclusions contained in it are protected by copyright. This information may not be reproduced without the prior express written consent of Scotiabank.
™ Trademark of The Bank of Nova Scotia. Used under license, where applicable.
Scotiabank, together with “Global Banking and Markets”, is a marketing name for the global corporate and investment banking and capital markets businesses of The Bank of Nova Scotia and certain of its affiliates in the countries where they operate, including; Scotiabank Europe plc; Scotiabank (Ireland) Designated Activity Company; Scotiabank Inverlat S.A., Institución de Banca Múltiple, Grupo Financiero Scotiabank Inverlat, Scotia Inverlat Casa de Bolsa, S.A. de C.V., Grupo Financiero Scotiabank Inverlat, Scotia Inverlat Derivados S.A. de C.V. – all members of the Scotiabank group and authorized users of the Scotiabank mark. The Bank of Nova Scotia is incorporated in Canada with limited liability and is authorised and regulated by the Office of the Superintendent of Financial Institutions Canada. The Bank of Nova Scotia is authorized by the UK Prudential Regulation Authority and is subject to regulation by the UK Financial Conduct Authority and limited regulation by the UK Prudential Regulation Authority. Details about the extent of The Bank of Nova Scotia's regulation by the UK Prudential Regulation Authority are available from us on request. Scotiabank Europe plc is authorized by the UK Prudential Regulation Authority and regulated by the UK Financial Conduct Authority and the UK Prudential Regulation Authority.
Scotiabank Inverlat, S.A., Scotia Inverlat Casa de Bolsa, S.A. de C.V, Grupo Financiero Scotiabank Inverlat, and Scotia Inverlat Derivados, S.A. de C.V., are each authorized and regulated by the Mexican financial authorities.
Not all products and services are offered in all jurisdictions. Services described are available in jurisdictions where permitted by law.