- Canada’s job gain showcased resilience, but mixed details...
- ...but hours worked indicate a strong Q1 for GDP...
- ...and wage growth rebounded
- This supports our call for the BoC to be in no rush to ease
- Public sector payrolls continue their record gains
- Canada’s excessive population growth is breaking all records—and causing strains
- Canadian jobs m/m 000s // UR %, February, SA:
- Actual: 40.7 / 5.8
- Scotia: 25 / 5.6
- Consensus: 20 / 5.8
- Prior: 37.3 / 5.7
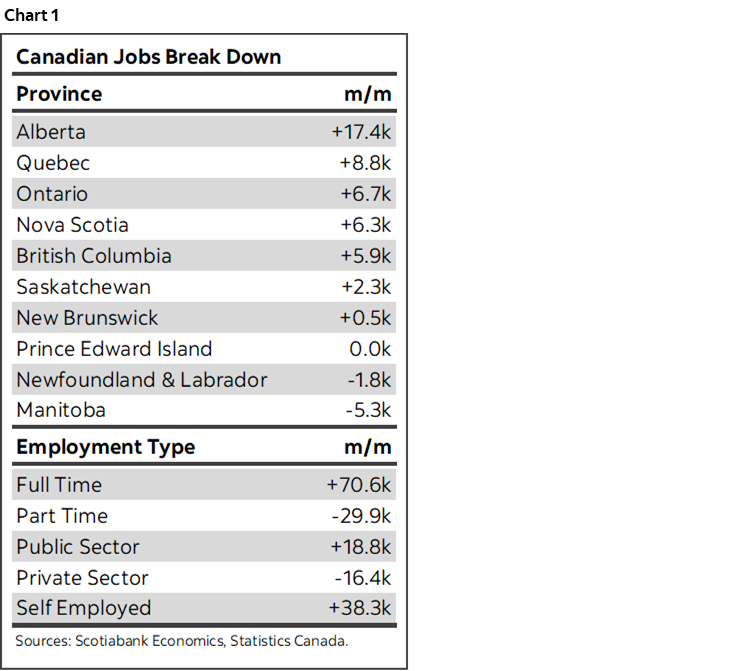
Canada added another 40,700 jobs in February. While the details were mixed, they were good enough and the job market remains resilient. Wage growth rebounded and is still outpacing inflation and productivity. Hours worked are indicating that Q1 GDP is on track for a solid rebound that could at least halt progress toward opening disinflationary slack, if not reverse it. Overall this is a strong set of numbers that further leans against any rush for the BoC to ease. Chart 1 provides a few summary measures.
MARKETS—CAD SLIGHTLY FIRMER, RATES UNDERPERFORM U.S.
Markets reacted more to the US numbers that were still pretty decent but missed expectations net of revisions. Canada’s front-end slightly rallied in tandem with the US with the 2s yield dipping by a modest 1–2bps post data. Nonfarm was respectable at 275k but with –117k of negative revisions. USDCAD is little changed post-jobs.
BANK OF CANADA—NO RUSH TO CUT
The evidence at the margin here supports our call for the BoC to be in hurry to cut rates and this will be elaborated upon in the pertinent sections below. We are tracking a decent rebound in the economy during Q1. Wage growth is still well above the BoC’s target and likely to remain there as productivity remains poor. The job market remains resilient no matter how you slice the data.
WAGE GROWTH REBOUNDED
Wages of permanent employees accelerated to 4.2% m/m SAAR which is a solid rebound from the prior month’s dip of –1.6% m/m SAAR (chart 2). The year-over-year growth rate ebbed a few tenths to 4.9% from 5.3% but we’re still getting wage gains well above the BoC’s inflation target.
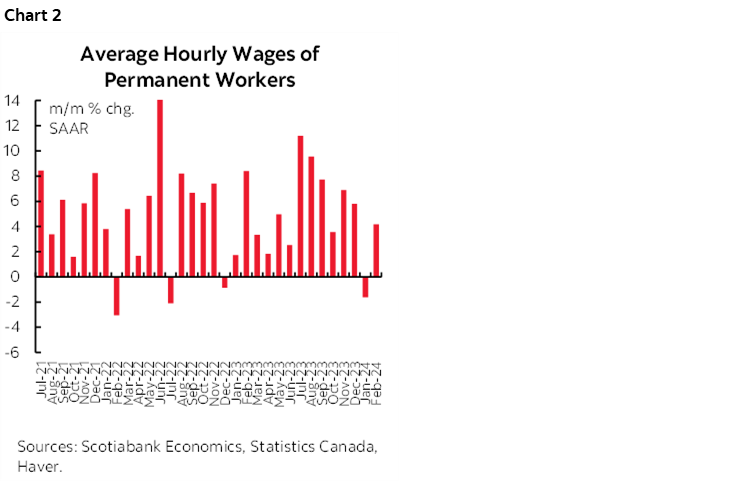
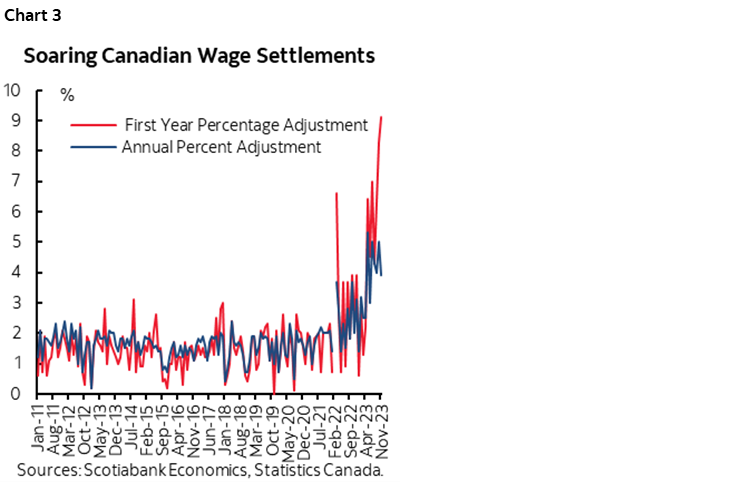
Now, compared to the massive surge last summer that is slowing from ridiculous heights that were pushing into the double digits, but it’s volatile data as the chart shows. We also can’t judge the wage cycle just on the basis of this chart. That’s because in a labour where one-in-three workers is unionized versus 10% in the US, the wages being struck in collective bargaining agreements are explosive and cementing years of strong wage gains in a key part of the workforce (chart 3).
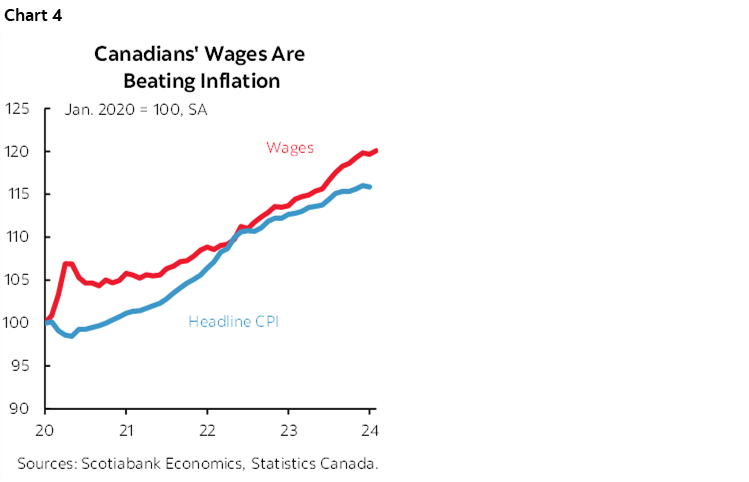
Canadian wages continue to outpace inflation (chart 4). The 'make-up' argument—that wage gains are being sought to compensate for past inflation—remains nonsense. It is also out of sync with productivity.
When the BoC talks wages, they should be careful to talk real wage pressures that may intensify if inflation eases, and in productivity-adjusted terms. I’m not the least bit convinced that such an approach will cool going forward as opposed to representing persistent upward pressure upon the BoC’s inflation target.
REBOUND IN HOURS WORKED SUPPORTS Q1 GDP
Total hours worked were up by 0.3% m/m SA. Statcan curiously described that as ‘little changed.’ What??? Good heavens, 0.3 is a very solid gain and it supports expectations for a decent gain in February GDP pending more data on the activity side.
What’s more, hours worked are tracking a jump of 3.3% q/q at a seasonally adjusted and annualized rate (SAAR). That’s based on the 0.3% gain in February, the 0.6% jump in January, the Q4 average and assuming March comes in flat in order to focus the math upon the effects of what is known thus far without imposing arbitrary judgement on March.
As chart 5 shows, that’s the biggest lift to hours worked since 2023Q1 when hours were up by 4.9%. Recall that GDP was up by 2.6% q/q SAAR that quarter.
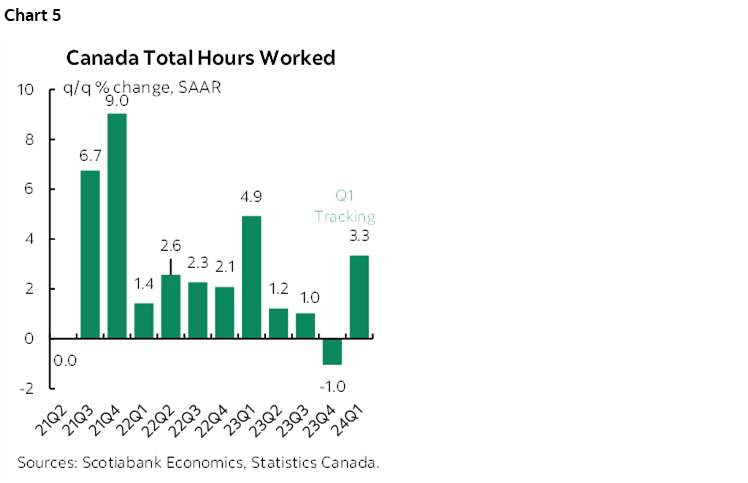
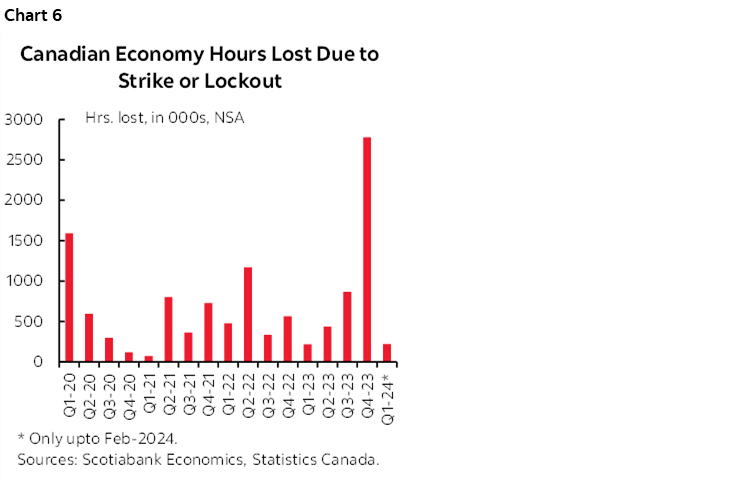
Chart 6 also makes the point about why Q4 GDP was ok but soft and Final Domestic Demand slipped, while Q1 is rebounding. Q4 was nailed by strikes in Quebec in particular (public sector, St. Lawrence Seaway). They went back into Q1 and so that's part of why hours and GDP are rebounding. The two need to be smoothed, yet so much of the commentary is just focused upon the data without asking why
MIXED DETAILS TO THE GAIN IN JOBS
There were pluses and minuses across the details.
For one, all the gain was in full-time employment (+70.6k) as part-time jobs fell by 29.9k. That reverses the prior month’s 49k jump in part-time and 11.6k drop in full-time.
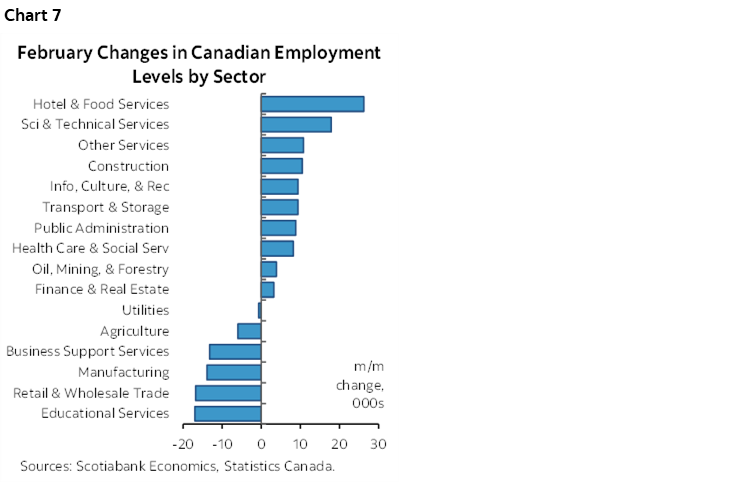
Breadth across sectors was mixed. Chart 7 breaks down the gains by industrial sectors and it was ok in that regard. The overall goods sector was down 6.3k while services were up 47k.
I don’t like to see private payrolls down by 16.5k. Private companies are the drivers of wealth in the economy. That’s a blemish, but it comes after four decent prior gains.
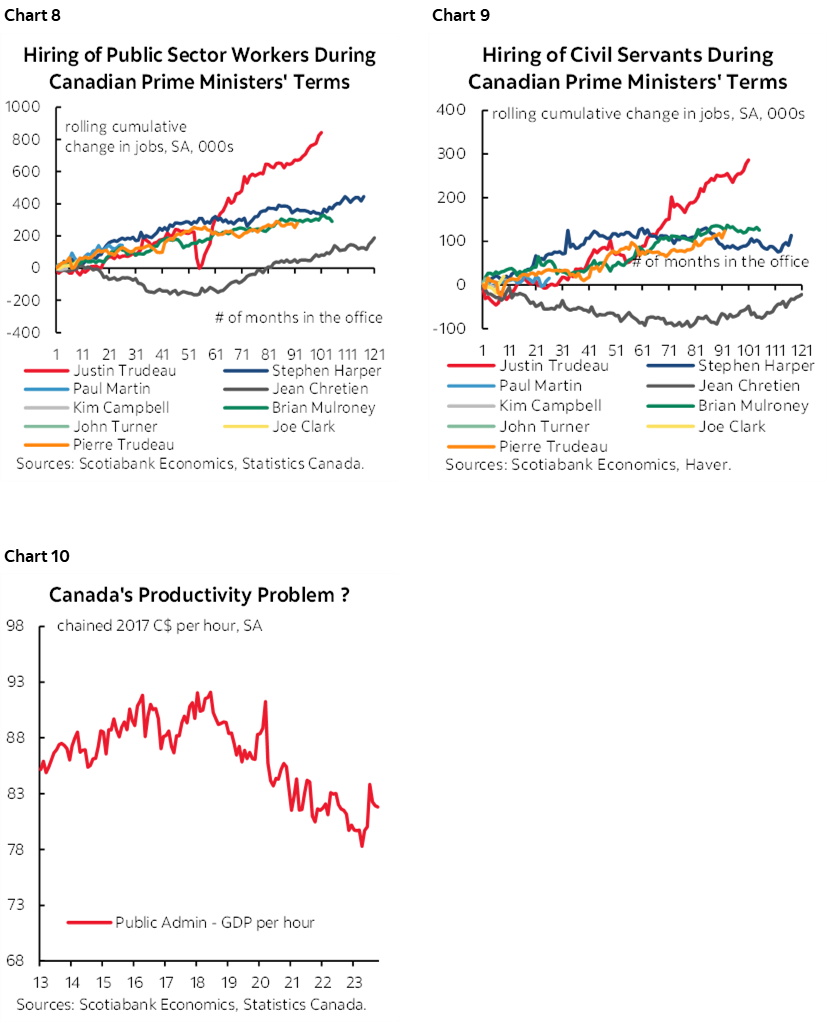
Public sector payrolls were up by another 18.8k including 8.8k in public administration. The massive upward march in public sector jobs is continuing (charts 8, 9). 52% of all jobs created in Canada since the start of the pandemic have been in the public sector including 18.4% of all jobs created over this period that have been in public administration (civil servants). This rising weight on sagging productivity (chart 10) is not helping matters.
Self-employed positions were up by 38.3k. Self-employed jobs are valuable to the Canadian economy, but it’s the softest of soft data with a higher standard deviation around the estimates than for total employment changes.
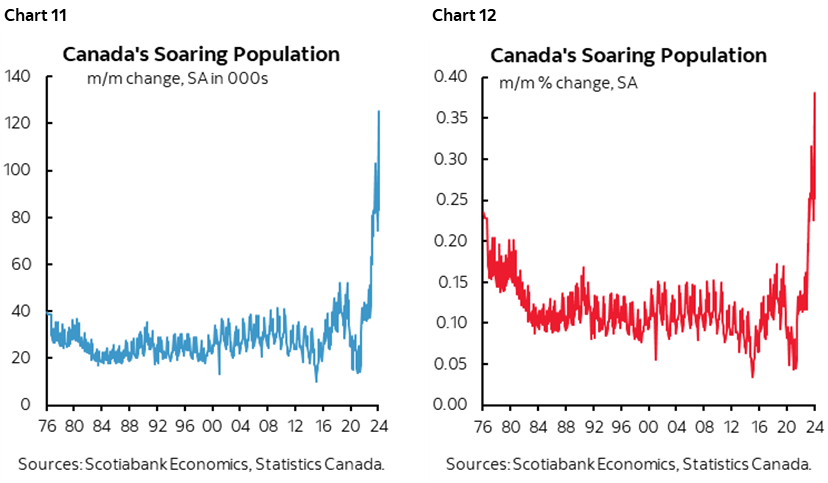
POPULATION GROWTH IS BREAKING RECORDS
Population was up by another 83k in February over January. It’s up by 1.03 million in year-over-year terms. February and January combined were the strongest back-to-back months for population growth in recorded history. Chart 11 shows the massive surge that is occurring and it’s being fed by unsustainably high immigration, in my view. Chart 12 does the same thing in m/m % terms which is a way of controlling for different population size over long periods of time. Either way you slice it, it’s a record.
I’ve said it a million times, but will say it again. Canada needs higher immigration in an aging workforce amid low fertility rates. I’ve long supported higher immigration to be phased in over time and advanced strong proposals to do so two decades ago. Canadians are supportive of immigration versus darker discussions elsewhere in the world and I have no time for anyone who is going to take a darker approach to the debate. Immigration has been the bedrock of the Canadian economy’s success since Confederation. Adjusting GDP per capita needs to consider the possibility that second- and third-round effects could be favourable.
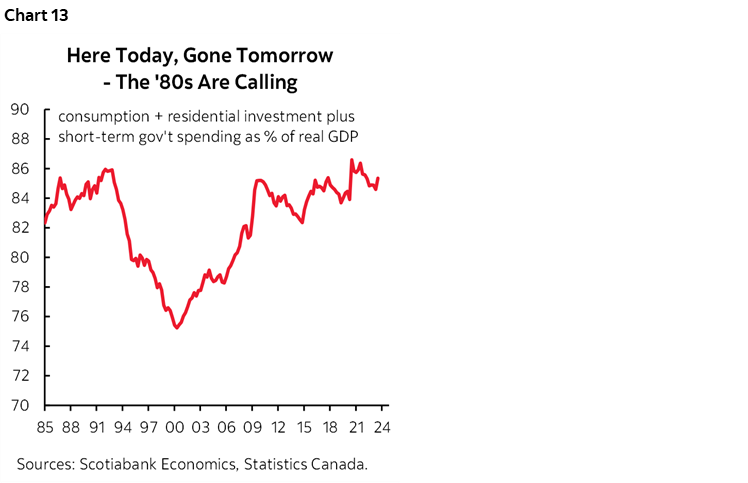
The pace, however, is too much, too quickly and there was zero planning or preparation done in advance of this. It’s as if it was all done on a total lark. The Federal Government is in total scramble mode as a result and it’s dragging provinces and municipalities along with it. Micro housing announcements will build homes over the coming years but we need them now and the volume of housing being announced is too small to address the demand. Instead of curtailing immigration—which would be the smart thing to do in my view—we are more likely to see the Budget on April 16th just dig deeper with more housing incentives. Infrastructure shortfalls that already existed are being made worse. So are teacher shortages and the strained health care and social services.
That’s a problem because of the massive allocation of the economy’s resources to consumption, housing and government spending with little left over for investment and a productivity focus (chart 13). That share is at the highest since the late 1980s and early 1990s. Two wrongs will not make a right. As former BoC Governor John Crow once put it: “Shorter-run biases in economic policy stack the deck in favour of inflation. So while accommodating and encouraging inflation is all too easy, limiting and reducing inflation is not.”
DISCLAIMER
This report has been prepared by Scotiabank Economics as a resource for the clients of Scotiabank. Opinions, estimates and projections contained herein are our own as of the date hereof and are subject to change without notice. The information and opinions contained herein have been compiled or arrived at from sources believed reliable but no representation or warranty, express or implied, is made as to their accuracy or completeness. Neither Scotiabank nor any of its officers, directors, partners, employees or affiliates accepts any liability whatsoever for any direct or consequential loss arising from any use of this report or its contents.
These reports are provided to you for informational purposes only. This report is not, and is not constructed as, an offer to sell or solicitation of any offer to buy any financial instrument, nor shall this report be construed as an opinion as to whether you should enter into any swap or trading strategy involving a swap or any other transaction. The information contained in this report is not intended to be, and does not constitute, a recommendation of a swap or trading strategy involving a swap within the meaning of U.S. Commodity Futures Trading Commission Regulation 23.434 and Appendix A thereto. This material is not intended to be individually tailored to your needs or characteristics and should not be viewed as a “call to action” or suggestion that you enter into a swap or trading strategy involving a swap or any other transaction. Scotiabank may engage in transactions in a manner inconsistent with the views discussed this report and may have positions, or be in the process of acquiring or disposing of positions, referred to in this report.
Scotiabank, its affiliates and any of their respective officers, directors and employees may from time to time take positions in currencies, act as managers, co-managers or underwriters of a public offering or act as principals or agents, deal in, own or act as market makers or advisors, brokers or commercial and/or investment bankers in relation to securities or related derivatives. As a result of these actions, Scotiabank may receive remuneration. All Scotiabank products and services are subject to the terms of applicable agreements and local regulations. Officers, directors and employees of Scotiabank and its affiliates may serve as directors of corporations.
Any securities discussed in this report may not be suitable for all investors. Scotiabank recommends that investors independently evaluate any issuer and security discussed in this report, and consult with any advisors they deem necessary prior to making any investment.
This report and all information, opinions and conclusions contained in it are protected by copyright. This information may not be reproduced without the prior express written consent of Scotiabank.
™ Trademark of The Bank of Nova Scotia. Used under license, where applicable.
Scotiabank, together with “Global Banking and Markets”, is a marketing name for the global corporate and investment banking and capital markets businesses of The Bank of Nova Scotia and certain of its affiliates in the countries where they operate, including; Scotiabank Europe plc; Scotiabank (Ireland) Designated Activity Company; Scotiabank Inverlat S.A., Institución de Banca Múltiple, Grupo Financiero Scotiabank Inverlat, Scotia Inverlat Casa de Bolsa, S.A. de C.V., Grupo Financiero Scotiabank Inverlat, Scotia Inverlat Derivados S.A. de C.V. – all members of the Scotiabank group and authorized users of the Scotiabank mark. The Bank of Nova Scotia is incorporated in Canada with limited liability and is authorised and regulated by the Office of the Superintendent of Financial Institutions Canada. The Bank of Nova Scotia is authorized by the UK Prudential Regulation Authority and is subject to regulation by the UK Financial Conduct Authority and limited regulation by the UK Prudential Regulation Authority. Details about the extent of The Bank of Nova Scotia's regulation by the UK Prudential Regulation Authority are available from us on request. Scotiabank Europe plc is authorized by the UK Prudential Regulation Authority and regulated by the UK Financial Conduct Authority and the UK Prudential Regulation Authority.
Scotiabank Inverlat, S.A., Scotia Inverlat Casa de Bolsa, S.A. de C.V, Grupo Financiero Scotiabank Inverlat, and Scotia Inverlat Derivados, S.A. de C.V., are each authorized and regulated by the Mexican financial authorities.
Not all products and services are offered in all jurisdictions. Services described are available in jurisdictions where permitted by law.