Over 400k jobs were recouped including revisions…
…beating most estimates and exceeding advance signals…
...but breadth and other details dented quality...
...and so initial market reactions quickly reversed
US nonfarm payrolls, m/m change 000s / UR / wages y/y %, SA, February:
Actual: 379 / 6.2 / 5.3
Scotia: 175 / 6.5 / 5.3
Consensus: 200 / 6.3 / 5.3
Prior: 166 / 6.3 / 5.3 (revised from 49 / 6.3 / 5.4)
Let the jobs recovery begin! Nonfarm payrolls rocketed past expectations in a statistically significant manner that exceeded the milder advance signals provided by other labour market readings. There were a few dents in the US labour market’s shiny new wheels, but who’s to quibble. 379,000 jobs gained with a mild net two-month upward revision of 38k for a combined total of over 400,000 more jobs than were being tracked before 8:30amET this morning is a welcome development no matter how it’s sliced.
The US 10-year Treasury—already feeling unloved—reined in its initial upward reaction when market participants had a look at some of the details. Ditto for initial USD strength and the initial decline in US equity futures.
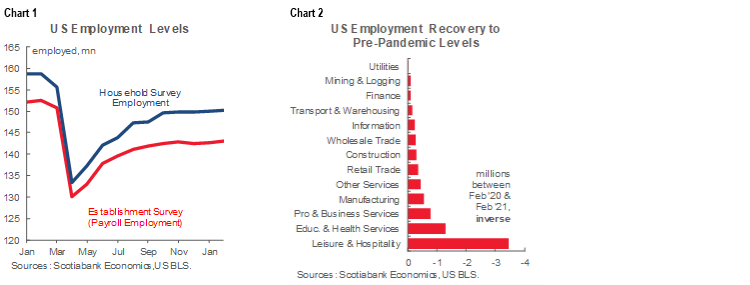
As chart 1 shows, while improvement was recorded, don’t expect Fed Chair Powell to jump for joy just yet. It’s not like he’s going to say woo-hoo, now we only have 9.48 million folks without a job who had them in February instead of 10 million! Chart 2 breaks down this shortfall to show where they are most concentrated and in the process illustrates the potential for over 3 million jobs to come back in the leisure/hospitality sector as vaccines get widely distributed. Nevertheless, it’s progress and doesn’t hurt the Fed’s narrative that better days are ahead.
So what drove the headline gain and why the mixed but generally less upbeat second take?
First, it was all about the private sector (+465k) as government jobs fell by 86k almost entirely due to state and local governments. That’s a good start.
Second, the hiring gain was fully driven by the service sector (+513k). The sector breakdown is shown in chart 3. Goods sectors shed 48k jobs. Within goods, the construction sector was down 61k but the Bureau of Labour Statistics blamed that on weather disruptions to construction projects and so one should expect that component to bounce back. So I guess we could take out the construction decline as transitory which helps the headline job gain.

Of the 513k services gain, however, 355k came out of just one sector—the battered leisure and hospitality industries. That sector is the one that has been hit the most by pandemic effects and so the rebound from over half a million jobs lost during the two prior months reflects a bit of catch up as restrictions gradually ease, vaccines get rolled out and confidence gradually improves.
The rest of the jobs picture registered narrower breadth. A 53k rise in temp help continues the trend of gains in this category. Education/health jobs were up 44k. Trade/transport gained 49k almost entirely due to a 41k rise in retail trade sector hiring. The financial services (-5k) and IT (-3k) sectors were flat.
The unemployment rate fell back to 6.2% from 6.3% because the labour force expanded by just 50k while the household survey posted a 208k job gain. The UR is derived from the household survey.
The U6 underemployment rate catch-all of unemployed and underemployed workers didn't budge either and stayed at 11.1%. It has not registered much progress for quite some time (chart 4).

Wage growth was unchanged at 5.3% y/y but the prior month was revised down a tick from 5.4% (chart 5). The fact that the rise in jobs was concentrated in the lowest paying areas acted as a constraint against the change in overall wage growth. Average wage growth remains misleading because of all the lower paid pandemic-hit jobs that fell out of the calculations.

Another dent in the quality of the report is that total hours worked were not so hot. They fell by 0.5% m/m in February and the prior month's 0.9% rise was revised down a bit to 0.7%.
As a GDP connection, the annualized gain in hours worked at 0.3% q/q is another dent against the headline gain. Hours worked were up 8% q/q SAAR in Q4 when the US posted 4.1% GDP growth. Being essentially flat in Q1 is not great for GDP given GDP is an identity defined as hours worked times labour productivity with the latter defined as output per hour worked. So to get a strong Q1 GDP reading would require very strong gains in the productivity numerator, ie: activity readings with only partial Q1 readings so far.
Those on temp layoff fell again to 2.2 million from a peak of 18 million last April. Chart 6.

The unflattering label of "permanent job losers" was little changed at 3.5 million (chart 6 again). There has been very little change in this category for months now, hovering around 3 1/2 million for a while. In a sense that's a little bit of a positive. The rise in permanently unemployed folks from 1.3 million before the pandemic to around this recent range by September has been moving sideways to slightly lower since then so at least we're not still adding to their numbers
Also, the number of folks working part-time who would prefer full-time (another Fed metric of slack) stood at 6.1 million which is up a touch from January's 5.95 million. However, it had peaked at 10.9 million last April and so we're running at about half that number but still well above the pre-pandemic 4.3 million range
In any event, the main change in hiring momentum still lies ahead as absurdly strong fiscal stimulus combines with vaccines. I wouldn't be surprised to see some prints in the high hundreds if not millions along the way as businesses reopen. It’s misleading to suggest that the Fed wouldn’t care about GDP given the connection over time between economic growth and jobs. The loose Okun’s ‘law’ relationship would suggest that if we’re anywhere on the mark with our growth projections this year, then we could be looking at 4–5 million jobs being regained over the coming year. To me, that would be ‘substantial progress’ but we’ll have to see how it tracks and whether that ticks the taper box in the minds of FOMC officials.
DISCLAIMER
This report has been prepared by Scotiabank Economics as a resource for the clients of Scotiabank. Opinions, estimates and projections contained herein are our own as of the date hereof and are subject to change without notice. The information and opinions contained herein have been compiled or arrived at from sources believed reliable but no representation or warranty, express or implied, is made as to their accuracy or completeness. Neither Scotiabank nor any of its officers, directors, partners, employees or affiliates accepts any liability whatsoever for any direct or consequential loss arising from any use of this report or its contents.
These reports are provided to you for informational purposes only. This report is not, and is not constructed as, an offer to sell or solicitation of any offer to buy any financial instrument, nor shall this report be construed as an opinion as to whether you should enter into any swap or trading strategy involving a swap or any other transaction. The information contained in this report is not intended to be, and does not constitute, a recommendation of a swap or trading strategy involving a swap within the meaning of U.S. Commodity Futures Trading Commission Regulation 23.434 and Appendix A thereto. This material is not intended to be individually tailored to your needs or characteristics and should not be viewed as a “call to action” or suggestion that you enter into a swap or trading strategy involving a swap or any other transaction. Scotiabank may engage in transactions in a manner inconsistent with the views discussed this report and may have positions, or be in the process of acquiring or disposing of positions, referred to in this report.
Scotiabank, its affiliates and any of their respective officers, directors and employees may from time to time take positions in currencies, act as managers, co-managers or underwriters of a public offering or act as principals or agents, deal in, own or act as market makers or advisors, brokers or commercial and/or investment bankers in relation to securities or related derivatives. As a result of these actions, Scotiabank may receive remuneration. All Scotiabank products and services are subject to the terms of applicable agreements and local regulations. Officers, directors and employees of Scotiabank and its affiliates may serve as directors of corporations.
Any securities discussed in this report may not be suitable for all investors. Scotiabank recommends that investors independently evaluate any issuer and security discussed in this report, and consult with any advisors they deem necessary prior to making any investment.
This report and all information, opinions and conclusions contained in it are protected by copyright. This information may not be reproduced without the prior express written consent of Scotiabank.
™ Trademark of The Bank of Nova Scotia. Used under license, where applicable.
Scotiabank, together with “Global Banking and Markets”, is a marketing name for the global corporate and investment banking and capital markets businesses of The Bank of Nova Scotia and certain of its affiliates in the countries where they operate, including; Scotiabank Europe plc; Scotiabank (Ireland) Designated Activity Company; Scotiabank Inverlat S.A., Institución de Banca Múltiple, Grupo Financiero Scotiabank Inverlat, Scotia Inverlat Casa de Bolsa, S.A. de C.V., Grupo Financiero Scotiabank Inverlat, Scotia Inverlat Derivados S.A. de C.V. – all members of the Scotiabank group and authorized users of the Scotiabank mark. The Bank of Nova Scotia is incorporated in Canada with limited liability and is authorised and regulated by the Office of the Superintendent of Financial Institutions Canada. The Bank of Nova Scotia is authorized by the UK Prudential Regulation Authority and is subject to regulation by the UK Financial Conduct Authority and limited regulation by the UK Prudential Regulation Authority. Details about the extent of The Bank of Nova Scotia's regulation by the UK Prudential Regulation Authority are available from us on request. Scotiabank Europe plc is authorized by the UK Prudential Regulation Authority and regulated by the UK Financial Conduct Authority and the UK Prudential Regulation Authority.
Scotiabank Inverlat, S.A., Scotia Inverlat Casa de Bolsa, S.A. de C.V, Grupo Financiero Scotiabank Inverlat, and Scotia Inverlat Derivados, S.A. de C.V., are each authorized and regulated by the Mexican financial authorities.
Not all products and services are offered in all jurisdictions. Services described are available in jurisdictions where permitted by law.