- Q2 GDP might be tracking a decline…
- ...with varied drivers from tariffs to weather to forest fires
- Core inflation to date remains too high and sticky…
- ...ahead of forward-looking inflation risks beyond just GDP and slack arguments
- US core PCE surprises higher, but the consumer sector stumbled
- Canadian GDP m/m % change, April, SA:
- Actual: -0.1
- Scotia: 0.0
- Consensus: 0.0
- Prior: 0.2 (revised from 0.1)
- May ‘flash’ estimate: -0.1
Canada’s economy stumbled in April and May with an upward revision to March. The reasons probably have much to do with unwinding the effects of tariff front-running and then forest fires and weather. Q1 and Q2 are likely best combined in terms of tracking in order to smooth out these effects with the focus remaining a) on 2025H2 growth, and b) on the more complex drivers of core inflation to date and going forward.
GDP shrank by 0.1% m/m in April which was two-tenths lower than Statcan’s initial ‘flash’ guidance provided about a month ago. Some of that was due to weaker data since then as guided. But some of it was due to an upward revision to March GDP that moved up a tick to 0.2% m/m SA, thereby providing a higher jumping off point for April GDP and making continued growth more difficult.
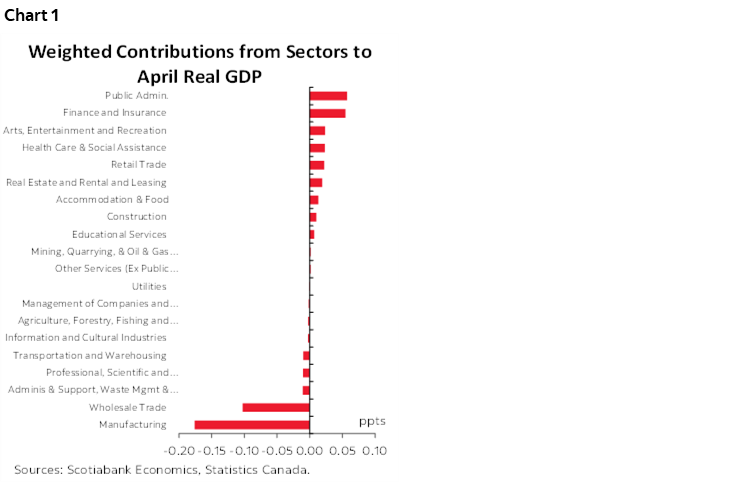
Chart 1 shows that manufacturing and wholesalers were a big driver of the drag on April GDP that combined to knock a weighted three-tenths off of GDP growth that month. This is an unwind of the modest lift to GDP provided by those sectors in prior months. Manufacturing and wholesale had combined to add a rounded up 0.2 ppts to each of January and February GDP growth. They overshot due to tariff front-running and are undershooting as those effects wear off. The forward trend is likely to be weak for those categories.
May’s flash GDP estimate is -0.1%. There are a few cautions around this estimate. For one, the guidance is limited by way of drivers as we don’t get any details beyond this explanation from Statcan:
“Decreases in mining, quarrying, and oil and gas extraction, public administration and retail trade were partially offset by an increase in real estate and rental and leasing.”
Second, some of May’s weakness was likely due to a combination of forest fires and weather. The emphasis by Statcan on mining and oil and gas may be related to the limited interruptions that were reported by the sector to have been related to fires. Statcan had put out this earlier report that provided an estimate of the forest fires affecting areas accounting for 0.125% of Canadian GDP. Plus, in the population-dense parts of the country like Ontario and Quebec, the slow start to Spring may have dampened activity in seasonal categories. Frankly, May was a miserable month for weather in central Canada.
And thirdly, the flash estimates for GDP are prone to high revision risk at all times although at this stage we can’t assess in which direction.
Q2 GDP is tracking -0.3% q/q SAAR after 1.6% q/q SAAR in Q1 (chart 2). This is based on monthly GDP up to May and assuming June is flat solely in order to avoid artificially biasing the math relative to what we know to date.

So, is the economy genuinely stumbling in Q2? That’s unclear for two reasons. One is that tariff front-running in Q1 is unwinding in Q2 and we need cleaner data thereafter to have a better idea of the underlying trends. Two is that this tracking provides an incomplete picture of what’s happening because it’s only using monthly production/income-based GDP accounts that don’t capture inventory and trade swings. Inventory and trade swings are extremely important when supply shocks are being roiled by tariff effects and it’s unclear how those two effects will net out as the Q1 import surge (hence drag on GDP as a leakage effect) will reverse in Q2 while the inventory addition to growth in Q1 may reverse. Therefore, the proof will be in the quarterly GDP figures.
And would the BoC be influenced by these figures? That too is unclear. GDP is one input to an output gap framework and the BoC had estimated the gap to be between –1% and 0% in Q1. That may widen in Q2 but pending what happens to full quarter expenditure-based GDP and how the BoC assesses damage to the supply side.
But clearly there are other drivers behind why core inflation remains high and sticky on a trend basis despite potentially modest slack. The BoC’s job is inflation-targeting around a 2% target and in a forward-looking way. It is not achieving that target to date in terms of underlying price pressures and recall that headline CPI is heavily weighed down by the elimination of the consumer portion of the carbon tax.
In any event, the path forward for the BoC will also be informed by tariff and supply chain effects on inflation, prospects for a meaningful trade and security deal, and to what extent Canada blows its brains out on fiscal stimulus. The last thing Canada needs is to repeat the mistake of overdoing it on combined monetary and fiscal stimulus without evidence that inflation has been licked to date into supply chain disruptions.
U.S. INFLATION SURPRISES MARGINALLY HIGHER AS CONSUMER SECTOR WEAKENS
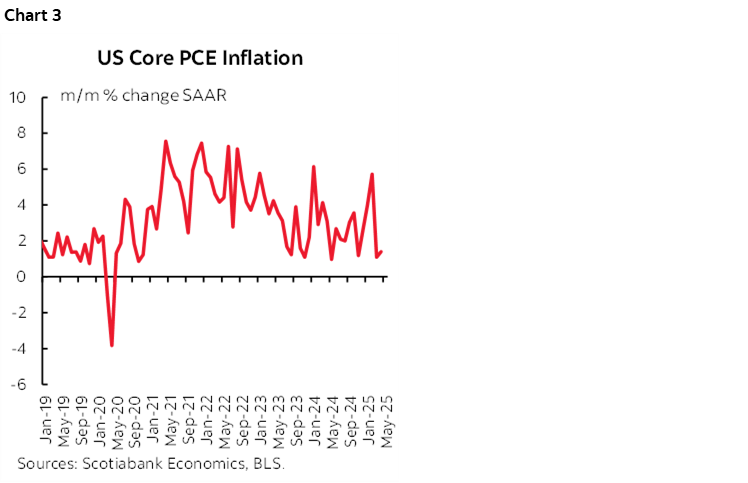
US core PCE inflation surprised almost everyone to the upside at +0.18% m/m SA, rounded up to 0.2%. That’s stronger than core CPI and adjustments for different weights in PCE on CPI categories and producer price contributions to PCE. It’s still weak though (chart 3), yet the whole debate is forward-looking in terms of when core inflation pressures may arise due to tariff pass through.
But the bigger sticker shock was on the income and spending side of the consumer figures that came out this morning. Incomes were down 0.4% m/m in May albeit after a large 0.7% rise in April. Spending slipped by –0.1% m/m and in inflation-adjusted terms fell by 0.3%. That’s much weaker than what was indicated by the retail sales control group. Goods spending fell by –0.76% m/m SA and services spending was up by 0.14%. Large declines in both consumer spending and incomes are being recorded after inflation adjustments (charts 4, 5).

DISCLAIMER
This report has been prepared by Scotiabank Economics as a resource for the clients of Scotiabank. Opinions, estimates and projections contained herein are our own as of the date hereof and are subject to change without notice. The information and opinions contained herein have been compiled or arrived at from sources believed reliable but no representation or warranty, express or implied, is made as to their accuracy or completeness. Neither Scotiabank nor any of its officers, directors, partners, employees or affiliates accepts any liability whatsoever for any direct or consequential loss arising from any use of this report or its contents.
These reports are provided to you for informational purposes only. This report is not, and is not constructed as, an offer to sell or solicitation of any offer to buy any financial instrument, nor shall this report be construed as an opinion as to whether you should enter into any swap or trading strategy involving a swap or any other transaction. The information contained in this report is not intended to be, and does not constitute, a recommendation of a swap or trading strategy involving a swap within the meaning of U.S. Commodity Futures Trading Commission Regulation 23.434 and Appendix A thereto. This material is not intended to be individually tailored to your needs or characteristics and should not be viewed as a “call to action” or suggestion that you enter into a swap or trading strategy involving a swap or any other transaction. Scotiabank may engage in transactions in a manner inconsistent with the views discussed this report and may have positions, or be in the process of acquiring or disposing of positions, referred to in this report.
Scotiabank, its affiliates and any of their respective officers, directors and employees may from time to time take positions in currencies, act as managers, co-managers or underwriters of a public offering or act as principals or agents, deal in, own or act as market makers or advisors, brokers or commercial and/or investment bankers in relation to securities or related derivatives. As a result of these actions, Scotiabank may receive remuneration. All Scotiabank products and services are subject to the terms of applicable agreements and local regulations. Officers, directors and employees of Scotiabank and its affiliates may serve as directors of corporations.
Any securities discussed in this report may not be suitable for all investors. Scotiabank recommends that investors independently evaluate any issuer and security discussed in this report, and consult with any advisors they deem necessary prior to making any investment.
This report and all information, opinions and conclusions contained in it are protected by copyright. This information may not be reproduced without the prior express written consent of Scotiabank.
™ Trademark of The Bank of Nova Scotia. Used under license, where applicable.
Scotiabank, together with “Global Banking and Markets”, is a marketing name for the global corporate and investment banking and capital markets businesses of The Bank of Nova Scotia and certain of its affiliates in the countries where they operate, including; Scotiabank Europe plc; Scotiabank (Ireland) Designated Activity Company; Scotiabank Inverlat S.A., Institución de Banca Múltiple, Grupo Financiero Scotiabank Inverlat, Scotia Inverlat Casa de Bolsa, S.A. de C.V., Grupo Financiero Scotiabank Inverlat, Scotia Inverlat Derivados S.A. de C.V. – all members of the Scotiabank group and authorized users of the Scotiabank mark. The Bank of Nova Scotia is incorporated in Canada with limited liability and is authorised and regulated by the Office of the Superintendent of Financial Institutions Canada. The Bank of Nova Scotia is authorized by the UK Prudential Regulation Authority and is subject to regulation by the UK Financial Conduct Authority and limited regulation by the UK Prudential Regulation Authority. Details about the extent of The Bank of Nova Scotia's regulation by the UK Prudential Regulation Authority are available from us on request. Scotiabank Europe plc is authorized by the UK Prudential Regulation Authority and regulated by the UK Financial Conduct Authority and the UK Prudential Regulation Authority.
Scotiabank Inverlat, S.A., Scotia Inverlat Casa de Bolsa, S.A. de C.V, Grupo Financiero Scotiabank Inverlat, and Scotia Inverlat Derivados, S.A. de C.V., are each authorized and regulated by the Mexican financial authorities.
Not all products and services are offered in all jurisdictions. Services described are available in jurisdictions where permitted by law.