- Canada’s economy is treading water…
- ...as Q1 tariff front-running gives way to Q2 payback…
- ...requiring more H2 data to evaluate performance
- More evidence that US core inflation bottomed in March
- Canadian GDP, May, m/m % SA:
- Actual: -0.1
- Scotia: -0.2
- Consensus: -0.1
- Prior: -0.1
- June GDP ‘flash’ estimate: +0.1
Canada’s economy is treading water. Neither sinking, nor challenging Canada’s world gold medal swimming superstar Summer Mcintosh. The figures are so distorted by tariff front-running and payback effects, weather, elections and perhaps postponed actions on expectations of fiscal goodies that they are largely meaningless in my opinion.
GDP shrank –0.1% m/m SA in May. That matched Statcan’s initial estimate that they shared a month ago but we now have details as shown in chart 1. Tariff front-running likely explained the tiny contribution of manufacturing and perhaps ditto for transportation and warehousing. The election effect’s unwinding explains the tiny drag from public administration. The rest of the sectors made very little contribution.
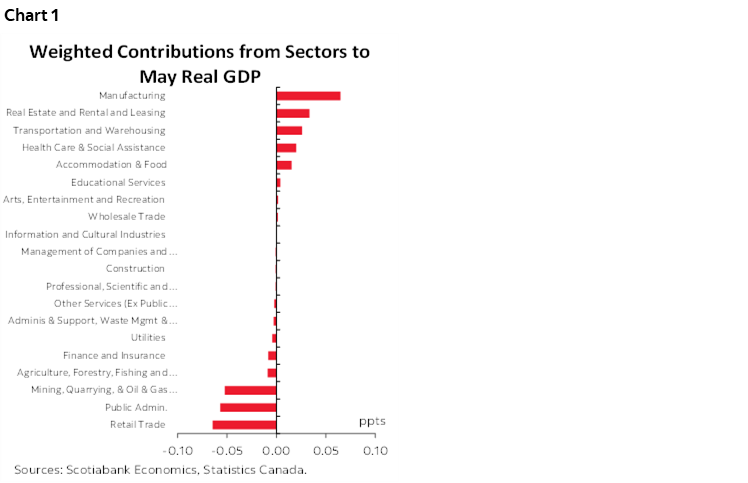
June GDP was tentatively estimated by Statcan at +0.1%. Details are never provided other than light verbal guidance: “Increases in retail trade and wholesale trade were partially offset by a decrease in manufacturing.”
What it means for the Q2 depends upon which set of GDP accounts we use. Using monthly GDP figures based on income-based concepts, Q2 was flat (+0.1% q/q SAAR).
The BoC’s forecast for Q2 in yesterday’s MPR was for a contraction of 1½% q/q SAAR. What explains the difference? The BoC—and most forecasters—use expenditure-based GDP that does a more complete job of asking how the overall economy’s income changed by incorporating figures for draw downs or expansions of inventories, and leakages or additions to GDP from import swings. Basically, the BoC is reasonably expecting that the inventory additions to GDP growth in Q1 and the higher imports that dragged on GDP in Q1 will reverse in Q2 on net. These are both related to tariff front-running and payback effects.
Nevertheless, Q2 GDP is still uncertain on an expenditure basis. We don’t have the full quarter’s trade figures with June out next week along with any possible revisions, and we don’t have the full quarter’s inventory figures among other readings. Our estimate of around no growth—or extremely little— will be further informed by more data.
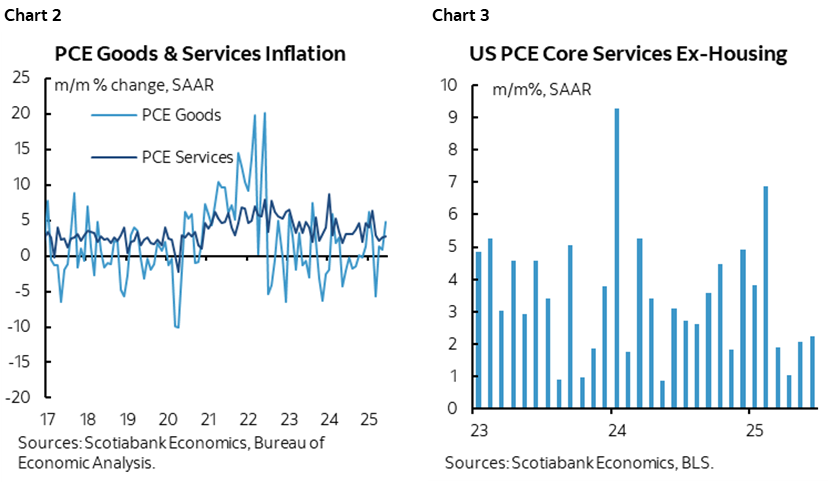
Separately, US core PCE inflation was up 0.26% m/m SA after 0.21% in May, leaving March’s 0.1% as the low point into probably coming tariff effects. Services inflation remains sticky while goods inflation is picking up (charts 2, 3).
DISCLAIMER
This report has been prepared by Scotiabank Economics as a resource for the clients of Scotiabank. Opinions, estimates and projections contained herein are our own as of the date hereof and are subject to change without notice. The information and opinions contained herein have been compiled or arrived at from sources believed reliable but no representation or warranty, express or implied, is made as to their accuracy or completeness. Neither Scotiabank nor any of its officers, directors, partners, employees or affiliates accepts any liability whatsoever for any direct or consequential loss arising from any use of this report or its contents.
These reports are provided to you for informational purposes only. This report is not, and is not constructed as, an offer to sell or solicitation of any offer to buy any financial instrument, nor shall this report be construed as an opinion as to whether you should enter into any swap or trading strategy involving a swap or any other transaction. The information contained in this report is not intended to be, and does not constitute, a recommendation of a swap or trading strategy involving a swap within the meaning of U.S. Commodity Futures Trading Commission Regulation 23.434 and Appendix A thereto. This material is not intended to be individually tailored to your needs or characteristics and should not be viewed as a “call to action” or suggestion that you enter into a swap or trading strategy involving a swap or any other transaction. Scotiabank may engage in transactions in a manner inconsistent with the views discussed this report and may have positions, or be in the process of acquiring or disposing of positions, referred to in this report.
Scotiabank, its affiliates and any of their respective officers, directors and employees may from time to time take positions in currencies, act as managers, co-managers or underwriters of a public offering or act as principals or agents, deal in, own or act as market makers or advisors, brokers or commercial and/or investment bankers in relation to securities or related derivatives. As a result of these actions, Scotiabank may receive remuneration. All Scotiabank products and services are subject to the terms of applicable agreements and local regulations. Officers, directors and employees of Scotiabank and its affiliates may serve as directors of corporations.
Any securities discussed in this report may not be suitable for all investors. Scotiabank recommends that investors independently evaluate any issuer and security discussed in this report, and consult with any advisors they deem necessary prior to making any investment.
This report and all information, opinions and conclusions contained in it are protected by copyright. This information may not be reproduced without the prior express written consent of Scotiabank.
™ Trademark of The Bank of Nova Scotia. Used under license, where applicable.
Scotiabank, together with “Global Banking and Markets”, is a marketing name for the global corporate and investment banking and capital markets businesses of The Bank of Nova Scotia and certain of its affiliates in the countries where they operate, including; Scotiabank Europe plc; Scotiabank (Ireland) Designated Activity Company; Scotiabank Inverlat S.A., Institución de Banca Múltiple, Grupo Financiero Scotiabank Inverlat, Scotia Inverlat Casa de Bolsa, S.A. de C.V., Grupo Financiero Scotiabank Inverlat, Scotia Inverlat Derivados S.A. de C.V. – all members of the Scotiabank group and authorized users of the Scotiabank mark. The Bank of Nova Scotia is incorporated in Canada with limited liability and is authorised and regulated by the Office of the Superintendent of Financial Institutions Canada. The Bank of Nova Scotia is authorized by the UK Prudential Regulation Authority and is subject to regulation by the UK Financial Conduct Authority and limited regulation by the UK Prudential Regulation Authority. Details about the extent of The Bank of Nova Scotia's regulation by the UK Prudential Regulation Authority are available from us on request. Scotiabank Europe plc is authorized by the UK Prudential Regulation Authority and regulated by the UK Financial Conduct Authority and the UK Prudential Regulation Authority.
Scotiabank Inverlat, S.A., Scotia Inverlat Casa de Bolsa, S.A. de C.V, Grupo Financiero Scotiabank Inverlat, and Scotia Inverlat Derivados, S.A. de C.V., are each authorized and regulated by the Mexican financial authorities.
Not all products and services are offered in all jurisdictions. Services described are available in jurisdictions where permitted by law.