- Canada posted a fourth month of job growth…
- ...with mixed details…
- ...but the four-month stretch has been unambiguously strong on details…
- ...as Canada’s job market throws the tariff boomerang back to the US
- Supports extended BoC hold, next move still priced higher
- Canada jobs m/m 000s / UR %, December:
- Actual: 8.2 / 6.8
- Scotia: 10 / 6.6
- Consensus: -2.5 / 6.7
- Prior: 53.6 / 6.5
Make that four in a row!
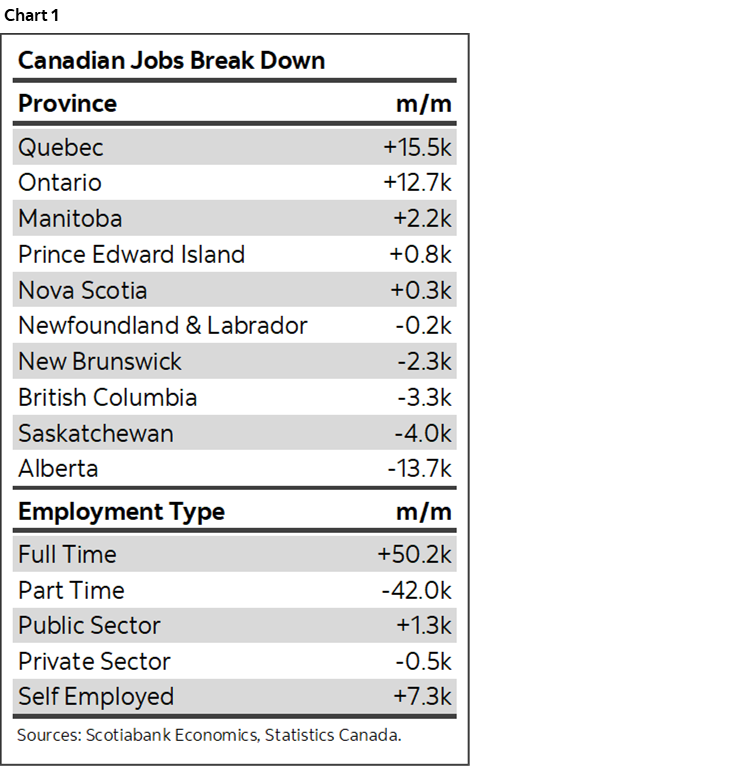
I’m sure some will nit pick, whine and gripe about some of the details and talk their books and priors, but a fact is a fact: the doomsters were wrong again. Canada retains its status as having among the world’s most resilient labour markets. The four-month trend has been unambiguously explosive in terms of totals and details. A confirmation bias by the negative nellies among strategists and economists needs to be countered. Some summary stats are shown in chart 1.
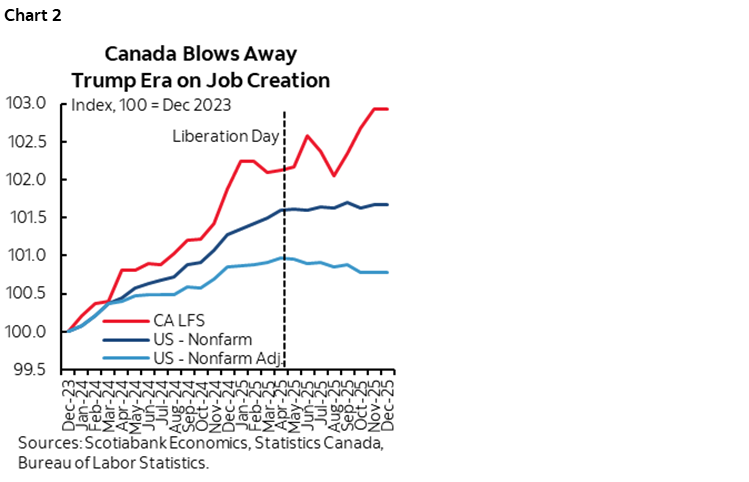
In fact, chart 2 is updated with this morning’s figures on both sides of the border. The adjusted nonfarm figures incorporate benchmarking revisions that have yet to be included. Either way—adjusted or not—US payrolls are seriously underperforming Canadian jobs. There are several explanations, a key one likely being that US policy uncertainty is harming US hiring appetite more than it is north of the border.
Markets barely blinked at the reading. Canada’s rates curve was little changed and so was USDCAD. OIS pricing for the Bank of Canada continues to lean toward the next move being up with October/December contracts priced for up to a two-thirds probability of a hike before year-end.
Today’s job numbers offer no useful information to this longer-term view that is predicated on longer-run arguments, but do support an extended pause by the BoC in the interim period.
THE TREND IS A FRIEND TO CANADA
Over the four-month spurt of job creation, Canada is up by a cumulative 189k jobs. Annualize that to about 570k and you’re tracking very strong numbers.
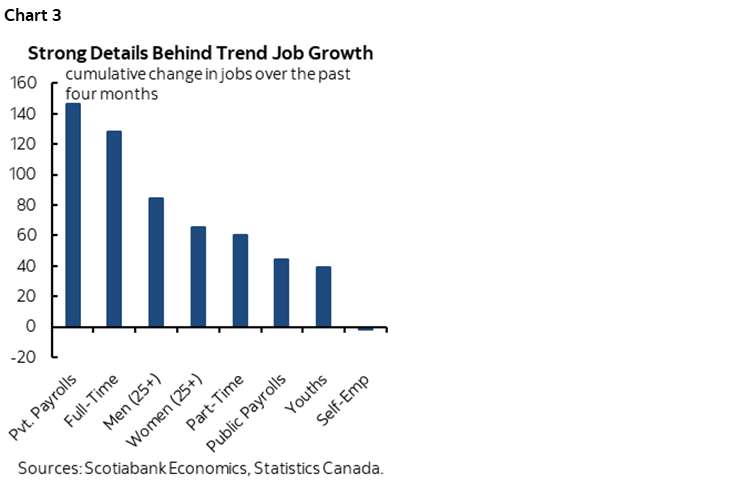
The breakdown of that four-month trend is unambiguously strong (chart 3). 147k of the 189k have been in private sector payrolls with 44k in public sector payrolls and self-employed spots have been flat. 128k full-time positions have been created with 61k part-time. Most of the job gains have been in the hands of folks with the biggest bills to pay: men aged 25+ up 85k and women 25+ up 65k, both versus 39k for youths 15–24. Throughout it all, the labour force has expanded by 145k.
Don’t like four-month trends? Prefer annuals? Ok, jobs were up 226k in 2025 after 385k in 2024, 534k in 2023. Take the pandemic rebound out of the picture and 2025 was the strongest year for job growth since 2019. Resilient is the word of the day, month, quarter, and year.
So, nitpick all you want, but the fact of the matter is that the gloomy perspective on Canada’s job market has gotten it 100% dead wrong for this whole stretch of time during which supposedly we were supposed to be reeling from tariffs. That’s not the same as saying there are not risks going forward, but go back to the start of this year and show these numbers about what was to happen in future and folks would have been gobsmacked relative to the gloom at the time.
Chart 4 shows that generally the numbers cannot be dismissed as statistical noise on a trend basis, but that’s less clear for December’s reading that could be weaker or stronger than reported.
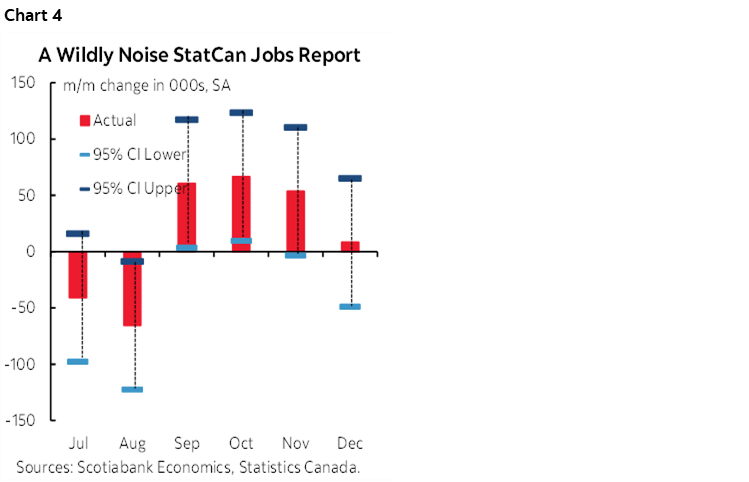
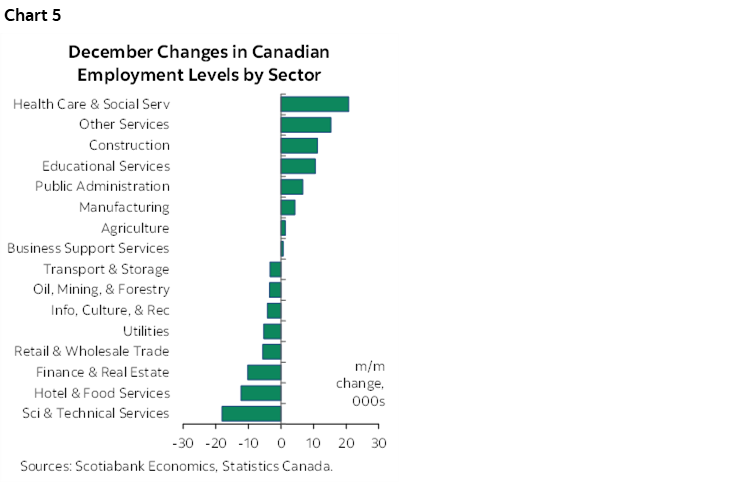
Chart 5 shows the breakdown of the change in December jobs by sector. It was mixed as to be expected when the headline is pretty modest.
The unemployment rate moved up three-tenths to 6.8%. That was because the labour force grew by 81k and hence well in excess of the 8.2k job gain. I confess to not understanding what’s going on with the size of the labour pool. The adult population was up by only 9.9k last month, so on net, there was significant re-entry into the workforce by sidelined folks. That’s happening as immigration policy tightens which is having its effects in fits and starts. Ergo smooth everything.
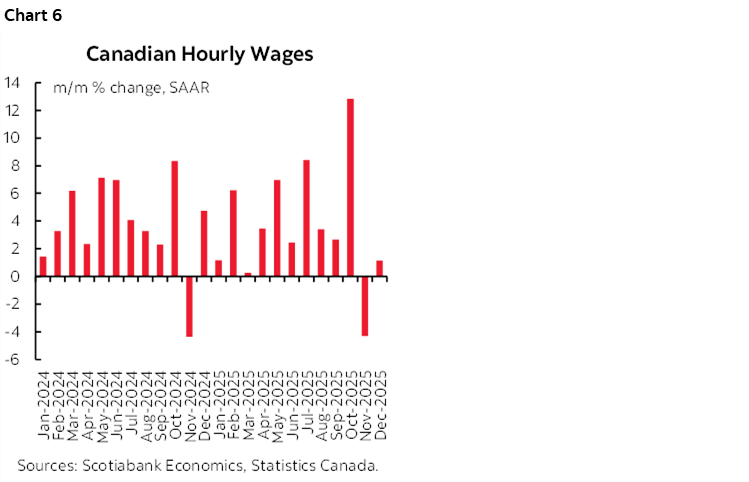
Wages were up by only 1.1% m/m SAAR after dropping by over 4% the prior month which, however, followed a massive 12.9% gain in October (chart 6). Smooth that too. And then look at collective bargaining settlements affecting about one-third of Canadian workers and which lean toward sustained solid wage gains coming in the pipeline.
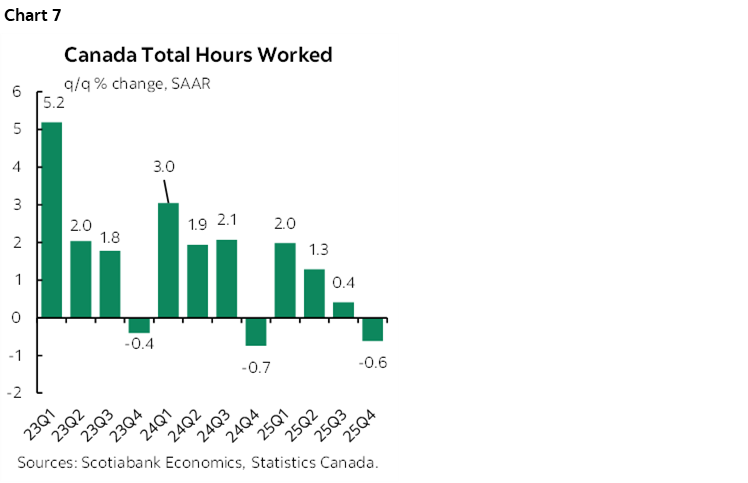
Hours worked shrank by 0.3% m/m SA. That’s a negative for December GDP since GDP is an identity defined as hours times labour productivity and don’t hold your breath for the latter. For Q4 overall, hours worked shrank by –0.6% q/q SAAR after a paltry gain of 0.4% (chart 7). That spells weak GDP. The BoC targets inflation and cost pressures are mounting through industrial prices as a leading indicator of consumer prices, costs of rising inventories, weak productivity and supply chain turmoil.
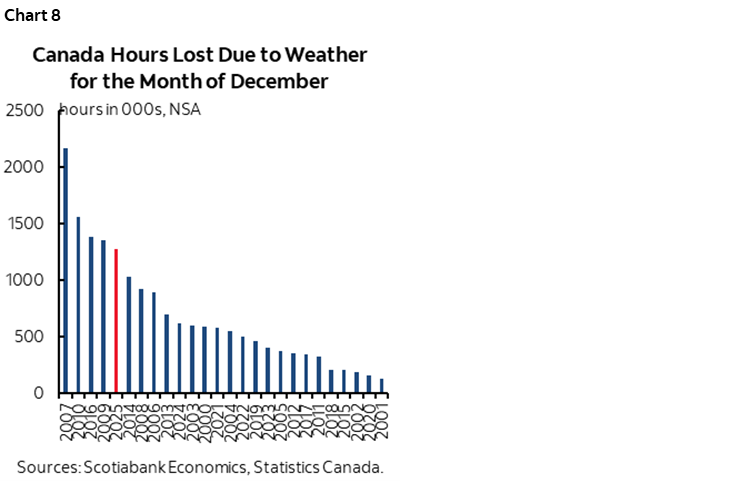
One reason hours worked landed softly in December is shown in chart 8. Apparently I wasn’t the only one thinking that this winter seemed to start earlier and more forcefully in large parts of Canada than in past years. January isn’t so great either so far, but weather-depressed hours tend to be followed by catch-up effects later on.
DISCLAIMER
This report has been prepared by Scotiabank Economics as a resource for the clients of Scotiabank. Opinions, estimates and projections contained herein are our own as of the date hereof and are subject to change without notice. The information and opinions contained herein have been compiled or arrived at from sources believed reliable but no representation or warranty, express or implied, is made as to their accuracy or completeness. Neither Scotiabank nor any of its officers, directors, partners, employees or affiliates accepts any liability whatsoever for any direct or consequential loss arising from any use of this report or its contents.
These reports are provided to you for informational purposes only. This report is not, and is not constructed as, an offer to sell or solicitation of any offer to buy any financial instrument, nor shall this report be construed as an opinion as to whether you should enter into any swap or trading strategy involving a swap or any other transaction. The information contained in this report is not intended to be, and does not constitute, a recommendation of a swap or trading strategy involving a swap within the meaning of U.S. Commodity Futures Trading Commission Regulation 23.434 and Appendix A thereto. This material is not intended to be individually tailored to your needs or characteristics and should not be viewed as a “call to action” or suggestion that you enter into a swap or trading strategy involving a swap or any other transaction. Scotiabank may engage in transactions in a manner inconsistent with the views discussed this report and may have positions, or be in the process of acquiring or disposing of positions, referred to in this report.
Scotiabank, its affiliates and any of their respective officers, directors and employees may from time to time take positions in currencies, act as managers, co-managers or underwriters of a public offering or act as principals or agents, deal in, own or act as market makers or advisors, brokers or commercial and/or investment bankers in relation to securities or related derivatives. As a result of these actions, Scotiabank may receive remuneration. All Scotiabank products and services are subject to the terms of applicable agreements and local regulations. Officers, directors and employees of Scotiabank and its affiliates may serve as directors of corporations.
Any securities discussed in this report may not be suitable for all investors. Scotiabank recommends that investors independently evaluate any issuer and security discussed in this report, and consult with any advisors they deem necessary prior to making any investment.
This report and all information, opinions and conclusions contained in it are protected by copyright. This information may not be reproduced without the prior express written consent of Scotiabank.
™ Trademark of The Bank of Nova Scotia. Used under license, where applicable.
Scotiabank, together with “Global Banking and Markets”, is a marketing name for the global corporate and investment banking and capital markets businesses of The Bank of Nova Scotia and certain of its affiliates in the countries where they operate, including; Scotiabank Europe plc; Scotiabank (Ireland) Designated Activity Company; Scotiabank Inverlat S.A., Institución de Banca Múltiple, Grupo Financiero Scotiabank Inverlat, Scotia Inverlat Casa de Bolsa, S.A. de C.V., Grupo Financiero Scotiabank Inverlat, Scotia Inverlat Derivados S.A. de C.V. – all members of the Scotiabank group and authorized users of the Scotiabank mark. The Bank of Nova Scotia is incorporated in Canada with limited liability and is authorised and regulated by the Office of the Superintendent of Financial Institutions Canada. The Bank of Nova Scotia is authorized by the UK Prudential Regulation Authority and is subject to regulation by the UK Financial Conduct Authority and limited regulation by the UK Prudential Regulation Authority. Details about the extent of The Bank of Nova Scotia's regulation by the UK Prudential Regulation Authority are available from us on request. Scotiabank Europe plc is authorized by the UK Prudential Regulation Authority and regulated by the UK Financial Conduct Authority and the UK Prudential Regulation Authority.
Scotiabank Inverlat, S.A., Scotia Inverlat Casa de Bolsa, S.A. de C.V, Grupo Financiero Scotiabank Inverlat, and Scotia Inverlat Derivados, S.A. de C.V., are each authorized and regulated by the Mexican financial authorities.
Not all products and services are offered in all jurisdictions. Services described are available in jurisdictions where permitted by law.