- Wage growth remains on fire
- Jobs numbers were not bad
- Solid gains in payroll jobs were offset by a drop in soft-data on self-employed
- Ontario’s loss was an unusual outlier
- Advice to fade early rate cut pricing has paid off
- CDN jobs m/m 000s / UR (%), December, SA:
- Actual: 0.1 / 5.8
- Scotia: 25 / 5.8
- Consensus: 15 / 5.9
- Prior: 24.9 / 5.8
- Wages: 6.2% m/m SAAR // 5.7% y/y from 5.0%
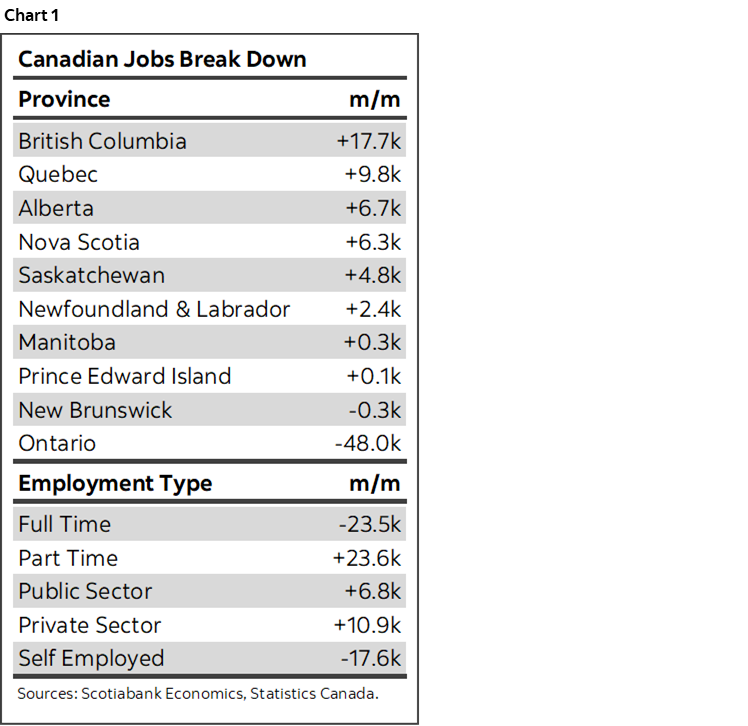
Wages put another nail in the coffin insofar as market pricing for the Bank of Canada to cut as soon as the March or April meetings is concerned. Job growth stalled and the details were mixed but generally better than the headline. Some details are in chart 1.
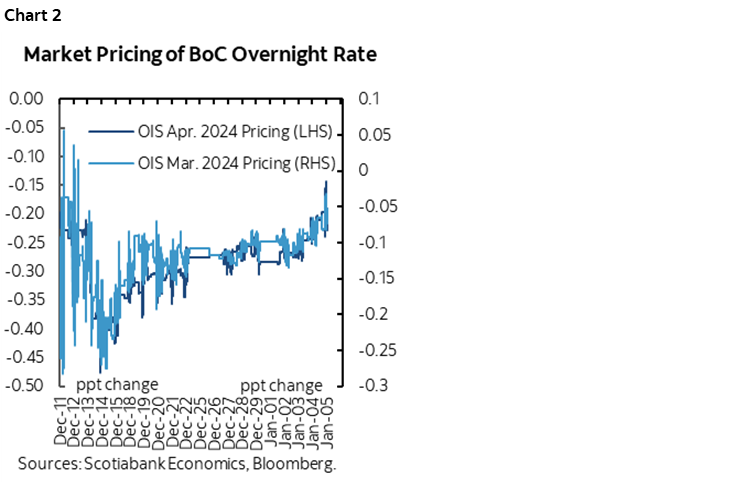
BoC CUT PRICING DRAMATICALLY SCALED BACK
Enter chart 2. Advice to pay the March and April contracts has paid off handsomely. The March BoC meeting is now only pricing about 6–8bps of easing compared to having been fully priced for a 25bps cut back around mid-December. There remains further room for taking out April cut pricing in my view with about 20–22bps of a cut priced versus what had been almost a full half point cumulative cut priced by April.
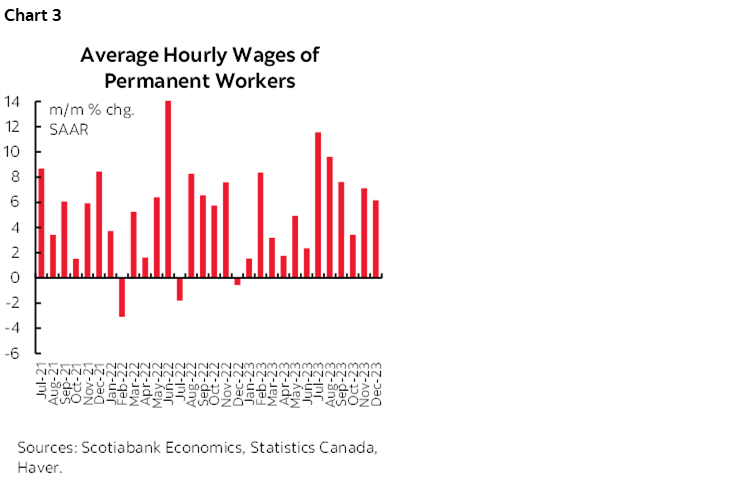
WAGE GROWTH CONTINUES TO RIP
Key in this regard is wage growth. It ripped again last month as wages were up by 6.2% m/m at a seasonally adjusted and annualized rate. This follows a gain of 7.1% the prior month and continues explosive trend growth in wages as shown in chart 3.
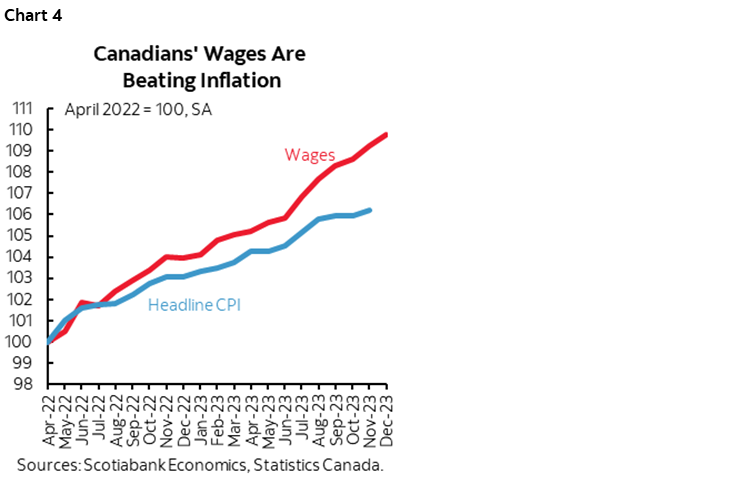
When Governor Macklem talks about what the BoC is monitoring, wages are a key part of it. Long ago invalidated has been the argument that wage gains are merely designed to make up for the hit to purchasing power from higher inflation. Chart 4 shows that wage growth has been persistently outpacing inflation for a lengthy period. Furthermore, wage settlements in collective bargaining exercises for the one-in-three Canadian workers who are unionized (versus 10% in the US) continue to skyrocket with large gains cemented for years to come, albeit that Ottawa is rather slow in updating the figures.
DETAILS
The details behind the headline jobs number were mixed. The softness was narrowly focused upon self-employed and Ontario that masked strengths elsewhere in the economy.
I don’t know what happened in Ontario last month but that province spat in the collective holiday punchbowl. I’m inclined to take with a grain of salt that one albeit rather large province spiked the overall numbers. Ontario registered a drop of nearly 50k jobs and there was enough breadth in the softness to counsel against dismissing it as a one-off narrowly fed oddity. Construction jobs fell by 20k, wholesale/retail employment was down by 12k and there were smaller declines in healthcare/social services, info/culture/recreation and accommodation and food services. The rest of the provinces combined to drive an offsetting increase.
A drop of about 18k in self-employed positions is what drove the national headline to be flat as it offset an 11k rise in private payroll positions and a 7k rise in public payroll positions. Self-employed positions can be highly valuable to the Canadian economy but this category is the softest of the soft data and I often counsel readers to fade big swings in it.
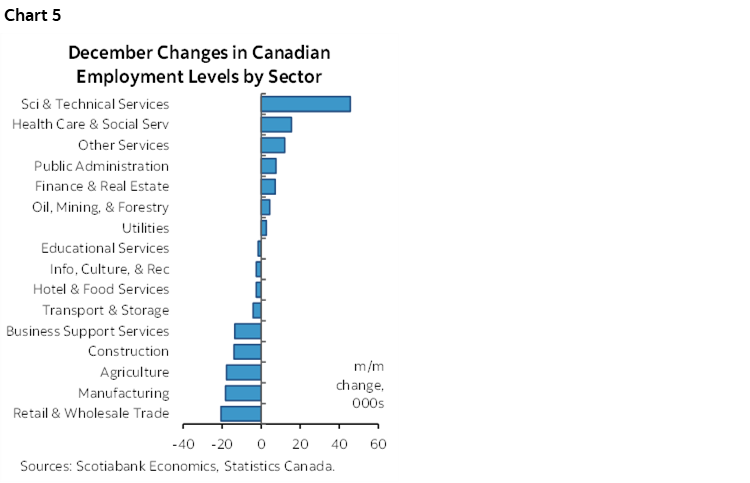
Sector breadth was soft (chart 5). The goods producing sectors lost 43k jobs with services adding an offsetting 43k. Within goods, each of agriculture, manufacturing and construction posted similar declines. Within services, the gain was fed by professional/scientific/technical services plus health care and social assistance as well as ‘other’ services.
Full-time jobs fell 23.5k and this was offset by a 23.6k rise in part-time jobs.
Hours worked were up 0.4% m/m SA which is a plus for December GDP given GDP is an identity defined as hours worked times labour productivity with the latter yet to be more fully informed by tracking activity readings.
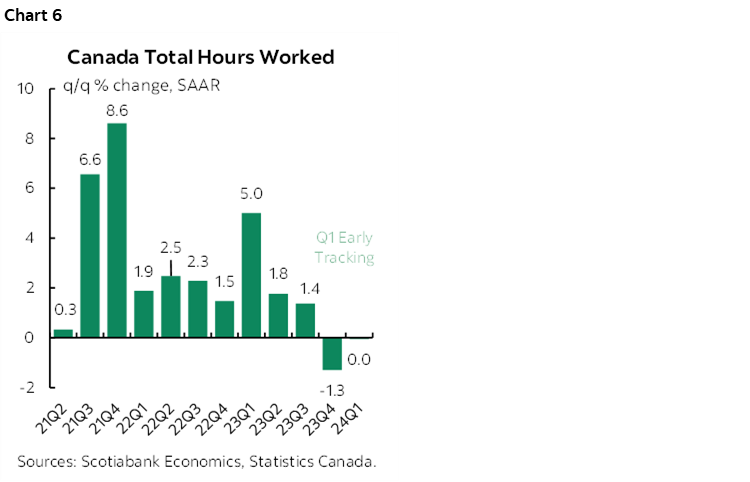
Nevertheless, hours worked fell by 1.3% q/q SAAR for Q4 overall and based only on the hand-off effect there is nothing baked into Q1 before we get any Q1 data (chart 6).
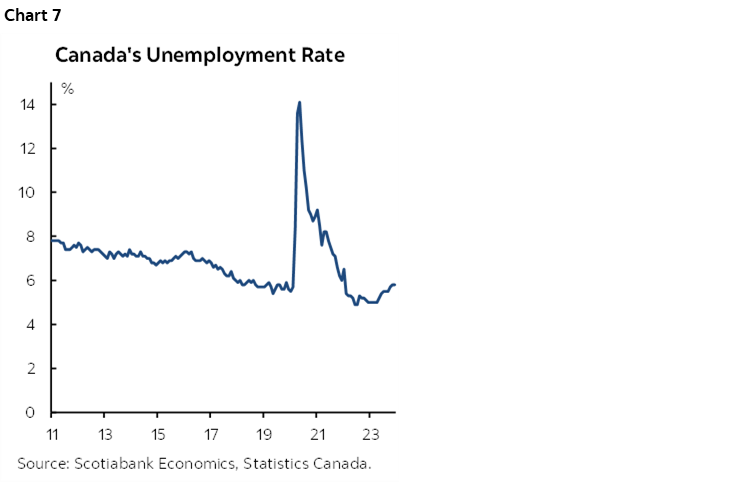
Canada’s unemployment rate was unchanged at 5.8% (chart 7). That’s because the flat aggregate change in jobs was accompanied by little change in the size of the labour force (+4.8k). That is despite the fact that population increased by another 74k last month.
So overall, it is my view that ripping wages and better job figures than the flat print suggest offer a combination of outcomes that will keep the BoC on hold. They never overreact to one set of numbers and you shouldn’t either particularly given still elevated vacancies and ripping immigration. If we keep getting wage gains like these and it translates into renewed upside to inflation then yes we cannot exclude the possibility of additional tightening or a protracted period on hold at 5% for longer than markets are priced and for longer than perhaps the very crowded consensus expects. That’s alongside other views that I still adhere to including how foolish it would be to cut into the Spring housing market and on the heels of government budgets such that inflation risk could be lit up.
The US figures offer an added external influence upon Canada. US wage growth accelerated to 4.3% m/m SAAR and payrolls were up by 216k last month. That’s a solid backdrop for the US consumer and by extension the Canadian economy.
DISCLAIMER
This report has been prepared by Scotiabank Economics as a resource for the clients of Scotiabank. Opinions, estimates and projections contained herein are our own as of the date hereof and are subject to change without notice. The information and opinions contained herein have been compiled or arrived at from sources believed reliable but no representation or warranty, express or implied, is made as to their accuracy or completeness. Neither Scotiabank nor any of its officers, directors, partners, employees or affiliates accepts any liability whatsoever for any direct or consequential loss arising from any use of this report or its contents.
These reports are provided to you for informational purposes only. This report is not, and is not constructed as, an offer to sell or solicitation of any offer to buy any financial instrument, nor shall this report be construed as an opinion as to whether you should enter into any swap or trading strategy involving a swap or any other transaction. The information contained in this report is not intended to be, and does not constitute, a recommendation of a swap or trading strategy involving a swap within the meaning of U.S. Commodity Futures Trading Commission Regulation 23.434 and Appendix A thereto. This material is not intended to be individually tailored to your needs or characteristics and should not be viewed as a “call to action” or suggestion that you enter into a swap or trading strategy involving a swap or any other transaction. Scotiabank may engage in transactions in a manner inconsistent with the views discussed this report and may have positions, or be in the process of acquiring or disposing of positions, referred to in this report.
Scotiabank, its affiliates and any of their respective officers, directors and employees may from time to time take positions in currencies, act as managers, co-managers or underwriters of a public offering or act as principals or agents, deal in, own or act as market makers or advisors, brokers or commercial and/or investment bankers in relation to securities or related derivatives. As a result of these actions, Scotiabank may receive remuneration. All Scotiabank products and services are subject to the terms of applicable agreements and local regulations. Officers, directors and employees of Scotiabank and its affiliates may serve as directors of corporations.
Any securities discussed in this report may not be suitable for all investors. Scotiabank recommends that investors independently evaluate any issuer and security discussed in this report, and consult with any advisors they deem necessary prior to making any investment.
This report and all information, opinions and conclusions contained in it are protected by copyright. This information may not be reproduced without the prior express written consent of Scotiabank.
™ Trademark of The Bank of Nova Scotia. Used under license, where applicable.
Scotiabank, together with “Global Banking and Markets”, is a marketing name for the global corporate and investment banking and capital markets businesses of The Bank of Nova Scotia and certain of its affiliates in the countries where they operate, including; Scotiabank Europe plc; Scotiabank (Ireland) Designated Activity Company; Scotiabank Inverlat S.A., Institución de Banca Múltiple, Grupo Financiero Scotiabank Inverlat, Scotia Inverlat Casa de Bolsa, S.A. de C.V., Grupo Financiero Scotiabank Inverlat, Scotia Inverlat Derivados S.A. de C.V. – all members of the Scotiabank group and authorized users of the Scotiabank mark. The Bank of Nova Scotia is incorporated in Canada with limited liability and is authorised and regulated by the Office of the Superintendent of Financial Institutions Canada. The Bank of Nova Scotia is authorized by the UK Prudential Regulation Authority and is subject to regulation by the UK Financial Conduct Authority and limited regulation by the UK Prudential Regulation Authority. Details about the extent of The Bank of Nova Scotia's regulation by the UK Prudential Regulation Authority are available from us on request. Scotiabank Europe plc is authorized by the UK Prudential Regulation Authority and regulated by the UK Financial Conduct Authority and the UK Prudential Regulation Authority.
Scotiabank Inverlat, S.A., Scotia Inverlat Casa de Bolsa, S.A. de C.V, Grupo Financiero Scotiabank Inverlat, and Scotia Inverlat Derivados, S.A. de C.V., are each authorized and regulated by the Mexican financial authorities.
Not all products and services are offered in all jurisdictions. Services described are available in jurisdictions where permitted by law.