- US job growth remains highly resilient
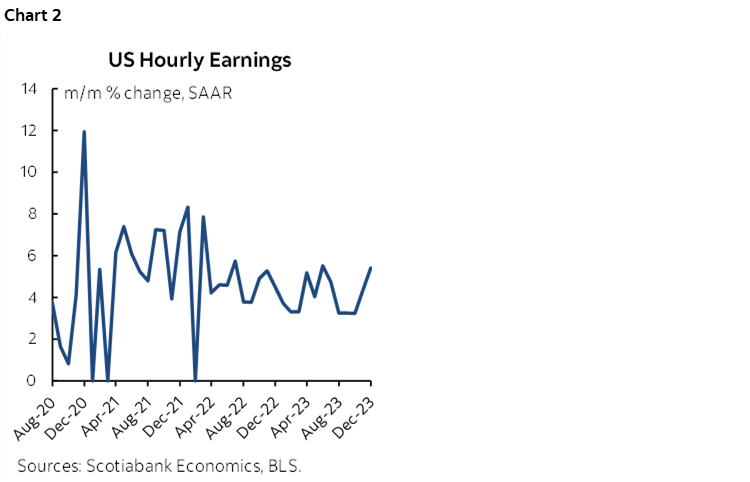
- Wage growth is accelerating
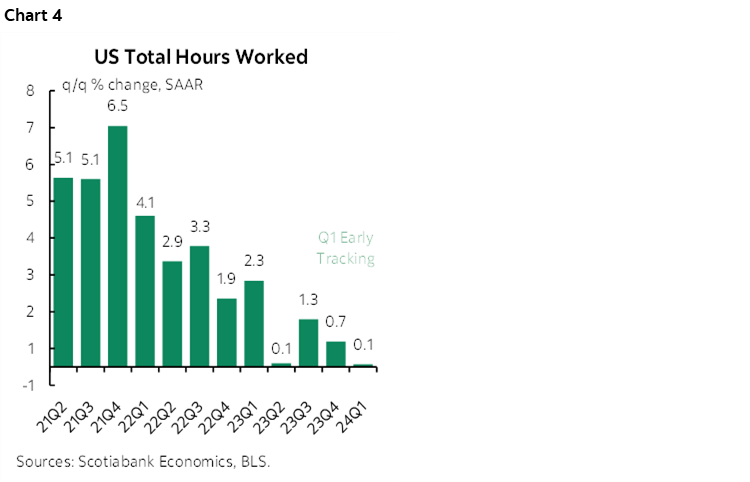
- Hours worked point to soft GDP unless productivity growth remains strong
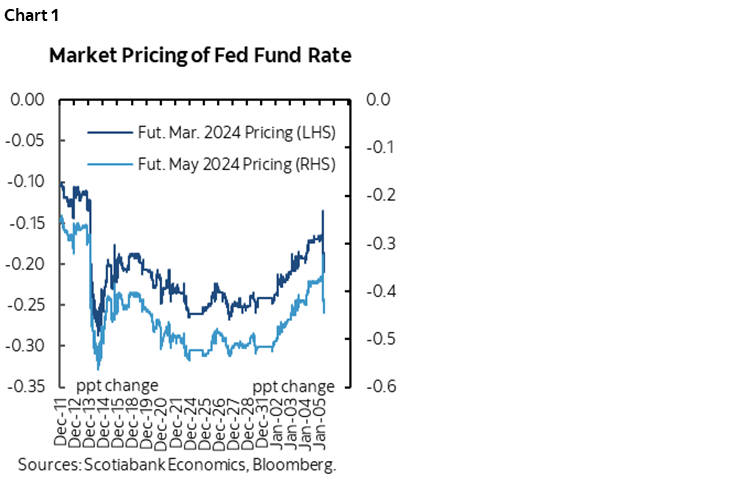
- Markets scaled back Fed cut pricing until ISM-services disappointed...
- ...but ISM’s data quality may be questioned by its misleading jobs signal
- Nonfarm payrolls, m/m 000s // UR %, Dec, SA:
- Actual: 216 / 3.7
- Scotia: 200 / 3.8
- Consensus: 175 / 3.8
- Prior: 173 / 3.7 (unchanged)
The US created 216k jobs last month which was only modestly above expectations especially considering confidence bands around the estimates. Wages accelerated and have posted the strongest back-to-back gains since July.
Markets initially responded by scaling back cut pricing even further (chart 1) until ISM-services disappointed at 10amET (50.6 from 52.7). As a caution toward ISM’s reliability, note that it said employment in the services sector contracted last month with an employment subindex that fell below 50 to 43.3 from 50.7, despite the gains noted below.
Wage growth landed at 5.4% m/m at a seasonally adjusted and annualized rate (chart 2). Wage growth by this measure is accelerating from 3.2% in October to 4.3% in November and now 5.4%. This trend is why the year-over-year rate pushed higher to 4.1%.
By sector, job gains had significant breadth (chart 3). The private sector led the way with 164k more jobs created while government added 52k mostly at the state and local levels.
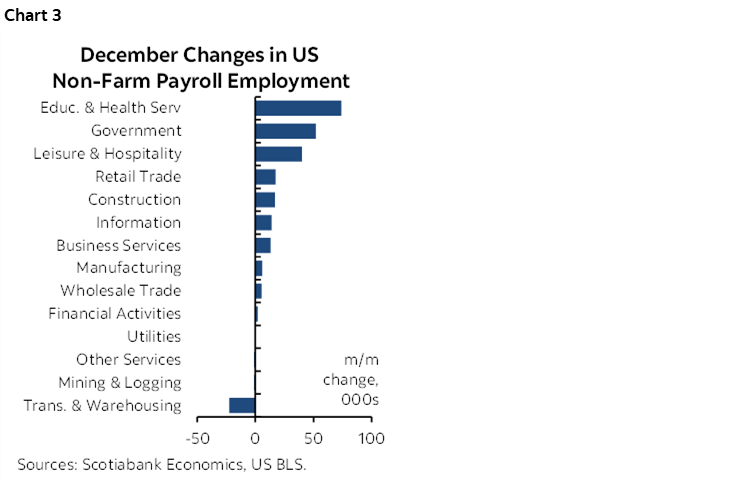
By sector, goods added 22k jobs and services add 142k. Within goods, construction was up 17k and manufacturing was up a little (6K). Within services, education and health led the way with a 74k gain followed by leisure and hospitality (+40k) and then retail trade (+17k), IT (14k) and professional/business services (13k) despite a 33k drop in temp help. The financial sector was flat (2k).
Aggregate hours worked fell 0.2% m/m but were up by a mild 0.7% q/q SAAR in Q4. There is no momentum baked in to Q1 hours worked based solely upon the hand-off effect as we await data on Q1 (chart 4). At the margin, unless productivity continues to surge, the waning trend in hours worked points toward a slowing GDP growth rate.
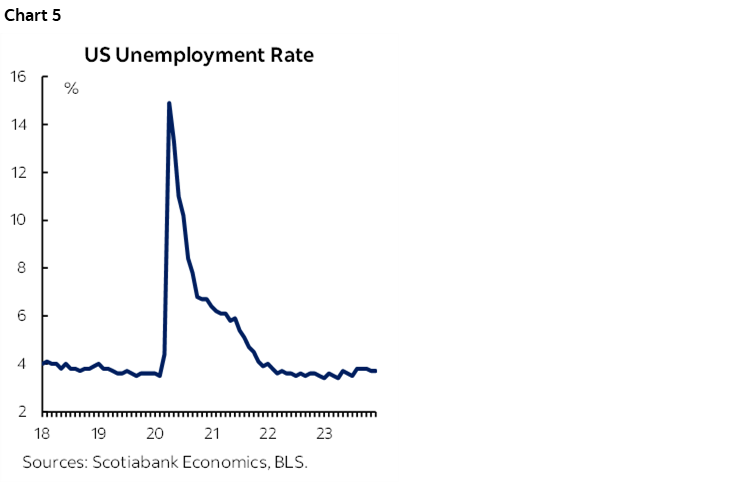
The unemployment rate held steady at 3.7% because it is derived from the household survey that registered a 683k drop in jobs offset by a 676k drop in the size of the labour force that cancelled each other out (chart 5).
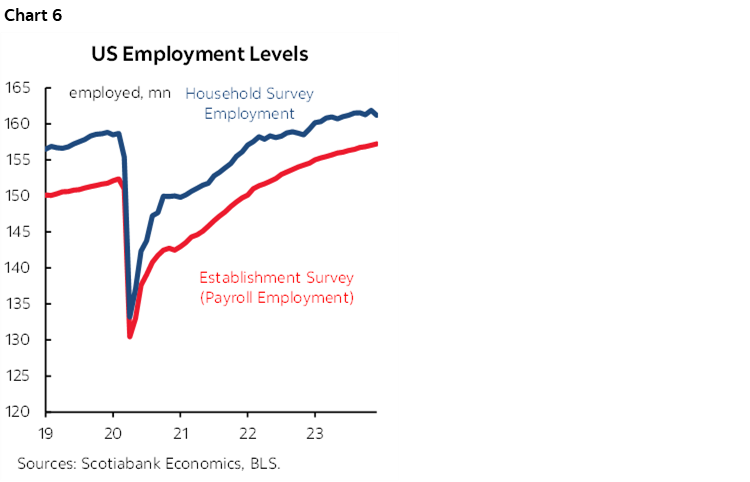
So what is the household survey telling us? Always be cautious given that there is a lot more statistical noise to the household survey than payrolls. The 90% confidence interval for the change in unemployment in the household survey is +/-300k versus the 90% confidence interval for changes in nonfarm payrolls of +/-130k. The household survey is extraordinarily volatile as evidenced by the fact that just the prior month registered a gain of 586k jobs. Another difference is that the household survey also captures unincorporated businesses lacking formal payrolls, but again, the noise factor makes it hard to tell what’s really going on. Regardless, over time, the nonfarm (establishment) and household surveys tend to align (chart 6).
DISCLAIMER
This report has been prepared by Scotiabank Economics as a resource for the clients of Scotiabank. Opinions, estimates and projections contained herein are our own as of the date hereof and are subject to change without notice. The information and opinions contained herein have been compiled or arrived at from sources believed reliable but no representation or warranty, express or implied, is made as to their accuracy or completeness. Neither Scotiabank nor any of its officers, directors, partners, employees or affiliates accepts any liability whatsoever for any direct or consequential loss arising from any use of this report or its contents.
These reports are provided to you for informational purposes only. This report is not, and is not constructed as, an offer to sell or solicitation of any offer to buy any financial instrument, nor shall this report be construed as an opinion as to whether you should enter into any swap or trading strategy involving a swap or any other transaction. The information contained in this report is not intended to be, and does not constitute, a recommendation of a swap or trading strategy involving a swap within the meaning of U.S. Commodity Futures Trading Commission Regulation 23.434 and Appendix A thereto. This material is not intended to be individually tailored to your needs or characteristics and should not be viewed as a “call to action” or suggestion that you enter into a swap or trading strategy involving a swap or any other transaction. Scotiabank may engage in transactions in a manner inconsistent with the views discussed this report and may have positions, or be in the process of acquiring or disposing of positions, referred to in this report.
Scotiabank, its affiliates and any of their respective officers, directors and employees may from time to time take positions in currencies, act as managers, co-managers or underwriters of a public offering or act as principals or agents, deal in, own or act as market makers or advisors, brokers or commercial and/or investment bankers in relation to securities or related derivatives. As a result of these actions, Scotiabank may receive remuneration. All Scotiabank products and services are subject to the terms of applicable agreements and local regulations. Officers, directors and employees of Scotiabank and its affiliates may serve as directors of corporations.
Any securities discussed in this report may not be suitable for all investors. Scotiabank recommends that investors independently evaluate any issuer and security discussed in this report, and consult with any advisors they deem necessary prior to making any investment.
This report and all information, opinions and conclusions contained in it are protected by copyright. This information may not be reproduced without the prior express written consent of Scotiabank.
™ Trademark of The Bank of Nova Scotia. Used under license, where applicable.
Scotiabank, together with “Global Banking and Markets”, is a marketing name for the global corporate and investment banking and capital markets businesses of The Bank of Nova Scotia and certain of its affiliates in the countries where they operate, including; Scotiabank Europe plc; Scotiabank (Ireland) Designated Activity Company; Scotiabank Inverlat S.A., Institución de Banca Múltiple, Grupo Financiero Scotiabank Inverlat, Scotia Inverlat Casa de Bolsa, S.A. de C.V., Grupo Financiero Scotiabank Inverlat, Scotia Inverlat Derivados S.A. de C.V. – all members of the Scotiabank group and authorized users of the Scotiabank mark. The Bank of Nova Scotia is incorporated in Canada with limited liability and is authorised and regulated by the Office of the Superintendent of Financial Institutions Canada. The Bank of Nova Scotia is authorized by the UK Prudential Regulation Authority and is subject to regulation by the UK Financial Conduct Authority and limited regulation by the UK Prudential Regulation Authority. Details about the extent of The Bank of Nova Scotia's regulation by the UK Prudential Regulation Authority are available from us on request. Scotiabank Europe plc is authorized by the UK Prudential Regulation Authority and regulated by the UK Financial Conduct Authority and the UK Prudential Regulation Authority.
Scotiabank Inverlat, S.A., Scotia Inverlat Casa de Bolsa, S.A. de C.V, Grupo Financiero Scotiabank Inverlat, and Scotia Inverlat Derivados, S.A. de C.V., are each authorized and regulated by the Mexican financial authorities.
Not all products and services are offered in all jurisdictions. Services described are available in jurisdictions where permitted by law.