- Core CPI remains firm, adding to the case for +25bps
- The broader cases for and against a hike...
- ...and how there is much more market risk to a pause than reward to a hike
- CDN CPI, m/m % NSA // y/y %, Dec:
- Actual: -0.6 / 6.3
- Scotia: -0.7 / 6.2
- Consensus: -0.5 / 6.4
- Prior: 0.1 / 6.8
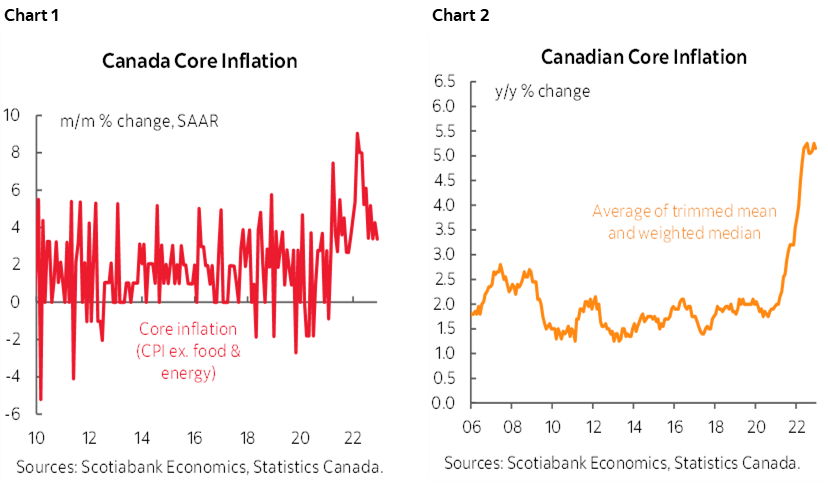
- CDN core CPI, m/m % SA ex-f&e, Dec: 0.3
- CDN avg median/trimmed mean CPI: 5.2 (prior 5.3% revised up from 5.2%)
KEY TAKEAWAY
Core inflation at 0.3% m/m SA and 3.4% m/m SA annualized coupled with high breadth reinforces the case for another 25bps hike next week in my opinion. Traditional core CPI (ie: ex-food and energy) was up by 0.3% m/m or 3.4% m/m SAAR. Other measures of core were also firm including CPIX (3.3% m/m SAAR), CPI-ex-eight at the more modest 2.4% m/m SAAR rate, and the average of the BoC’s trimmed mean and weighted median gauges that were firm at 5.2% y/y with a slight upward revision to the prior month’s estimate that is now at 5.3%. The case for hiking by 25bps outweighs the case for pausing in my view, but both cases will be presented below after offering an opinion on the market risks around the call.
ALL RISK, VERY LITTLE REWARD
But I would advise market participants and funding operations to play it safer. They would be little rewarded beyond puerile bragging rights if the BoC hikes 25bps, but potentially get their heads handed to them if the BoC pauses and thus start the calendar year behind the eight ball on their performance. I’m more concerned about the risk to a pause than the reward to adding a few more points to what is an almost entirely priced hike.
The reason for this market perspective is that a somewhat erratic central bank that has (unwisely imo) surprised market participants three times in eight meetings over the past year after a wild ride when they blew it in 2021 could easily pick whatever it wants from the arguments and surprise markets again, but this time do so with an unexpected pause. If they hike, so what, add a few basis points to what isn’t priced already pending developments up to game day. The only way I can see further material upside to multi-contract hike pricing out of this decision would be if the BoC sounded like they were significantly leaning toward another hike after hiking next week. They are probably loathe to do so, as evidenced by the could-might-maybe guidance they provided through communications in December.
But if they do pause, then markets would not only take out the priced hike in terms of what it means to, say, 2-year and 5-year GoC yields, but would also probably have their ‘gotcha’ moment. That could be expressed as piling into the front-end on the first sign of a wavering central bank that’s signalling the end of the hike cycle and by raising the probability and magnitude of cut pricing later in the year. I don’t think that risk should be courted by the central bank, but there have been times when the BoC does not necessarily consider the market implications in my view.
Before turning to the CPI details I’ll break down the case for and against a hike.
WHY HIKE?
1. If they pause, then they would perhaps unwittingly ease financial conditions even further. The 5-year GoC yield is 85bps below the October peak. Markets being markets would have a ‘gotcha’ moment and raise the probability and magnitude of rate cuts. Inflation and housing could be back at it into 2024 with a more prolonged period of higher borrowing costs than if they stuck to tighter now. The endless talking heads that are advancing bearish Canadian housing narratives would then have to contend with easing mortgage rates to add to the fact there is no housing supply in Canada, the economy is more resilient than others and immigration is soaring with the fastest population growth of any major peer group economy.
2. Core inflation is holding firm at 0.3% m/m SA or 3.4% m/m at a seasonally adjusted and annualized rate. The job is not done in returning underlying inflationary pressures toward the BoC’s 2% headline target.
3. Nobody—and, if you’ll pardon my appeal to a Toronto audience, I mean noooooooobooodddyyy—believes the BoC will hit its 2% inflation target as we saw in yesterday’s business and consumer surveys (recap here). My long held view remains skewed toward regime change in favour of higher upward structural pressure upon inflation than in years past.
4. Canada's job market is absolutely defying gravity with accelerating job growth and there are more theories about how the job market could hold up better this time than in past hike cycles than consensus is discussing. Recap with those arguments here.
5. Canada’s Q4 GDP growth is tracking better than the BoC forecast in the October MPR when they forecast growth of 0.5% q/q SAAR Q4 growth versus around triple that now being tracked. Canada may be pushing further into excess demand, subject to a caveat that I’ll return to in the section on why not to hike.
6. The global growth backdrop has improved (less energy shock in Europe, upside to China over 2023). They may revise up growth projections for those regions in the MPR and that could translate a little more favourably into Canada including through commodities. That means more imported inflation through continued buoyancy in the terms of trade.
Why Not Hike?
1. It’s the BoC and frankly they always make me nervous. They’ve surprised markets three times in the past year with a priced whiff a year ago after Macklem teed it up the month before, a bigger than expected catch-up 100bps shocker in July after refusing to admit they weren’t behind, and then by hiking less than expected in October. Their forward guidance hasn’t been terribly useful throughout the pandemic anyway. They have not demonstrated they care about pricing or the implications of what they do from a financial market standpoint.
2. The BoC’s reaction function is pivoting toward being more focused upon lagging forward effects of their actions than, say, 6 months ago versus what just happened to the latest inflation print. Then again, the BoC would have to have extremely high confidence in its ability to forecast the lagging consequences of its hikes to date versus the many forecast failures it has made during the pandemic and mainly around what it expected to happen to inflation.
3. They could pick and choose whatever they wish from the CPI figures. Softening y/y headline and the soft m/m gauge alongside core CPI measures that are past their peak rates could motivate them to pause. Or they could look at core CPI and breadth and hike.
4. CAD is about 6 cents firmer than the weakest point in October. That negates their prior concern when USDCAD was climbing closer toward 1.40, although they never acted on it anyway. Plus, it's a chicken-and-egg thing as CAD is stronger partly because it expects them to hike. I wouldn’t necessarily rely upon assuming that the BoC connects the dots there and with good past reason for having this bias.
5. A key risk is whether they just fudge potential GDP again to make it fit their story. I say fudge because they’ve played with the numbers in the past and not always in a way that has sounded terribly convincing. Besides, nobody knows what potential GDP is anyway. A slightly credible way they could do this is to flag ripping population growth that raises noninflationary growth estimates over time. I’m not sure, however, that the immigration target changes over multiple years ahead are a massive change compared to what has been a number of years or rising targets that should have been embedded in forecasts gradually over the years.
DETAILS
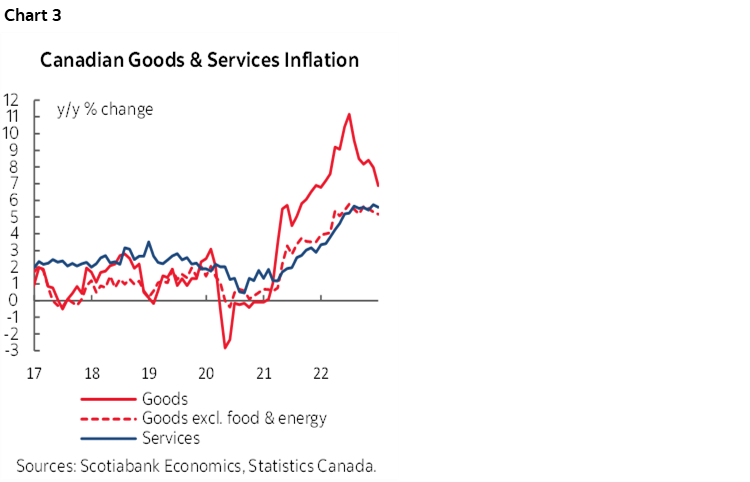
Chart 3 shows that services inflation remains highly resilient. Goods inflation continues to ease, primarily due to gasoline prices as goods CPI ex-food and energy is moving sideways.
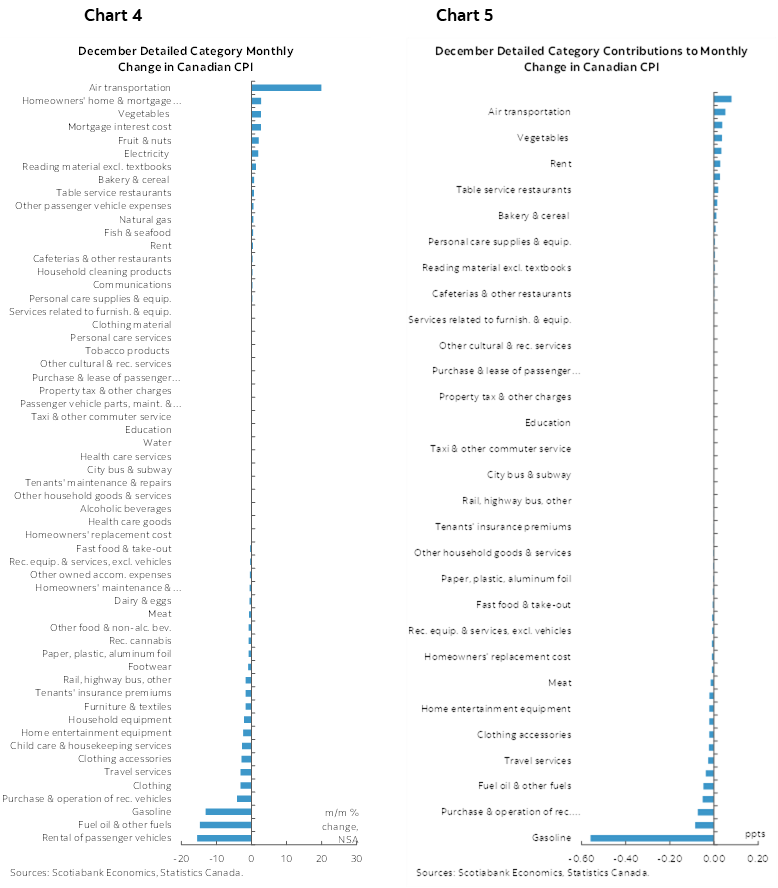
Charts 4 and 5 break down movements in the CPI basket in m/m NSA terms and in terms of weighted contributions to the change in CPI respectively.
Charts 6 and 7 do likewise for y/y rates and contributions.
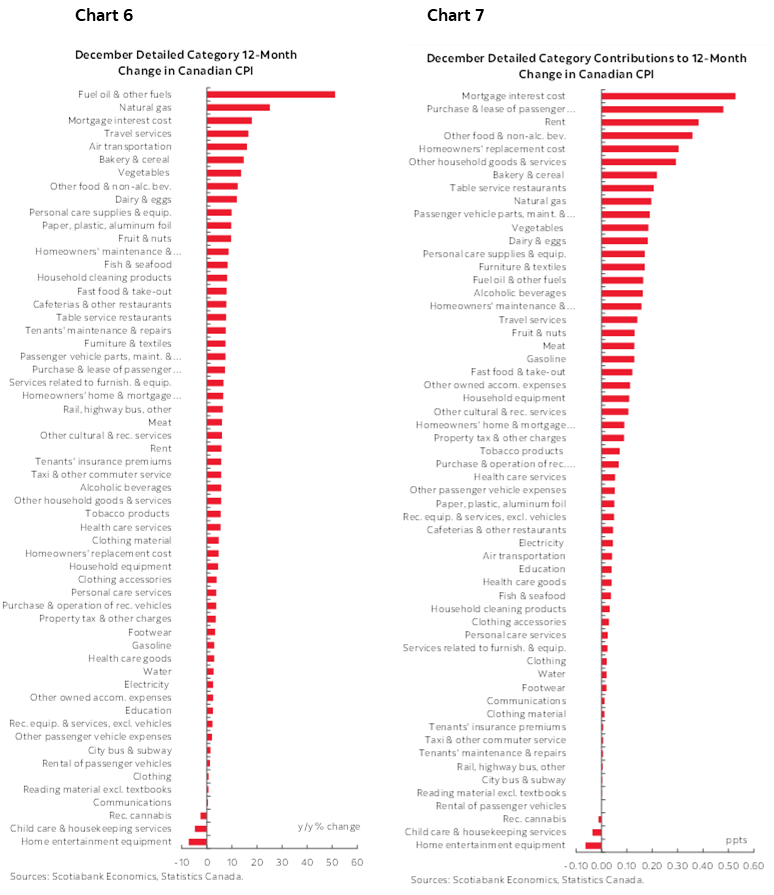
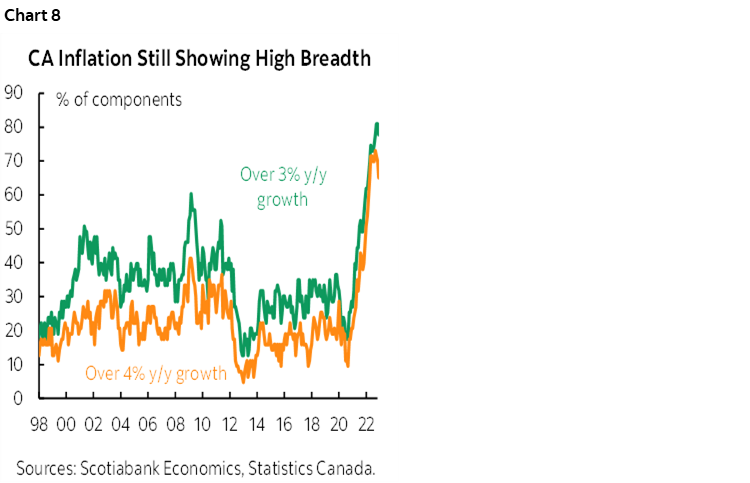
Chart 8 shows breadth. The vast majority of the CPI basket continues to rise at rates well above the BoC’s 2% inflation target. That counsels against cherry-picking individual components.
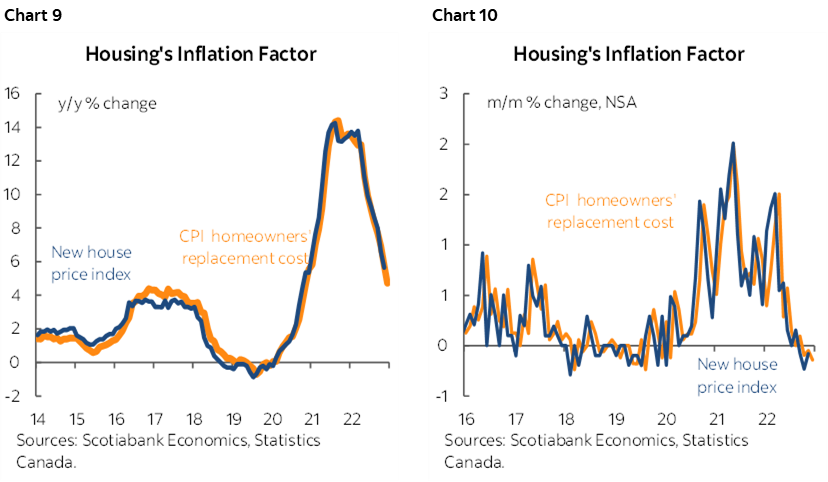
Charts 9 and 10 show housing’s direct influence as a negligible drag. Recall that Canada incorporates housing into CPI very differently from, say, the US. Canada uses homeowners’ replacement cost instead of OER. Replacement cost is driven by the house only component to the new house price index produced by Statcan and that curiously arrives after CPI. Replacement cost only carries a 6.5% weight in CPI on a –0.066 m/m % SA dip which is basically nothing. Housing’s drag effect on Canadian inflation is a fraction of what is likely to happen with lags to US CPI, though US PCE has half the weight attached to shelter compared to US CPI.
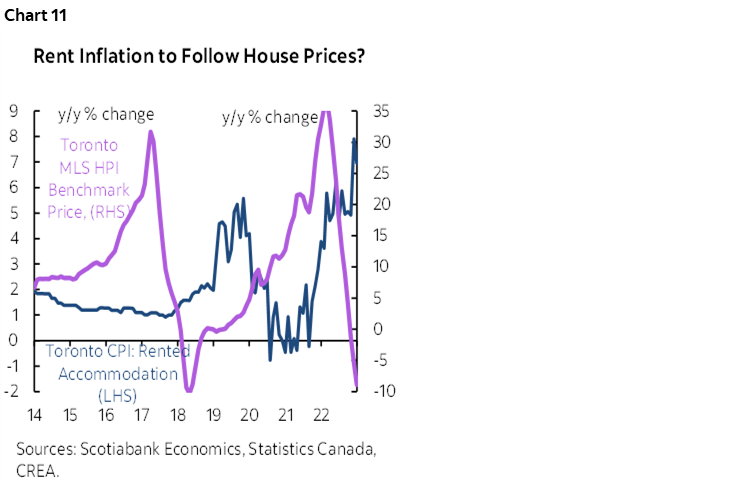
Rent inflation, however, remains hot (chart 11). At a 6.8% weight in the basket, however, the 1.2% m/m SA rise would only have added 0.1% to m/m SA total inflation with somewhat generous rounding up. That has multiple drivers worthy of inclusion such as housing affordability pressures when rent started to back up in 2021, the impact of higher borrowing costs especially in the back part of 2022, but the more powerful drivers may be depressed expectations for housing prices that limit ownership appetite and perhaps the concentrated impact of new immigrants into the rental and higher density housing markets.
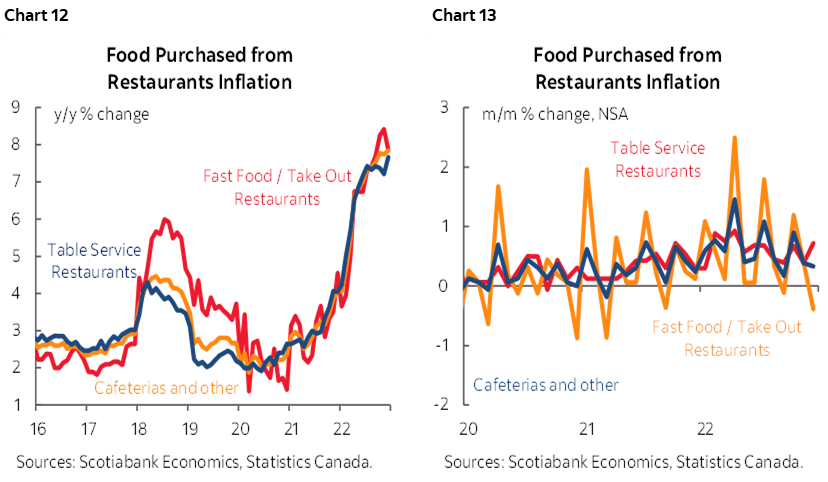
Food price inflation is shown in charts 12 and 13.
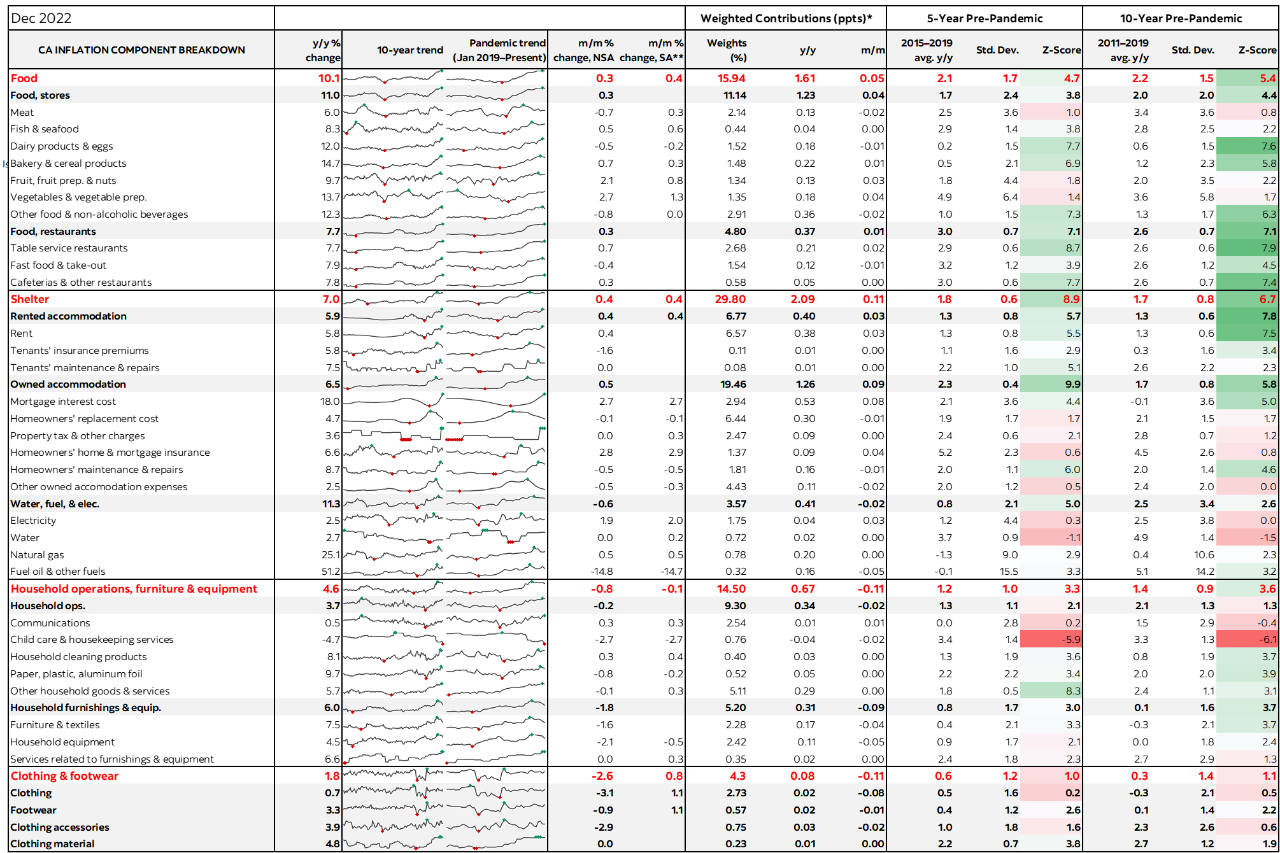
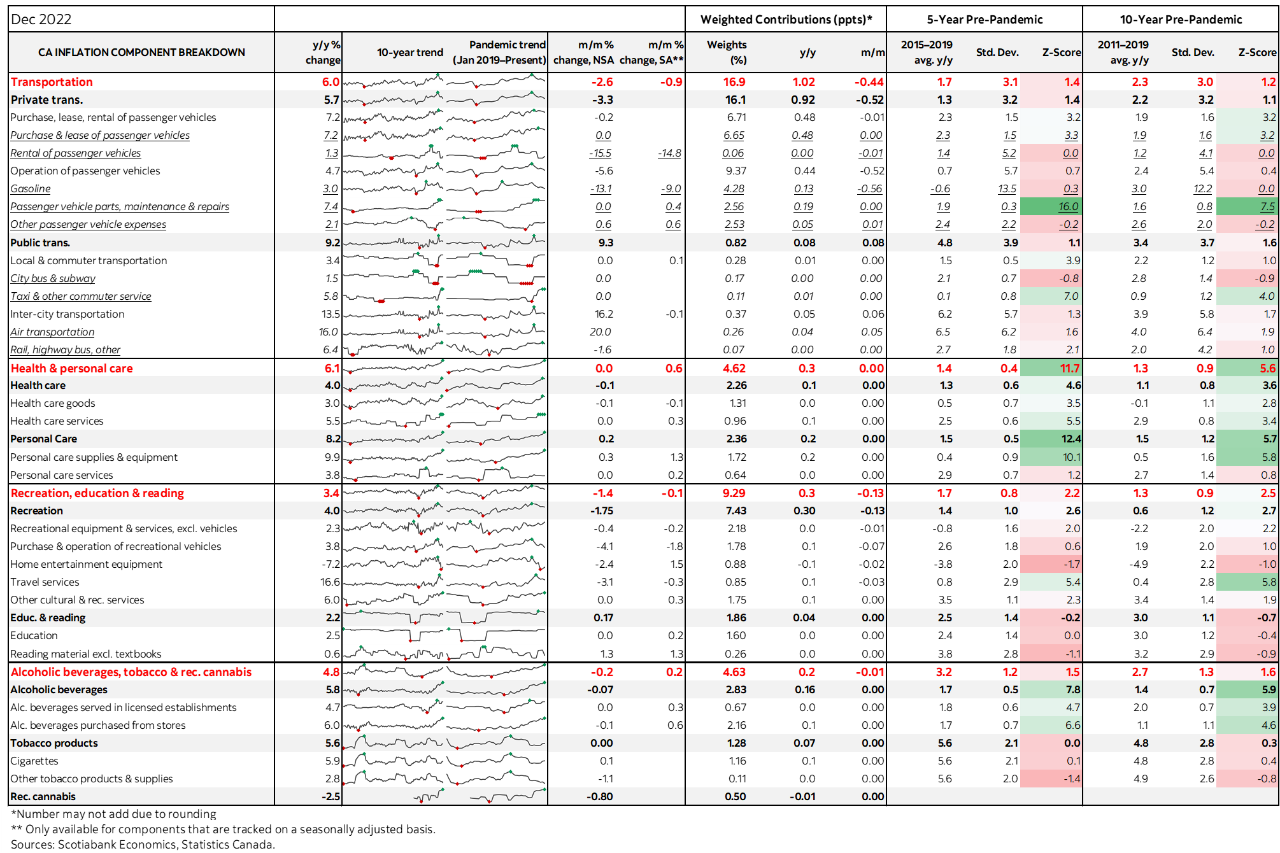
Please also see the accompanying table that provides greater detail on the CPI components including micro charts and z-score measures of dispersion from historical norms.
DISCLAIMER
This report has been prepared by Scotiabank Economics as a resource for the clients of Scotiabank. Opinions, estimates and projections contained herein are our own as of the date hereof and are subject to change without notice. The information and opinions contained herein have been compiled or arrived at from sources believed reliable but no representation or warranty, express or implied, is made as to their accuracy or completeness. Neither Scotiabank nor any of its officers, directors, partners, employees or affiliates accepts any liability whatsoever for any direct or consequential loss arising from any use of this report or its contents.
These reports are provided to you for informational purposes only. This report is not, and is not constructed as, an offer to sell or solicitation of any offer to buy any financial instrument, nor shall this report be construed as an opinion as to whether you should enter into any swap or trading strategy involving a swap or any other transaction. The information contained in this report is not intended to be, and does not constitute, a recommendation of a swap or trading strategy involving a swap within the meaning of U.S. Commodity Futures Trading Commission Regulation 23.434 and Appendix A thereto. This material is not intended to be individually tailored to your needs or characteristics and should not be viewed as a “call to action” or suggestion that you enter into a swap or trading strategy involving a swap or any other transaction. Scotiabank may engage in transactions in a manner inconsistent with the views discussed this report and may have positions, or be in the process of acquiring or disposing of positions, referred to in this report.
Scotiabank, its affiliates and any of their respective officers, directors and employees may from time to time take positions in currencies, act as managers, co-managers or underwriters of a public offering or act as principals or agents, deal in, own or act as market makers or advisors, brokers or commercial and/or investment bankers in relation to securities or related derivatives. As a result of these actions, Scotiabank may receive remuneration. All Scotiabank products and services are subject to the terms of applicable agreements and local regulations. Officers, directors and employees of Scotiabank and its affiliates may serve as directors of corporations.
Any securities discussed in this report may not be suitable for all investors. Scotiabank recommends that investors independently evaluate any issuer and security discussed in this report, and consult with any advisors they deem necessary prior to making any investment.
This report and all information, opinions and conclusions contained in it are protected by copyright. This information may not be reproduced without the prior express written consent of Scotiabank.
™ Trademark of The Bank of Nova Scotia. Used under license, where applicable.
Scotiabank, together with “Global Banking and Markets”, is a marketing name for the global corporate and investment banking and capital markets businesses of The Bank of Nova Scotia and certain of its affiliates in the countries where they operate, including; Scotiabank Europe plc; Scotiabank (Ireland) Designated Activity Company; Scotiabank Inverlat S.A., Institución de Banca Múltiple, Grupo Financiero Scotiabank Inverlat, Scotia Inverlat Casa de Bolsa, S.A. de C.V., Grupo Financiero Scotiabank Inverlat, Scotia Inverlat Derivados S.A. de C.V. – all members of the Scotiabank group and authorized users of the Scotiabank mark. The Bank of Nova Scotia is incorporated in Canada with limited liability and is authorised and regulated by the Office of the Superintendent of Financial Institutions Canada. The Bank of Nova Scotia is authorized by the UK Prudential Regulation Authority and is subject to regulation by the UK Financial Conduct Authority and limited regulation by the UK Prudential Regulation Authority. Details about the extent of The Bank of Nova Scotia's regulation by the UK Prudential Regulation Authority are available from us on request. Scotiabank Europe plc is authorized by the UK Prudential Regulation Authority and regulated by the UK Financial Conduct Authority and the UK Prudential Regulation Authority.
Scotiabank Inverlat, S.A., Scotia Inverlat Casa de Bolsa, S.A. de C.V, Grupo Financiero Scotiabank Inverlat, and Scotia Inverlat Derivados, S.A. de C.V., are each authorized and regulated by the Mexican financial authorities.
Not all products and services are offered in all jurisdictions. Services described are available in jurisdictions where permitted by law.