- Core inflation was marginally below consensus…
- ...as warm core services inflation was offset by flat core goods inflation
- The breadth of inflationary pressures picked up
- Outlier moves across so many components raise doubts after distorted November
- Markets continue to price the FOMC on hold this month
- US CPI / core CPI, m/m %, SA, December:
- Actual: 0.31 / 0.24
- Scotia: 0.3 / 0.3
- Consensus: 0.3 / 0.3
- Prior: NA due to shutdown
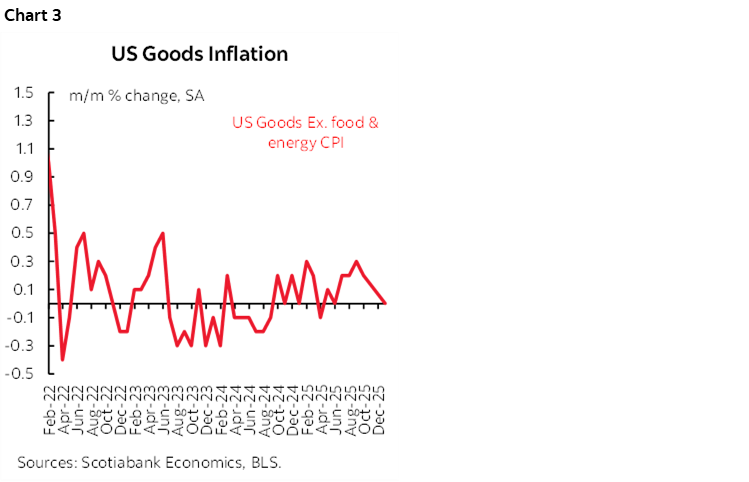
Questionable US inflation data came in very slightly beneath consensus at 0.24% m/m SA, or 2.9% m/m at a seasonally adjusted and annualized rate (chart 1 with cautions about absent prior data). The year-over-year rates were reasonably stable (chart 2).
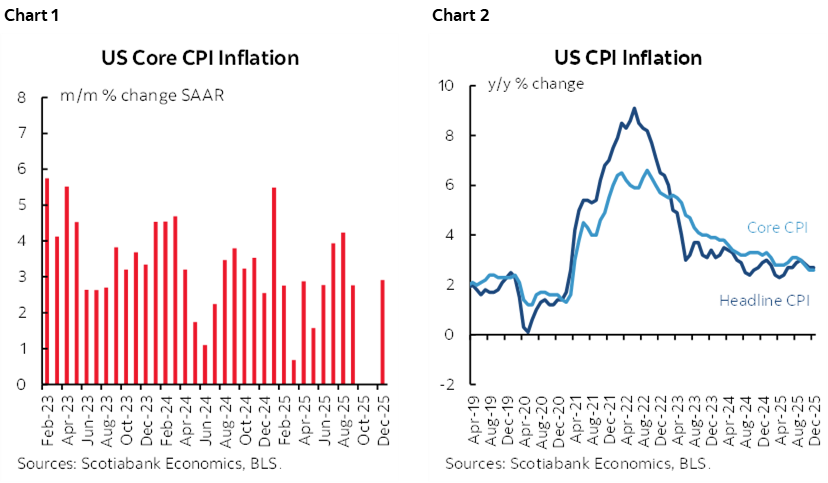
That six-one-hundredths of a percentage point undershoot relative to consensus expectations for core inflation prompted a knee-jerk initial rally in US 2s that then faded toward only a minor move lower once details were digested.
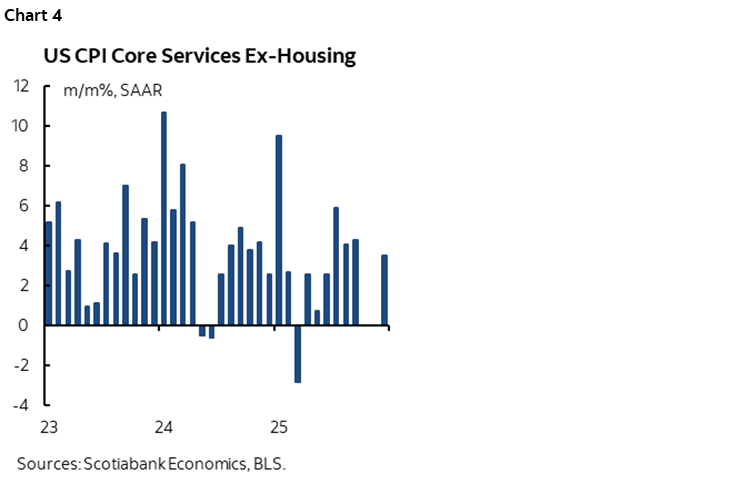
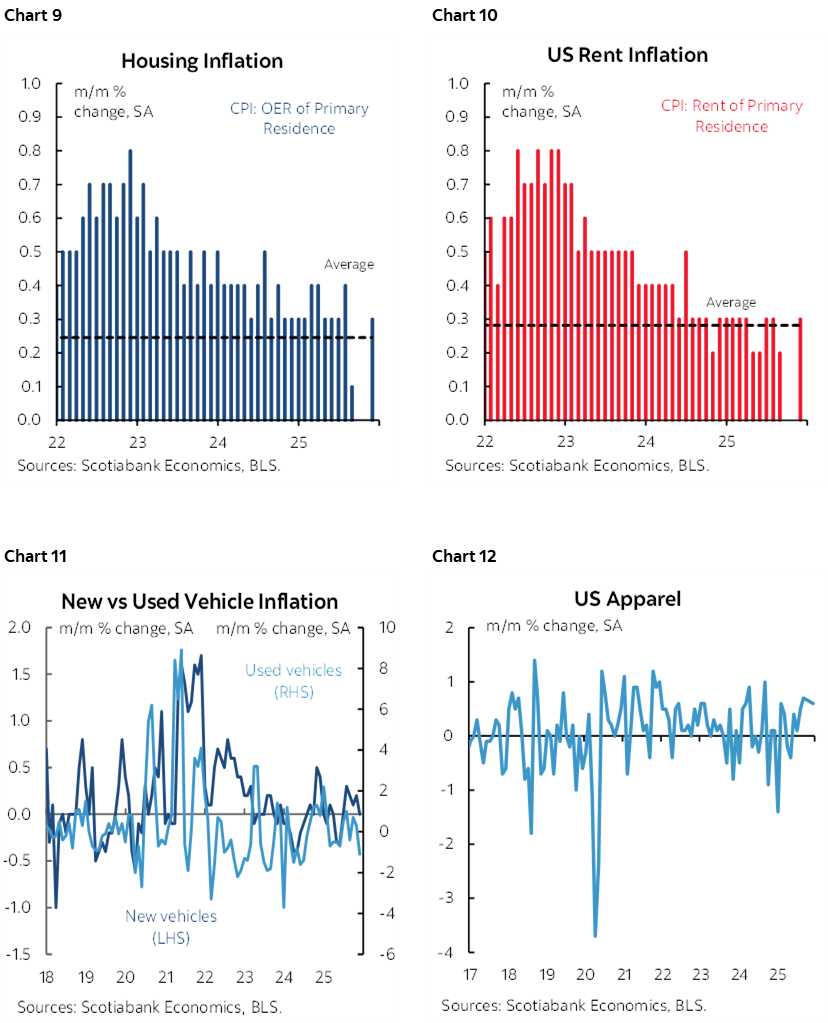
Core goods inflation collapsed to 0% m/m SAAR (chart 3). Categories like used vehicles (-1.1% m/m SA, or -12.6% m/m SAAR) contributed to this (new vehicle prices were flat at 0.2% m/m SAAR). So did multiple other goods categories that were soft, but with important offsets like apparel (+7.3% m/m SAAR).
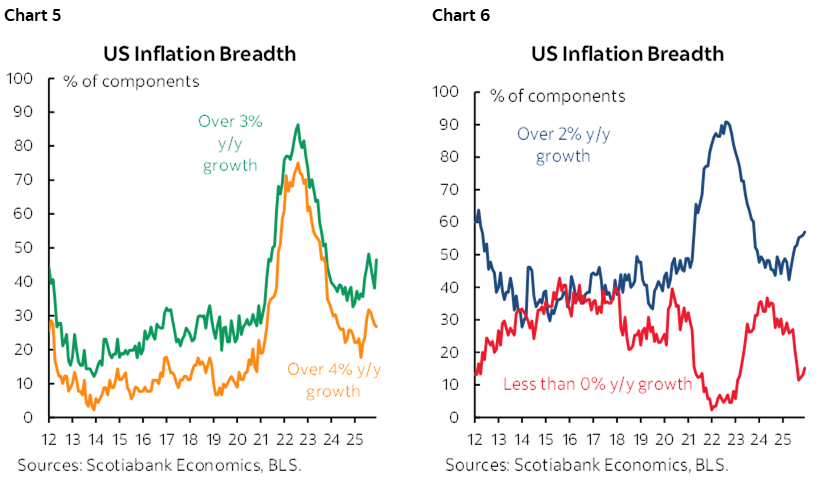
Core services inflation remained robust. Services CPI ex-housing services and ex-energy services was up by 0.29% m/m SA, or 3.5% m/m SAAR (chart 4).
Within services, hot areas were OER and primary rent, both up 0.3% m/m SA, or 3.8% m/m SAAR for OER and 3.2% m/m SAAR for primary rent. Fed Governor Miran’s housing disinflation narrative suffered a strong setback this time.
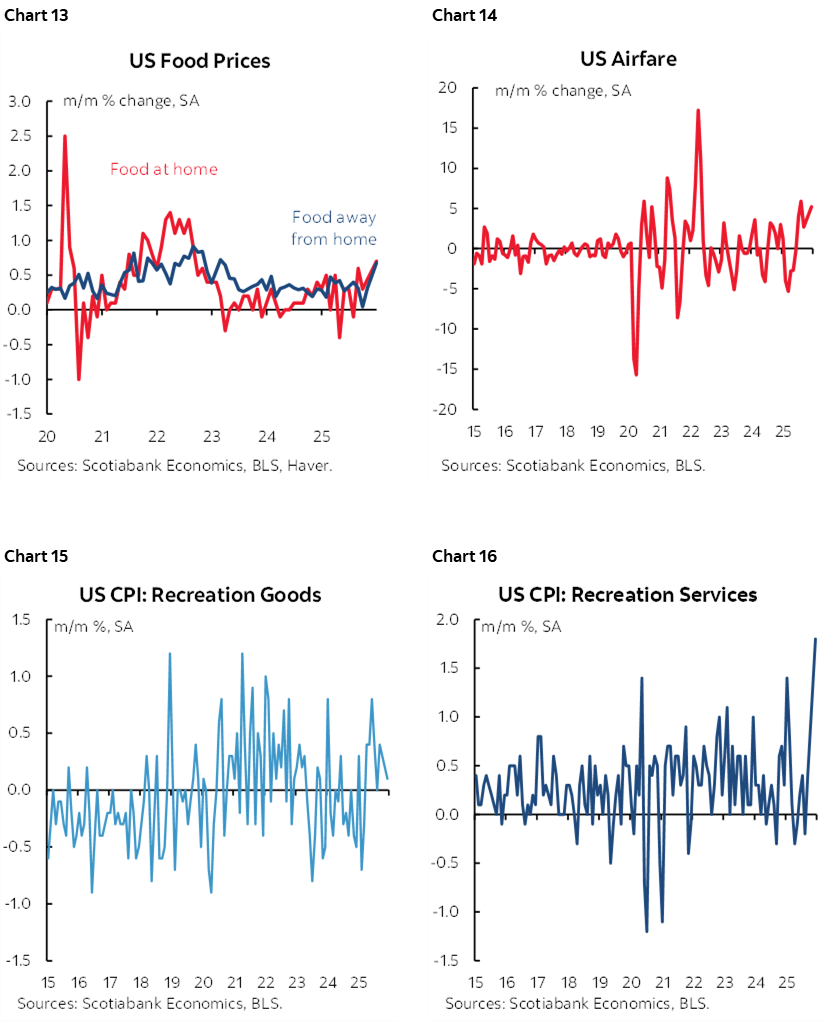
As for headline CPI, a contributing factor was that food prices were up 8.9% m/m SAAR with energy up 3.6% but not because of gasoline (-5.3%).
The breadth of inflationary pressures increased (charts 5, 6). The very large underlying movements—up and down—across many components support a case for treating the data with high suspicion. There is nothing in here that leads me to believe the FOMC would pivot more dovishly in favour of a January cut.
Some examples of outlier component moves include shelter components up between 4–5% m/m SAAR, apparel up 7.3%, used vehicles –12.6%, education and communications –11.2%, public transport up 70.2% (!), hospital and medical care categories up 4–5% and so on. I think there’s a wonky hand-off effect from November’s weakened data collection that is distorting components and driving weak trust in the data.
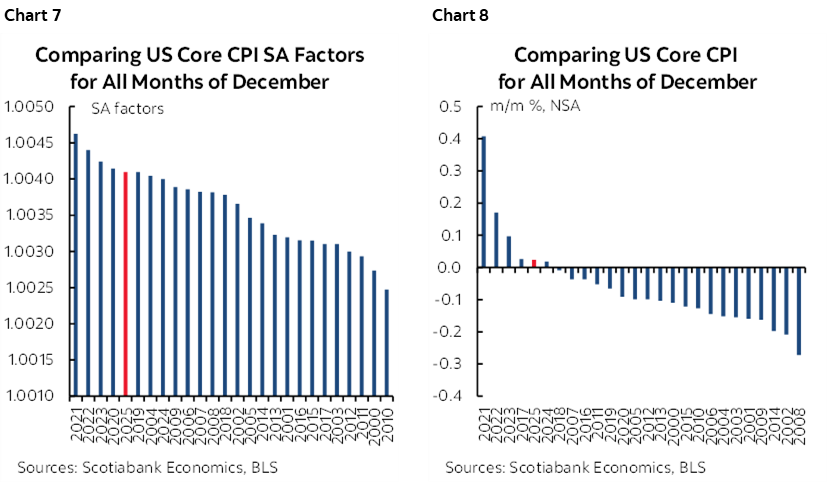
The pandemic era’s pattern of relatively high seasonal adjustment factors persisted (chart 7) which may have overstated the effects of little change in seasonally unadjusted core (chart 8).
The share of the basket estimated by alternative proxy methods will be released after 11amET. Recall that it has been running around record highs (see chart in my morning note).
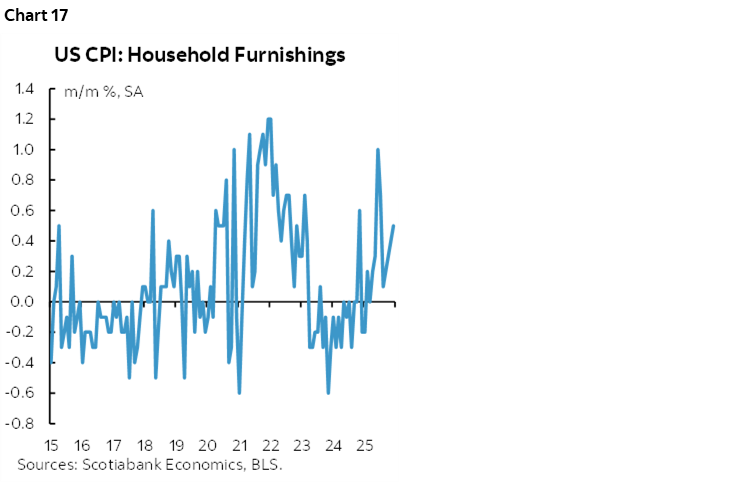
See charts 9–17 for more components.
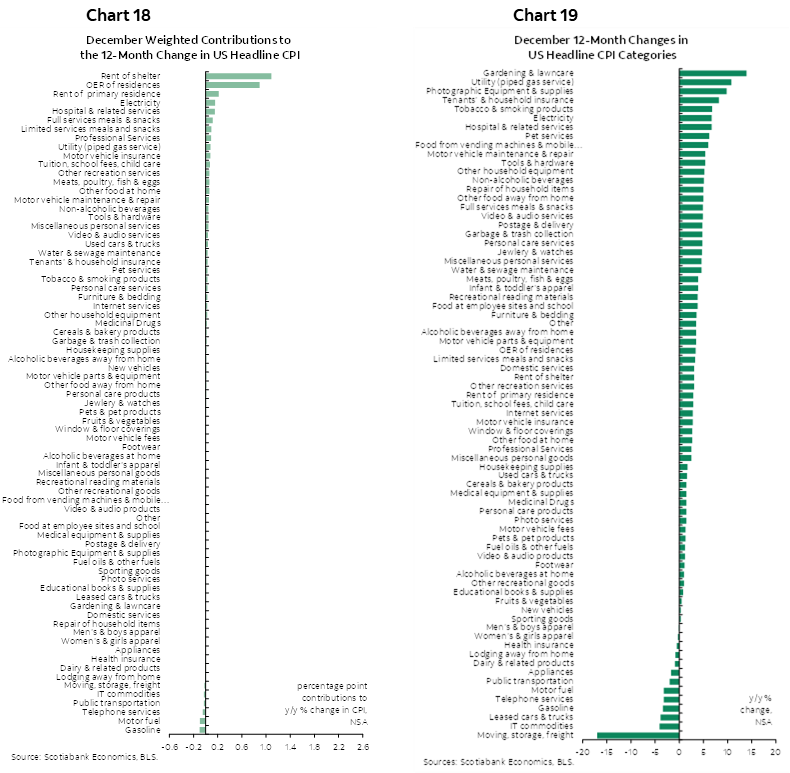
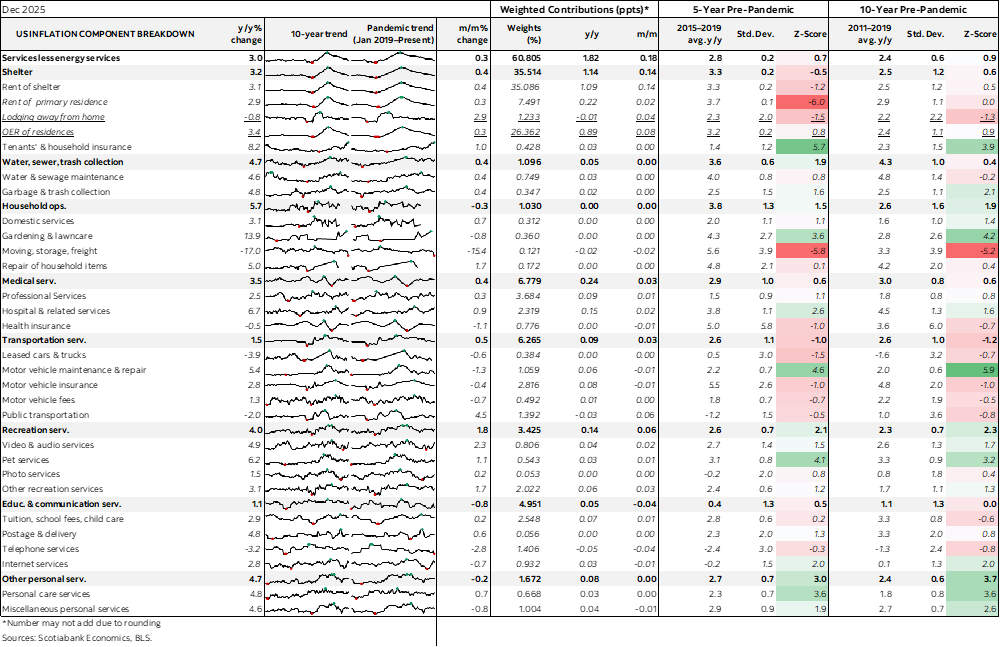
Charts 18–19 break down the basket in terms of y/y changes and weighted contributions to the overall y/y change in CPI.
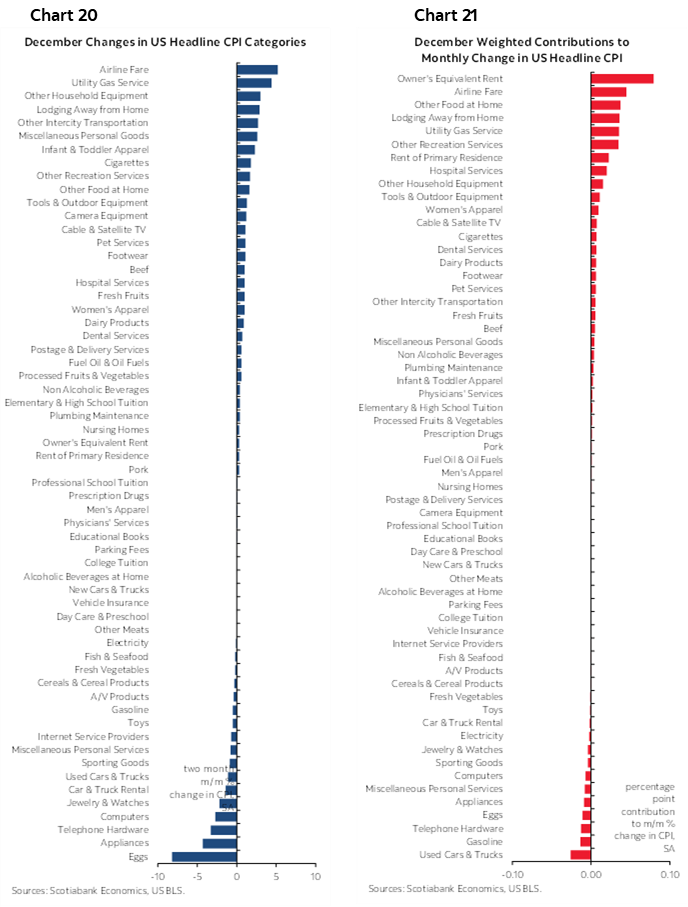
Charts 20–21 do likewise for the m/m changes.
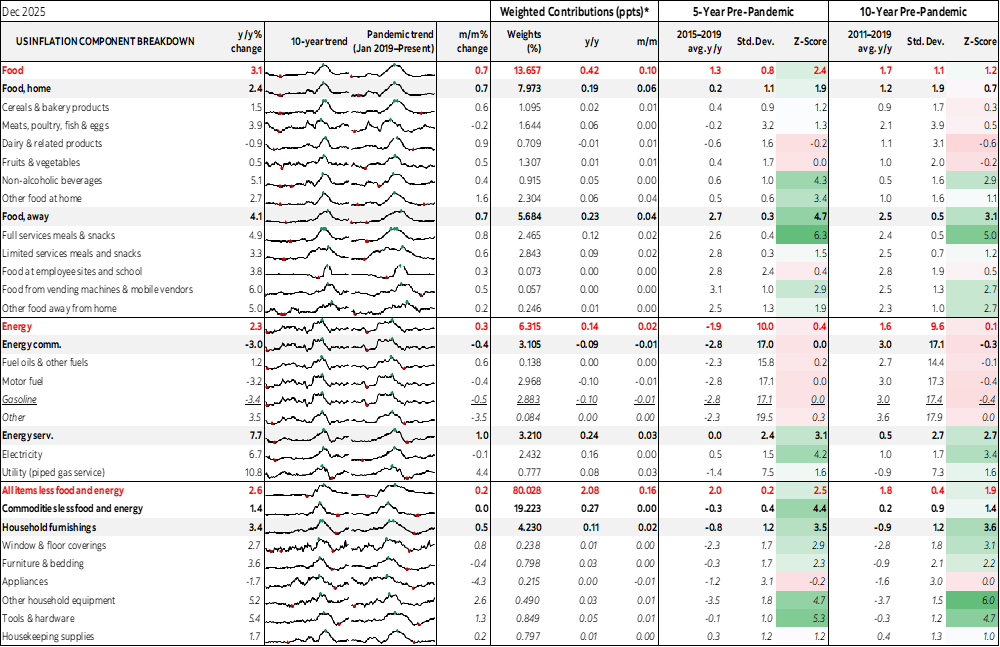
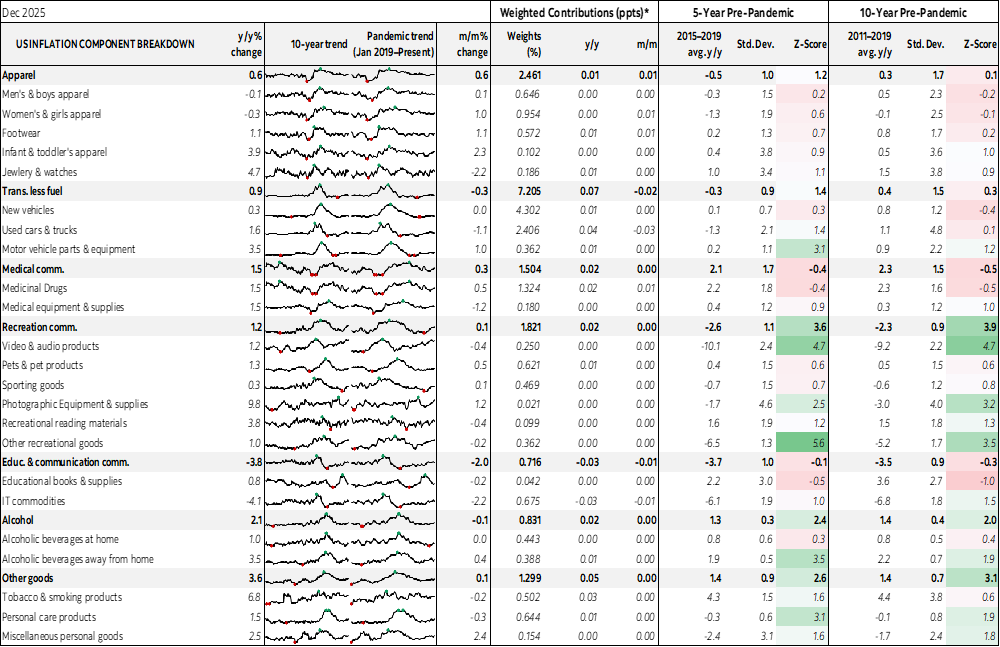
Also please see the accompanying table with more details.
DISCLAIMER
This report has been prepared by Scotiabank Economics as a resource for the clients of Scotiabank. Opinions, estimates and projections contained herein are our own as of the date hereof and are subject to change without notice. The information and opinions contained herein have been compiled or arrived at from sources believed reliable but no representation or warranty, express or implied, is made as to their accuracy or completeness. Neither Scotiabank nor any of its officers, directors, partners, employees or affiliates accepts any liability whatsoever for any direct or consequential loss arising from any use of this report or its contents.
These reports are provided to you for informational purposes only. This report is not, and is not constructed as, an offer to sell or solicitation of any offer to buy any financial instrument, nor shall this report be construed as an opinion as to whether you should enter into any swap or trading strategy involving a swap or any other transaction. The information contained in this report is not intended to be, and does not constitute, a recommendation of a swap or trading strategy involving a swap within the meaning of U.S. Commodity Futures Trading Commission Regulation 23.434 and Appendix A thereto. This material is not intended to be individually tailored to your needs or characteristics and should not be viewed as a “call to action” or suggestion that you enter into a swap or trading strategy involving a swap or any other transaction. Scotiabank may engage in transactions in a manner inconsistent with the views discussed this report and may have positions, or be in the process of acquiring or disposing of positions, referred to in this report.
Scotiabank, its affiliates and any of their respective officers, directors and employees may from time to time take positions in currencies, act as managers, co-managers or underwriters of a public offering or act as principals or agents, deal in, own or act as market makers or advisors, brokers or commercial and/or investment bankers in relation to securities or related derivatives. As a result of these actions, Scotiabank may receive remuneration. All Scotiabank products and services are subject to the terms of applicable agreements and local regulations. Officers, directors and employees of Scotiabank and its affiliates may serve as directors of corporations.
Any securities discussed in this report may not be suitable for all investors. Scotiabank recommends that investors independently evaluate any issuer and security discussed in this report, and consult with any advisors they deem necessary prior to making any investment.
This report and all information, opinions and conclusions contained in it are protected by copyright. This information may not be reproduced without the prior express written consent of Scotiabank.
™ Trademark of The Bank of Nova Scotia. Used under license, where applicable.
Scotiabank, together with “Global Banking and Markets”, is a marketing name for the global corporate and investment banking and capital markets businesses of The Bank of Nova Scotia and certain of its affiliates in the countries where they operate, including; Scotiabank Europe plc; Scotiabank (Ireland) Designated Activity Company; Scotiabank Inverlat S.A., Institución de Banca Múltiple, Grupo Financiero Scotiabank Inverlat, Scotia Inverlat Casa de Bolsa, S.A. de C.V., Grupo Financiero Scotiabank Inverlat, Scotia Inverlat Derivados S.A. de C.V. – all members of the Scotiabank group and authorized users of the Scotiabank mark. The Bank of Nova Scotia is incorporated in Canada with limited liability and is authorised and regulated by the Office of the Superintendent of Financial Institutions Canada. The Bank of Nova Scotia is authorized by the UK Prudential Regulation Authority and is subject to regulation by the UK Financial Conduct Authority and limited regulation by the UK Prudential Regulation Authority. Details about the extent of The Bank of Nova Scotia's regulation by the UK Prudential Regulation Authority are available from us on request. Scotiabank Europe plc is authorized by the UK Prudential Regulation Authority and regulated by the UK Financial Conduct Authority and the UK Prudential Regulation Authority.
Scotiabank Inverlat, S.A., Scotia Inverlat Casa de Bolsa, S.A. de C.V, Grupo Financiero Scotiabank Inverlat, and Scotia Inverlat Derivados, S.A. de C.V., are each authorized and regulated by the Mexican financial authorities.
Not all products and services are offered in all jurisdictions. Services described are available in jurisdictions where permitted by law.