- Feared US core CPI revisions turned out to be a non-event
- Canada added 37k jobs with good enough details...
- ...that point toward a solid rebound in GDP growth
- Canada employment m/m 000s // UR %, SA, January:
- Actual: 37.3 / 5.7
- Scotia: 20 / 5.9
- Consensus: 15 / 5.9
- Prior: 6.8 / 5.8 (previously revised on Jan 29th from 0 / 5.8)
Canada’s job market remains resilient and is pointing toward a decent rebound in the economy while US CPI revisions were a non-event. As you were. Nothing much has changed to our underlying narratives in either country.
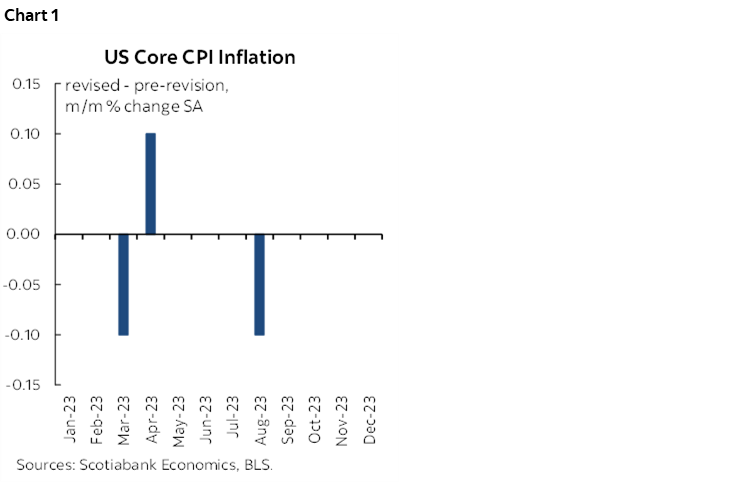
NO MATERIAL REVISIONS TO US CORE CPI
Let’s get the US CPI revisions out of the way first. The disinflationary pattern in core CPI over the final months of 2023 was left unchanged. Each of the months of September through December did not change the m/m SA estimates for core CPI. Chart 1 depicts this. Talk about overhyped going in. The picture for the Fed has not changed one bit here; core inflation has been soft of late, but future doubts remain. The economy is strong, so is the job market, capacity pressures remain, upside risks to inflation include monitoring supply chains and shipping costs plus whether wage growth will be paid for by productivity growth. The core issue of whether core goods disinflation is maturing while core services inflation is resilient remains an ongoing forward-looking uncertainty.
CANADA’S JOBS MARKET ISN’T SLOWING DOWN YET
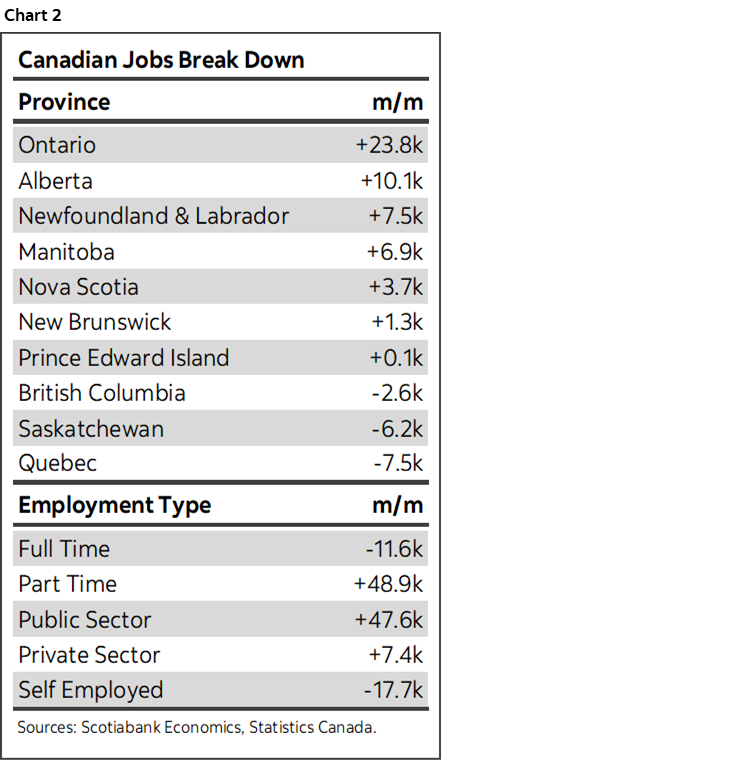
Slowing, eh? Moose droppings on that! Canada just added another 37k jobs last month after the prior month was revised up to a small gain of 7k following earlier seasonal adjustment revisions. Some details are shown in chart 2. The overall details were somewhat mixed but generally solid enough to make me happy enough for now and for the BoC to check the box and move on.
Canada has created 345k jobs on a January-over-January basis in the past year. The past six months have witnessed the creation of 194k jobs in seasonally adjusted terms. The past three months have created almost 70k jobs SA. The six-month and three-month annualized gains are basically the same as the full year gain. There is not aggregate evidence of slowing job growth.
All of the gain in January was in payroll positions that were up by 55k. That was mostly in the public sector that gained 48k with private sector payrolls up by about 7k.
All of the gain was in part-time positions +48.9k as full-time jobs fell by about 12k. The definitional dividing line is set at 30 hours per week.
Self-employed positions fell again, this time by about 18k. That dented the headline, but treat it carefully as usual since there is more statistical noise around that category than overall.
By sector (chart 3), the gain was driven by services that added 60k to offset a 23k drop in goods sector hiring. Within goods, the drop was spread fairly evenly across manufacturing, construction, utilities, agriculture and resources.
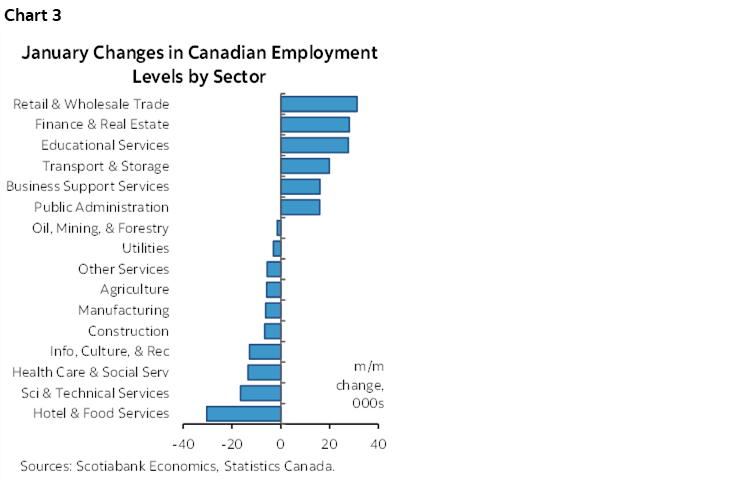
Within services, the gain had significant breadth and was led by wholesale/retail, finance/insurance/real estate, educational services, transportation and warehousing, public administration and business, building and other support services.
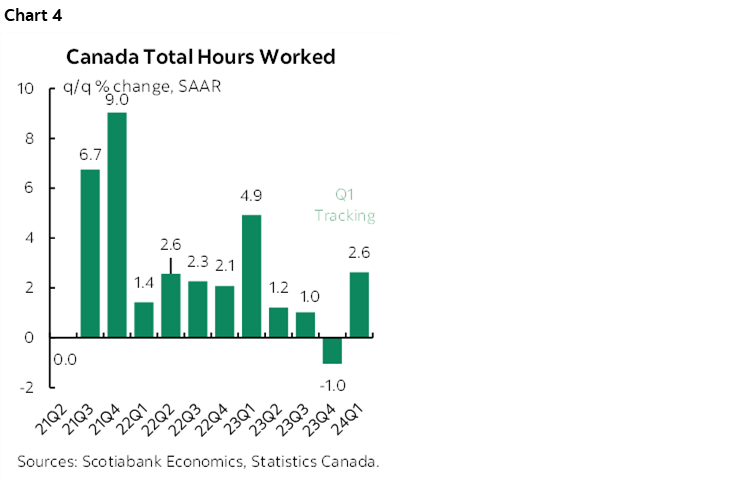
Hours worked were up by 0.6% m/m SA and only got marginal help from a slight downward revision to December’s hours worked that are now pegged at 0.25% m/m SA instead of 0.3%. That is a strong plus for January GDP given that GDP is hours worked times labour productivity with the latter depending upon tracking activity readings as they roll in. This feeds my narrative that Canadian GDP was hit in part by serial shocks including strikes that dragged down hours worked but that the effects would prove to be temporary.
Hours worked are tracking a surge of 2.6% q/q SAAR in Q1 (chart 4). That’s a strong plus for overall Q1 GDP tracking for the same reason.
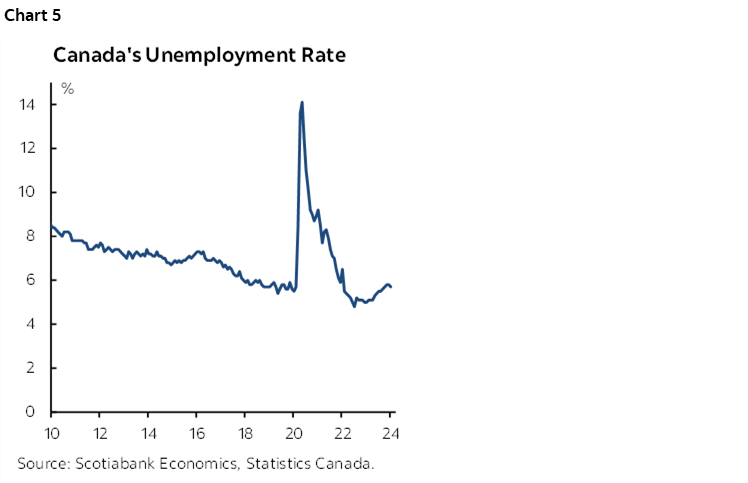
The unemployment rate fell a tick to 5.7% because job growth of 37k exceeded the 18k rise in the size of the labour force (chart 5).
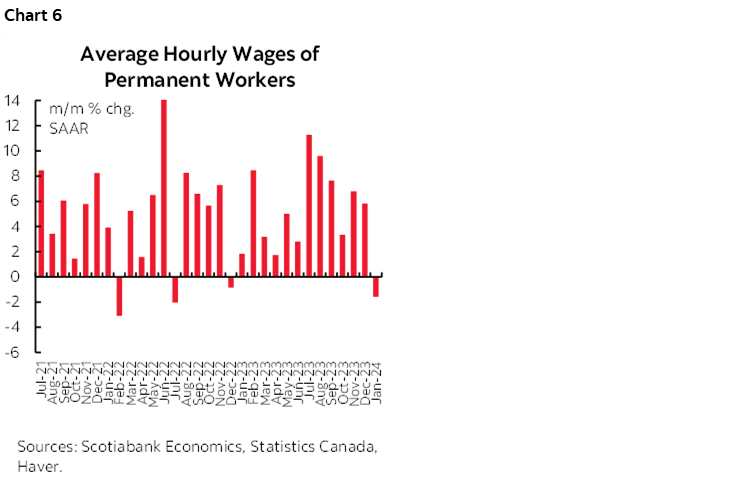
Wages decelerated in January with a drop of 1.6% m/m SAAR (chart 6). That follows two strong gains in November (+6.8%) and December (5.8%). That’s not great, but it’s volatile data in both directions. We’ve seen plenty of soft patches and super accelerations but none of it changes the following two points:
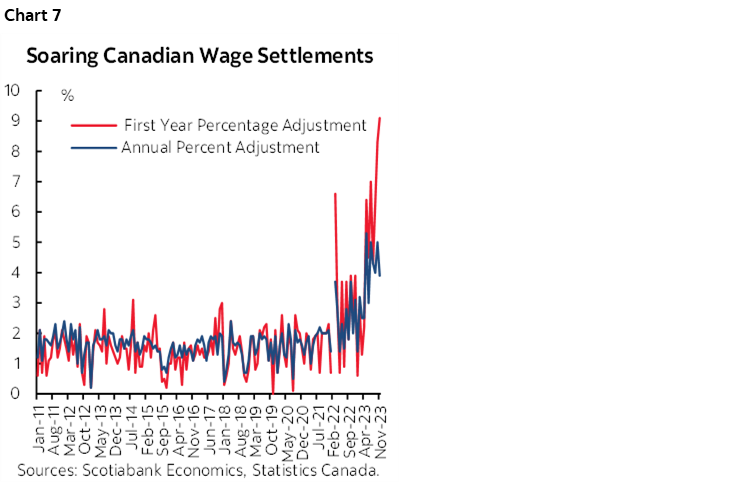
- Canada is hardwiring years of very strong wage gains in the one-third of the workforce that is driven by collective bargaining (chart 7).
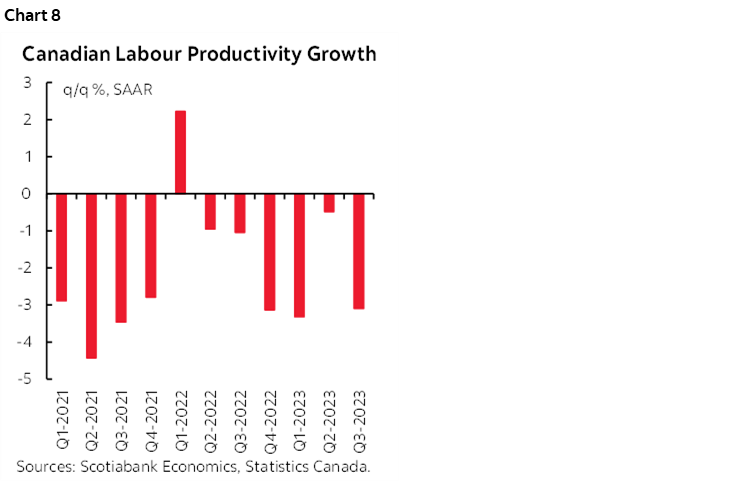
- productivity is very poor and so the trend of wages beating inflation for an extended period and hence posting real gains is not supported by producing more (chart 8).
DISCLAIMER
This report has been prepared by Scotiabank Economics as a resource for the clients of Scotiabank. Opinions, estimates and projections contained herein are our own as of the date hereof and are subject to change without notice. The information and opinions contained herein have been compiled or arrived at from sources believed reliable but no representation or warranty, express or implied, is made as to their accuracy or completeness. Neither Scotiabank nor any of its officers, directors, partners, employees or affiliates accepts any liability whatsoever for any direct or consequential loss arising from any use of this report or its contents.
These reports are provided to you for informational purposes only. This report is not, and is not constructed as, an offer to sell or solicitation of any offer to buy any financial instrument, nor shall this report be construed as an opinion as to whether you should enter into any swap or trading strategy involving a swap or any other transaction. The information contained in this report is not intended to be, and does not constitute, a recommendation of a swap or trading strategy involving a swap within the meaning of U.S. Commodity Futures Trading Commission Regulation 23.434 and Appendix A thereto. This material is not intended to be individually tailored to your needs or characteristics and should not be viewed as a “call to action” or suggestion that you enter into a swap or trading strategy involving a swap or any other transaction. Scotiabank may engage in transactions in a manner inconsistent with the views discussed this report and may have positions, or be in the process of acquiring or disposing of positions, referred to in this report.
Scotiabank, its affiliates and any of their respective officers, directors and employees may from time to time take positions in currencies, act as managers, co-managers or underwriters of a public offering or act as principals or agents, deal in, own or act as market makers or advisors, brokers or commercial and/or investment bankers in relation to securities or related derivatives. As a result of these actions, Scotiabank may receive remuneration. All Scotiabank products and services are subject to the terms of applicable agreements and local regulations. Officers, directors and employees of Scotiabank and its affiliates may serve as directors of corporations.
Any securities discussed in this report may not be suitable for all investors. Scotiabank recommends that investors independently evaluate any issuer and security discussed in this report, and consult with any advisors they deem necessary prior to making any investment.
This report and all information, opinions and conclusions contained in it are protected by copyright. This information may not be reproduced without the prior express written consent of Scotiabank.
™ Trademark of The Bank of Nova Scotia. Used under license, where applicable.
Scotiabank, together with “Global Banking and Markets”, is a marketing name for the global corporate and investment banking and capital markets businesses of The Bank of Nova Scotia and certain of its affiliates in the countries where they operate, including; Scotiabank Europe plc; Scotiabank (Ireland) Designated Activity Company; Scotiabank Inverlat S.A., Institución de Banca Múltiple, Grupo Financiero Scotiabank Inverlat, Scotia Inverlat Casa de Bolsa, S.A. de C.V., Grupo Financiero Scotiabank Inverlat, Scotia Inverlat Derivados S.A. de C.V. – all members of the Scotiabank group and authorized users of the Scotiabank mark. The Bank of Nova Scotia is incorporated in Canada with limited liability and is authorised and regulated by the Office of the Superintendent of Financial Institutions Canada. The Bank of Nova Scotia is authorized by the UK Prudential Regulation Authority and is subject to regulation by the UK Financial Conduct Authority and limited regulation by the UK Prudential Regulation Authority. Details about the extent of The Bank of Nova Scotia's regulation by the UK Prudential Regulation Authority are available from us on request. Scotiabank Europe plc is authorized by the UK Prudential Regulation Authority and regulated by the UK Financial Conduct Authority and the UK Prudential Regulation Authority.
Scotiabank Inverlat, S.A., Scotia Inverlat Casa de Bolsa, S.A. de C.V, Grupo Financiero Scotiabank Inverlat, and Scotia Inverlat Derivados, S.A. de C.V., are each authorized and regulated by the Mexican financial authorities.
Not all products and services are offered in all jurisdictions. Services described are available in jurisdictions where permitted by law.