- Canada lost more jobs than expected…
- ...but the details were not as bad as the headline…
- ...and the hit was likely transitory
Canada jobs m/m change (000s) / UR (%), SA, January:
Actual: -212.8 / 9.4
Scotia: -70 / 9.2
Consensus: -40 / 8.9
Prior: -62.6 / 8.6
Have I ever told you that I hate jobs reports? There, got that off my chest. Jobs clearly disappointed expectations despite the unfortunately very limited advance signals we have to go by. At least expectations got the sign right, but the magnitude of the decline is beyond what can be dismissed by mere sampling noise given a 95% confidence interval of +/-58k around the estimated 212.8k decline. So what happened and does it change anything for the BoC?
On the latter point, I would think the BoC would look through it as a transitory hit that is likely to bounce back as restrictions get eased and eventually we get greater progress toward vaccines. Their tools are obviously ineffective in terms of doing anything about last month’s jobs or future near-term reports and the underlying details to the report indicate that health restrictions were the dominant driver.
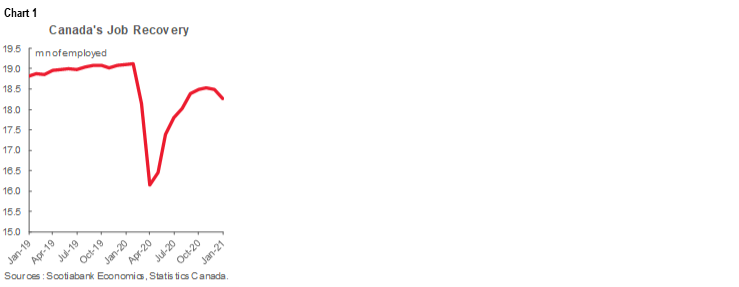
Still, we now have 858,000 fewer jobs than just before the pandemic struck which knocks back the amount of recovered jobs to 2.13 million since April (chart 1). There remains a lot of pain and suffering in the labour market when you see so many of your family, friends, neighbours and colleagues sidelined from the job market alongside other potential suffering. That’s still a large hill to climb in getting back to full employment, but it remains the case that the economy has come a long way in a short time and I still think that much further progress lies ahead. #keepthehope.

The details were not as bad as the headline for a few reasons.
At the top of the list of reasons is that hours worked were up smartly last month and remain on an upward trend. Hours worked drive aggregate pay—and hence spending—more so than shifts in the count of employed people. Hours worked were up by 0.9% m/m last month which probably happened because a) full-time jobs were higher, b) the 18.3 million who still had a job last month worked longer hours (yep, probably you), and c) this offset the reduced aggregate hours coming from the drop in part-time jobs.
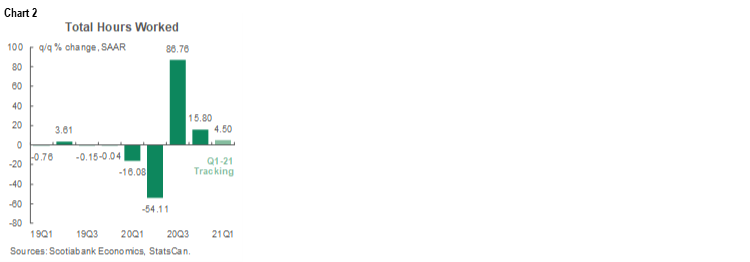
On a quarterly basis, hours worked were up by 15.8% at an annualized rate in Q4 over Q3 and are so far tracking a 4.5% annualized rise in Q1—all seasonally adjusted. Check out chart 2. The speed of the rebound is why 95.5% of the lost hours worked in the initial stages of the pandemic have now been recovered.
You could say that counting hours is even more imprecise than this survey’s attempt at counting bodies employed, but the cross-check is that the rough rule of thumb behind Okun’s “law” is generally intact in terms of movements in the pace of GDP recovery and job markets (chart 3). The initial burst of activity in the economy and hiring was expected to come down from the stratosphere and it has which shifts the focus at the margin to expectations for future GDP and job growth which remains positive.

An added point on hours worked is that it indicates that January GDP could well stay in the black despite restrictions. GDP is an identity defined as hours worked times labour productivity with the latter defined as output per hour worked. The activity readings that determine output are all ahead of us for the month, but the gain in hours worked is a good start.
Second, all of the drop was in part-time jobs (-225k) as full-time jobs were up by about 13k. A job is a job in the headline, but again, if the hit is more to part-time jobs then total hours worked can be more resilient.
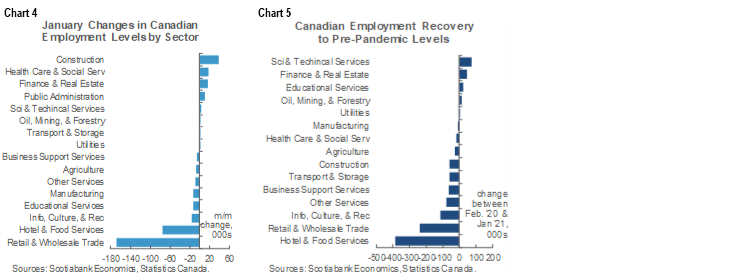
Third, sector breadth was modest. Chart 4 shows the sector breakdown and chart 5 shows cumulative changes in jobs during the pandemic. By sector, the biggest hit was in the wholesale/retail category (-168k). The next largest was in accommodation and food services (-75k). There were small losses in education (-13k), info/culture/recreation (-17k), business, building and other support services (-5.4k) and ‘other’ services (-8.8k). Within goods producing sectors, manufacturing jobs fell by 12.3k and agriculture shed 6.5k.
Fourth, by province, most of the hit was in Ontario (-154k) followed by Quebec (-98k) while other provinces were little changed. The one positive outlier was Alberta where about 21k jobs were added. This concentration upon Ontario and Quebec bolsters the point that the hit was driven by restrictions and not by something more sinister in the underlying drivers of job growth. Ontario and Quebec led the most aggressive restrictions in the country and so when they reduce restrictions we should see jobs bounce back.
All of the loss was in private sector payrolls where jobs fell by 211.1k. Public sector jobs were down by 10.7k with self employment up 9k.
Hourly wage growth accelerated to 5.9% y/y (5.4% prior) probably due to lower paying jobs dropping out.
The labour force shrank by 88k and the participation rate slipped which offset some of the impact of the decline in jobs on the unemployment rate that nevertheless climbed to 9.4%.
DISCLAIMER
This report has been prepared by Scotiabank Economics as a resource for the clients of Scotiabank. Opinions, estimates and projections contained herein are our own as of the date hereof and are subject to change without notice. The information and opinions contained herein have been compiled or arrived at from sources believed reliable but no representation or warranty, express or implied, is made as to their accuracy or completeness. Neither Scotiabank nor any of its officers, directors, partners, employees or affiliates accepts any liability whatsoever for any direct or consequential loss arising from any use of this report or its contents.
These reports are provided to you for informational purposes only. This report is not, and is not constructed as, an offer to sell or solicitation of any offer to buy any financial instrument, nor shall this report be construed as an opinion as to whether you should enter into any swap or trading strategy involving a swap or any other transaction. The information contained in this report is not intended to be, and does not constitute, a recommendation of a swap or trading strategy involving a swap within the meaning of U.S. Commodity Futures Trading Commission Regulation 23.434 and Appendix A thereto. This material is not intended to be individually tailored to your needs or characteristics and should not be viewed as a “call to action” or suggestion that you enter into a swap or trading strategy involving a swap or any other transaction. Scotiabank may engage in transactions in a manner inconsistent with the views discussed this report and may have positions, or be in the process of acquiring or disposing of positions, referred to in this report.
Scotiabank, its affiliates and any of their respective officers, directors and employees may from time to time take positions in currencies, act as managers, co-managers or underwriters of a public offering or act as principals or agents, deal in, own or act as market makers or advisors, brokers or commercial and/or investment bankers in relation to securities or related derivatives. As a result of these actions, Scotiabank may receive remuneration. All Scotiabank products and services are subject to the terms of applicable agreements and local regulations. Officers, directors and employees of Scotiabank and its affiliates may serve as directors of corporations.
Any securities discussed in this report may not be suitable for all investors. Scotiabank recommends that investors independently evaluate any issuer and security discussed in this report, and consult with any advisors they deem necessary prior to making any investment.
This report and all information, opinions and conclusions contained in it are protected by copyright. This information may not be reproduced without the prior express written consent of Scotiabank.
™ Trademark of The Bank of Nova Scotia. Used under license, where applicable.
Scotiabank, together with “Global Banking and Markets”, is a marketing name for the global corporate and investment banking and capital markets businesses of The Bank of Nova Scotia and certain of its affiliates in the countries where they operate, including; Scotiabank Europe plc; Scotiabank (Ireland) Designated Activity Company; Scotiabank Inverlat S.A., Institución de Banca Múltiple, Grupo Financiero Scotiabank Inverlat, Scotia Inverlat Casa de Bolsa, S.A. de C.V., Grupo Financiero Scotiabank Inverlat, Scotia Inverlat Derivados S.A. de C.V. – all members of the Scotiabank group and authorized users of the Scotiabank mark. The Bank of Nova Scotia is incorporated in Canada with limited liability and is authorised and regulated by the Office of the Superintendent of Financial Institutions Canada. The Bank of Nova Scotia is authorized by the UK Prudential Regulation Authority and is subject to regulation by the UK Financial Conduct Authority and limited regulation by the UK Prudential Regulation Authority. Details about the extent of The Bank of Nova Scotia's regulation by the UK Prudential Regulation Authority are available from us on request. Scotiabank Europe plc is authorized by the UK Prudential Regulation Authority and regulated by the UK Financial Conduct Authority and the UK Prudential Regulation Authority.
Scotiabank Inverlat, S.A., Scotia Inverlat Casa de Bolsa, S.A. de C.V, Grupo Financiero Scotiabank Inverlat, and Scotia Inverlat Derivados, S.A. de C.V., are each authorized and regulated by the Mexican financial authorities.
Not all products and services are offered in all jurisdictions. Services described are available in jurisdictions where permitted by law.