- US jobs reports send conflicting signals
- The US services sector rapidly accelerated
- The Fed is likely to stay on track toward accelerating its tapering
US nonfarm payrolls m/m 000s // unemployment rate % // wage growth y/y %, SA, November:
Actual: 210 / 4.2 / 4.8
Scotia: 450 / 4.4 / 4.9
Consensus: 550 / 4.5 / 5.0
Prior: 546 / 4.8 / 4.8 (revised from 531 / 4.6 / 4.9)
Two measures of US job growth diverged from one another and caused mixed effects on overall assessments of the health of the job market. Nonfarm payrolls disappointed at +210k with minimal revisions (+82k) such that the combined total fell meaningfully below expectations even after accounting for statistical confidence bands.
The companion household survey was up by 1.14 million and that’s much larger than anything that typical statistical noise can dismiss even though the noise factor is higher than it is for payrolls. It’s possible that the net effect signals robust employment gains off-payrolls and slanted toward smaller businesses. It’s also possible there may be revisions to one or both measures in subsequent reports. Quality of jobs data in general diminished our ability to read developments given the suspension of the Census Bureau’s Household Pulse Survey as it undergoes methodological changes.
The unemployment rate fell to 4.2% from 4.6% because it is derived from the household survey where the 1.14 million job gain almost doubled the 594k rise in the size of the labour force (chart 1).

The private sector (+235k) accounted for all of the payroll gain as government shed 25k jobs all in the state and local sector. Public sector jobs have fallen for four straight months and all at the state/local level.
Chart 2 shows the breakdown of the change in jobs by sector. Goods sectors added 60k while services added 175k. Within goods, the gain was split between construction and manufacturing. Within services, the gain had relatively modest breadth.

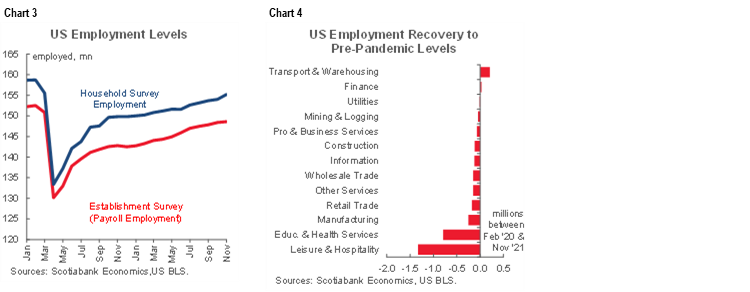
The US is now just 3.9 million jobs away from February 2020 levels according to payrolls, and 3.6 million according to the household survey. See chart 3. Chart 4 shows the sector breakdown.
Wage growth was stable at 4.8% y/y as wages were up 0.3% m/m. The annualized month-over-month wage increase slowed along a somewhat volatile trend (chart 5).

Hours worked were up 0.5% m/m and are tracking a gain of 4.8% q/q annualized in Q4 (chart 6). Given that GDP is an identity defined as hours times labour productivity this is a very strong pace of growth.

ISM-services surprised higher on the headline reading of 69.1 (66.7 prior). That is the highest and hottest reading on record which signals rapid growth in the services sector. The employment subindex would not have helped forecast the deceleration in nonfarm payrolls since it soared by almost five full points to 56.5. Maybe that supports the household survey and/or revisions to nonfarm. Prices paid continue to rise at a very rapid pace and so do new orders as both subindices did not meaningfully change between October and November.
Overall these readings continue to point to rapid growth in GDP, continued progress toward the Fed’s full employment mandate but with mixed signals between the surveys, and further wage gains. They probably won’t influence the tone of the discussion at the upcoming FOMC meeting the week after next as Chair Powell has probably locked in an accelerated pace of tapering in no small part driven by inflationary concerns.
DISCLAIMER
This report has been prepared by Scotiabank Economics as a resource for the clients of Scotiabank. Opinions, estimates and projections contained herein are our own as of the date hereof and are subject to change without notice. The information and opinions contained herein have been compiled or arrived at from sources believed reliable but no representation or warranty, express or implied, is made as to their accuracy or completeness. Neither Scotiabank nor any of its officers, directors, partners, employees or affiliates accepts any liability whatsoever for any direct or consequential loss arising from any use of this report or its contents.
These reports are provided to you for informational purposes only. This report is not, and is not constructed as, an offer to sell or solicitation of any offer to buy any financial instrument, nor shall this report be construed as an opinion as to whether you should enter into any swap or trading strategy involving a swap or any other transaction. The information contained in this report is not intended to be, and does not constitute, a recommendation of a swap or trading strategy involving a swap within the meaning of U.S. Commodity Futures Trading Commission Regulation 23.434 and Appendix A thereto. This material is not intended to be individually tailored to your needs or characteristics and should not be viewed as a “call to action” or suggestion that you enter into a swap or trading strategy involving a swap or any other transaction. Scotiabank may engage in transactions in a manner inconsistent with the views discussed this report and may have positions, or be in the process of acquiring or disposing of positions, referred to in this report.
Scotiabank, its affiliates and any of their respective officers, directors and employees may from time to time take positions in currencies, act as managers, co-managers or underwriters of a public offering or act as principals or agents, deal in, own or act as market makers or advisors, brokers or commercial and/or investment bankers in relation to securities or related derivatives. As a result of these actions, Scotiabank may receive remuneration. All Scotiabank products and services are subject to the terms of applicable agreements and local regulations. Officers, directors and employees of Scotiabank and its affiliates may serve as directors of corporations.
Any securities discussed in this report may not be suitable for all investors. Scotiabank recommends that investors independently evaluate any issuer and security discussed in this report, and consult with any advisors they deem necessary prior to making any investment.
This report and all information, opinions and conclusions contained in it are protected by copyright. This information may not be reproduced without the prior express written consent of Scotiabank.
™ Trademark of The Bank of Nova Scotia. Used under license, where applicable.
Scotiabank, together with “Global Banking and Markets”, is a marketing name for the global corporate and investment banking and capital markets businesses of The Bank of Nova Scotia and certain of its affiliates in the countries where they operate, including; Scotiabank Europe plc; Scotiabank (Ireland) Designated Activity Company; Scotiabank Inverlat S.A., Institución de Banca Múltiple, Grupo Financiero Scotiabank Inverlat, Scotia Inverlat Casa de Bolsa, S.A. de C.V., Grupo Financiero Scotiabank Inverlat, Scotia Inverlat Derivados S.A. de C.V. – all members of the Scotiabank group and authorized users of the Scotiabank mark. The Bank of Nova Scotia is incorporated in Canada with limited liability and is authorised and regulated by the Office of the Superintendent of Financial Institutions Canada. The Bank of Nova Scotia is authorized by the UK Prudential Regulation Authority and is subject to regulation by the UK Financial Conduct Authority and limited regulation by the UK Prudential Regulation Authority. Details about the extent of The Bank of Nova Scotia's regulation by the UK Prudential Regulation Authority are available from us on request. Scotiabank Europe plc is authorized by the UK Prudential Regulation Authority and regulated by the UK Financial Conduct Authority and the UK Prudential Regulation Authority.
Scotiabank Inverlat, S.A., Scotia Inverlat Casa de Bolsa, S.A. de C.V, Grupo Financiero Scotiabank Inverlat, and Scotia Inverlat Derivados, S.A. de C.V., are each authorized and regulated by the Mexican financial authorities.
Not all products and services are offered in all jurisdictions. Services described are available in jurisdictions where permitted by law.