- Growth stalled in October, eked out a tiny preliminary gain in November
- More shocks distorted the picture...
- ...like an auto shutdown, UAW & Seaway strike effects, upgrader problems
- Markets largely shook it off and so will the BoC
- Canadian GDP, m/m % change, October, SA:
- Actual: 0.0
- Scotia: 0.2
- Consensus: 0.2
- Prior: 0.0 (revised from 0.1)
- November ‘flash’ guidance: +0.1 % m/m SA
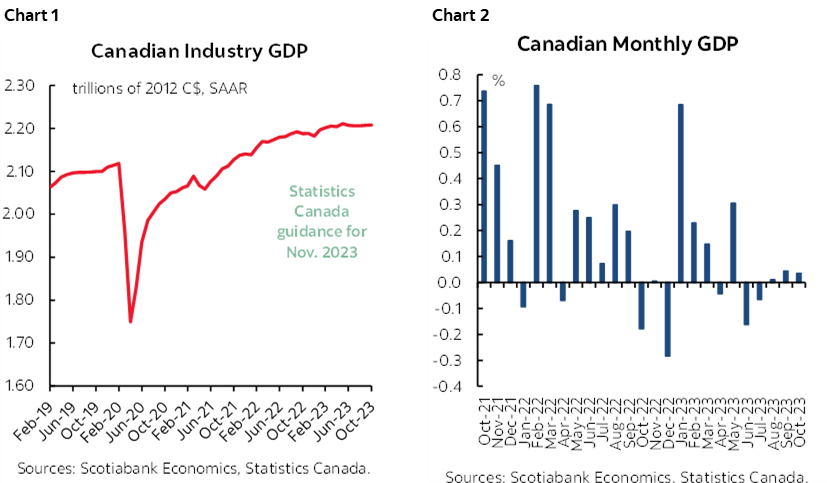
Canada’s economy is treading water after another pair of soft readings for October and November (chart 1). I’m sure some will choke on their maple syrup and start throwing tantrums. As far as I’m concerned, the fact that the economy is not materially shrinking with all that has been thrown at it from rate hikes to serial shocks continues to be a minor miracle (chart 2). The latest batch of data added further evidence of transitory shocks that are exaggerating the still material underlying softness in the economy with more required in order to appease the BoC.
Markets and Bank of Canada Implications
There was little reaction to the data on both sides of the border including Canadian GDP and the softer than expected US core PCE reading of 0.1% m/m SA. Two-year yields in both countries slipped by 1–2bps post data. The Canadian dollar appreciated a bit perhaps more driven by the USD’s broad softening.
There are no material implications for the BoC. None. Nadda. Zilch. Zippo. Walk it off.
BoC Governor Macklem already advised that he’s expecting weakness to persist through the first half of 2024 which is an indication that he’s prepared to look through it as a necessary step toward opening up disinflationary slack in the economy. By extension, that says he’d need much greater weakness than he’s anticipating in order to worry him.
Further, there remain multiple idiosyncratic drivers of inflation risk that are beyond the capability of the output gap framework’s reliance upon GDP growth to capture. It’s 2% inflation over the medium-term that is their mandate and a lot goes into the soup that makes up an inflation forecast. For one, wages are vastly outpacing inflation and productivity. For another, immigration is excessive; the need is now, and governments are telling arrivals just to wait 5–10 years for a modest amount of housing to possibly be built if they can get the workers and financing to pull it off. There is more political smoke blowing than homes being built and that won’t change for a long while yet.
Details—The Shocks Continue
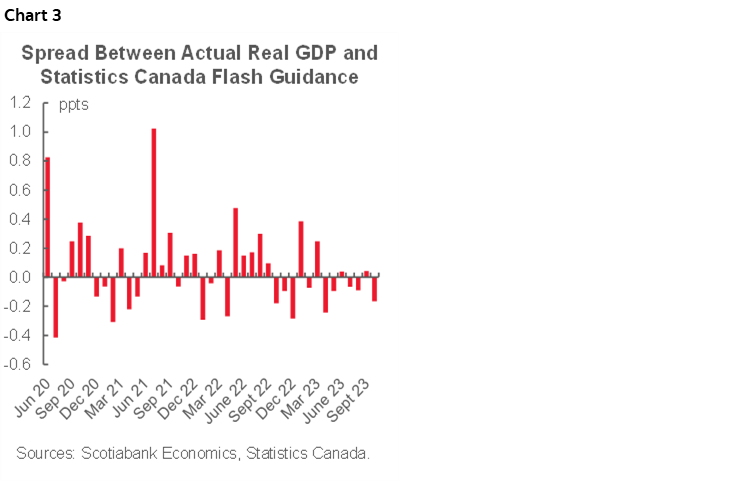
Canada’s economy was flat in October despite advance guidance from Statcan that it was tracking 0.2% m/m growth. That’s the biggest overshoot by their preliminary tracking since April but revisions in either direction have been the norm since they started to provide their advance tracking in the pandemic (chart 3).
With that caution in mind, take preliminary guidance that November’s GDP was up 0.1% m/m with a lot of skepticism and in both directions. It’s a guesstimate by the agency and they don’t provide details other than to say that November was lifted by manufacturing, wholesale trade, real estate agents and brokers and federal government spending, but offset by declines in mining/oil&gas and utilities.
Chart 4 shows the break down of October GDP by sector and chart 5 does likewise in weighted contribution to growth terms. There was significant breadth to the softness with services up 0.1% m/m but goods sector output flat and with half of the 20 sectors up and half down.
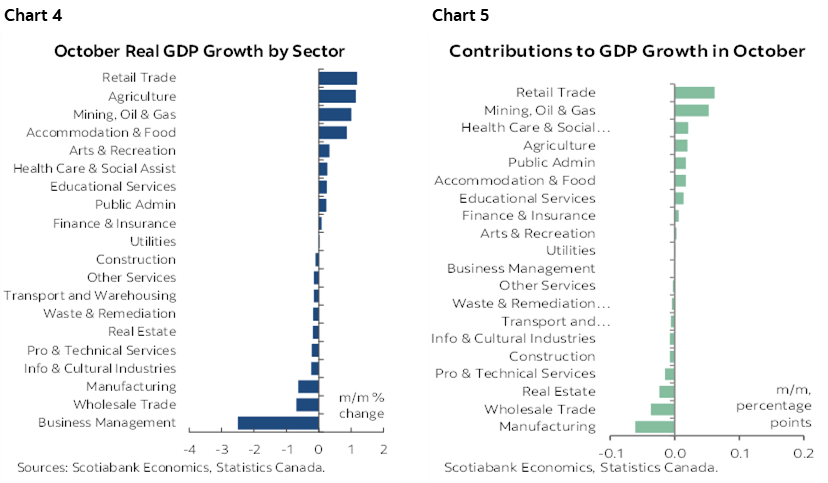
Gains in retail, mining/oil&gas, health care and social services, agriculture, public administration, accommodation and food services, educational services and finance were offset primarily by drops in manufacturing, wholesale trade, retal estate and professional and scientific services.
Shocks Continue
The softness in October GDP was exaggerated by the continuation of serial shocks. Some may say that’s making excuses, but I think it’s a substantive point. Canada’s economy is mired in a frustrating sequence of serial shocks starting with strikes that began in Q2 and are ongoing into Q4, continuing through unplanned maintenance in the oil patch and the effects of nationwide wildfires.
Now we can add to that list with the following guidance from Statcan:
- The manufacturing sector was principally driven lower by activity in the transportation sector because weakness in autos caused by two things. One was a shutdown of a major assembly plant for retooling. The other was the cross border impact of the UAW strike in the US.
- Oilsands extraction fell 2.2% m/m “as turnarounds at some oil sands upgraders continued.”
- The St. Lawrence Seaway strike hit multiple sectors of the economy. Statcan pointed the finger at this as a driver of weakness in the transportation and warehousing sector.
I am not saying that the economy would be booming absent these shocks. I am saying that while it’s frustrating to see the persistent arrival of such disruptions, I’m still of the belief that our understanding of what’s going on in the economy is being distorted by temporary developments that are beyond the influences of factors like tighter monetary policy and it’s a disservice to the public discourse on the state of the economy to see so much commentary ignoring these factors.
The funny thing is that Canada has witnessed prior periods of serial shocks that have weighed on the economy such as under former Governor Poloz’s term at the BoC and yet the emphasis placed upon them at that time is absent a lot of the commentary being provided about Canada’s economy today...
DISCLAIMER
This report has been prepared by Scotiabank Economics as a resource for the clients of Scotiabank. Opinions, estimates and projections contained herein are our own as of the date hereof and are subject to change without notice. The information and opinions contained herein have been compiled or arrived at from sources believed reliable but no representation or warranty, express or implied, is made as to their accuracy or completeness. Neither Scotiabank nor any of its officers, directors, partners, employees or affiliates accepts any liability whatsoever for any direct or consequential loss arising from any use of this report or its contents.
These reports are provided to you for informational purposes only. This report is not, and is not constructed as, an offer to sell or solicitation of any offer to buy any financial instrument, nor shall this report be construed as an opinion as to whether you should enter into any swap or trading strategy involving a swap or any other transaction. The information contained in this report is not intended to be, and does not constitute, a recommendation of a swap or trading strategy involving a swap within the meaning of U.S. Commodity Futures Trading Commission Regulation 23.434 and Appendix A thereto. This material is not intended to be individually tailored to your needs or characteristics and should not be viewed as a “call to action” or suggestion that you enter into a swap or trading strategy involving a swap or any other transaction. Scotiabank may engage in transactions in a manner inconsistent with the views discussed this report and may have positions, or be in the process of acquiring or disposing of positions, referred to in this report.
Scotiabank, its affiliates and any of their respective officers, directors and employees may from time to time take positions in currencies, act as managers, co-managers or underwriters of a public offering or act as principals or agents, deal in, own or act as market makers or advisors, brokers or commercial and/or investment bankers in relation to securities or related derivatives. As a result of these actions, Scotiabank may receive remuneration. All Scotiabank products and services are subject to the terms of applicable agreements and local regulations. Officers, directors and employees of Scotiabank and its affiliates may serve as directors of corporations.
Any securities discussed in this report may not be suitable for all investors. Scotiabank recommends that investors independently evaluate any issuer and security discussed in this report, and consult with any advisors they deem necessary prior to making any investment.
This report and all information, opinions and conclusions contained in it are protected by copyright. This information may not be reproduced without the prior express written consent of Scotiabank.
™ Trademark of The Bank of Nova Scotia. Used under license, where applicable.
Scotiabank, together with “Global Banking and Markets”, is a marketing name for the global corporate and investment banking and capital markets businesses of The Bank of Nova Scotia and certain of its affiliates in the countries where they operate, including; Scotiabank Europe plc; Scotiabank (Ireland) Designated Activity Company; Scotiabank Inverlat S.A., Institución de Banca Múltiple, Grupo Financiero Scotiabank Inverlat, Scotia Inverlat Casa de Bolsa, S.A. de C.V., Grupo Financiero Scotiabank Inverlat, Scotia Inverlat Derivados S.A. de C.V. – all members of the Scotiabank group and authorized users of the Scotiabank mark. The Bank of Nova Scotia is incorporated in Canada with limited liability and is authorised and regulated by the Office of the Superintendent of Financial Institutions Canada. The Bank of Nova Scotia is authorized by the UK Prudential Regulation Authority and is subject to regulation by the UK Financial Conduct Authority and limited regulation by the UK Prudential Regulation Authority. Details about the extent of The Bank of Nova Scotia's regulation by the UK Prudential Regulation Authority are available from us on request. Scotiabank Europe plc is authorized by the UK Prudential Regulation Authority and regulated by the UK Financial Conduct Authority and the UK Prudential Regulation Authority.
Scotiabank Inverlat, S.A., Scotia Inverlat Casa de Bolsa, S.A. de C.V, Grupo Financiero Scotiabank Inverlat, and Scotia Inverlat Derivados, S.A. de C.V., are each authorized and regulated by the Mexican financial authorities.
Not all products and services are offered in all jurisdictions. Services described are available in jurisdictions where permitted by law.