- Canada lost half of the prior month’s employment surge
- This was a summer jobs report that masked underlying resilience
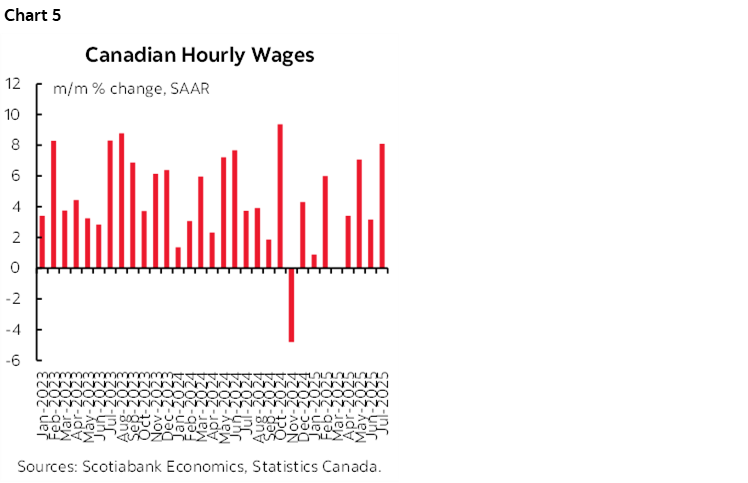
- Wages ripped higher
- Nothing hangs on this one set of numbers from a BoC perspective
- Canada jobs m/m 000s / UR %, July, SA:
- Actual: -40.8 / 6.9
- Scotia: 20 / 6.9
- Consensus: 10 / 7.0
- Prior: 83.1 / 6.9
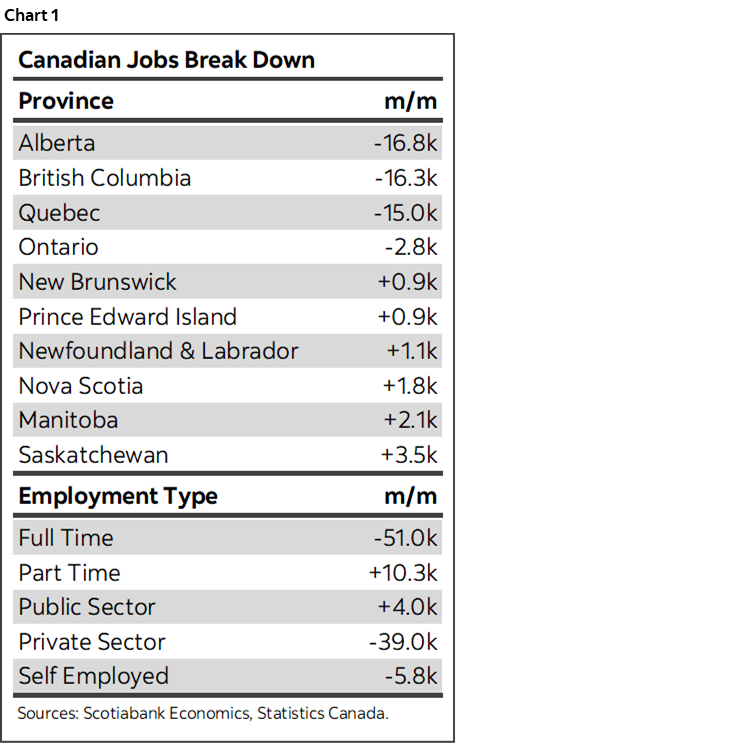
Canada lost 41k jobs in July with somewhat mixed details. What follows are light observations while on vacay. Summary data is provided in chart 1.
Nothing hangs on just this one report. It comes on the heels of an 83k gain in June and with 103k jobs created so far this year. Smooth the noisy household survey.
Further, this is one of two job reports before the next BoC decision on September 17th, along with a bevy of other macro indicators (CPI, GDP etc) and potential developments around trade and fiscal policies.
It’s probably because of these points that market moves were minor following the release. There is only about 10bps priced in for the BoC September meeting.
The loss would have been greater if not for the highest seasonal adjustment factor on record comparing like months of July (chart 2). The recency bias in how they are calculated is creating what I believe to be unreliable adjustments.

All of the loss was in full-time jobs (-51k) as part-time jobs were up 10.3k.
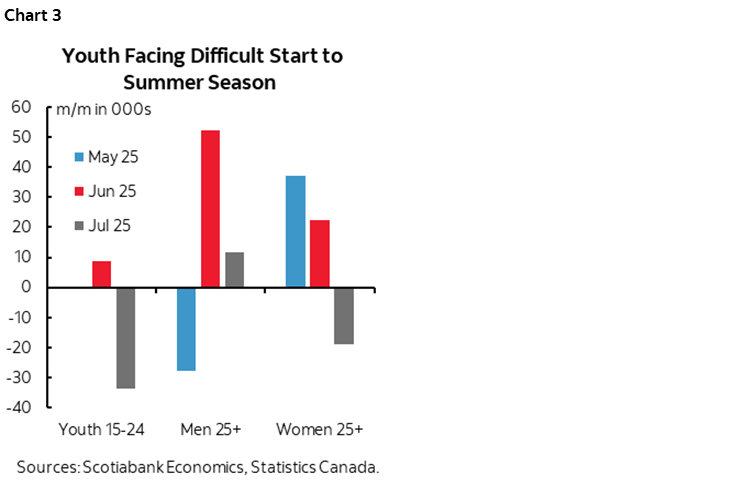
Almost all of the loss was among youths aged 15–24 who saw 34k fewer jobs in July (chart 3). Adults aged 25+ lost 7k after gaining 74k the prior month. This is an important point as the 25+ market is more likely to be floating the economy. A flood of temps changed the summer job market and wildfires haven’t helped seasonal employment.
Almost all of the loss was in private payroll positions (-39k) as public payrolls (+4k) and self-employed positions (-6k) were little changed.
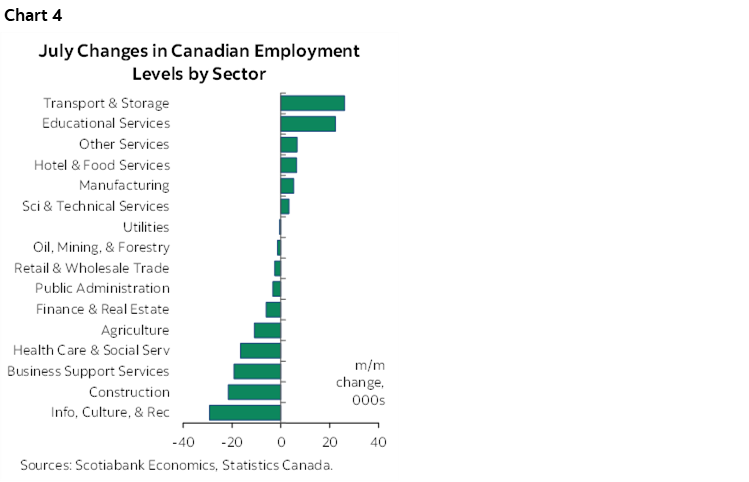
The loss had high sector breadth (chart 4). The goods sector lost 29k jobs and services were down 12k. Within goods, construction (-22k) and agriculture (-11k) were the culprits. Within services, the biggest losses were in info/culture/rec (-29k), health care and social assistance (-17k) and business, building and other support services (-19k).
Wage growth vaulted forward with a rise of 8.1% m/m at a seasonally adjusted and annualized rate (SAAR). That’s the strongest since last October (chart 5).
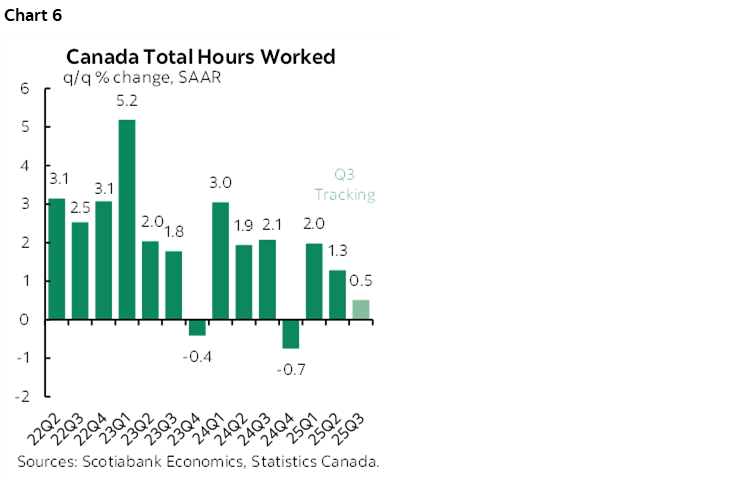
Hours worked slipped by -0.2% m/m SA. They are tracking a mild 0.5% q/q SAAR gain in Q3 so far assuming August and September come in flat only to focus the math on the effects of what is known thus far (chart 6).
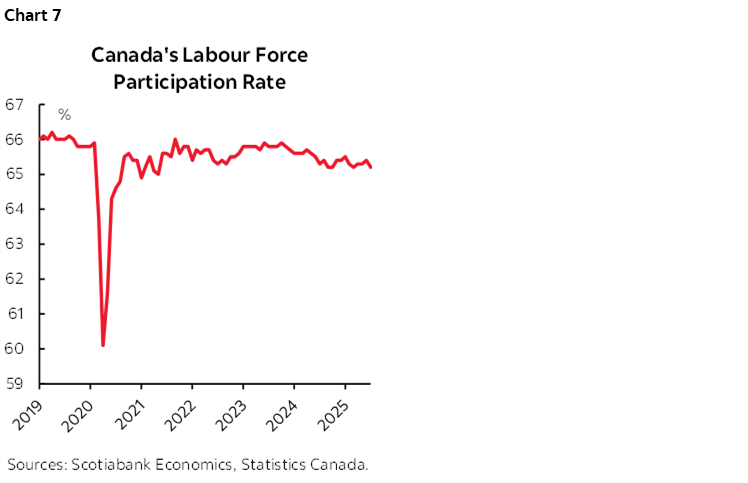
The unemployment rate held at 6.9% because the labour force shrank by 33k and knocked the participation rate down two-tenths to 65.2% (chart 7). The labour force is a super volatile series and follows three large monthly gains. The surprise to me has been that the labour force has not been shrinking by more due to tighter immigration policies.
By province the biggest losers were Alberta, BC and Quebec, all down by 15–17k.
DISCLAIMER
This report has been prepared by Scotiabank Economics as a resource for the clients of Scotiabank. Opinions, estimates and projections contained herein are our own as of the date hereof and are subject to change without notice. The information and opinions contained herein have been compiled or arrived at from sources believed reliable but no representation or warranty, express or implied, is made as to their accuracy or completeness. Neither Scotiabank nor any of its officers, directors, partners, employees or affiliates accepts any liability whatsoever for any direct or consequential loss arising from any use of this report or its contents.
These reports are provided to you for informational purposes only. This report is not, and is not constructed as, an offer to sell or solicitation of any offer to buy any financial instrument, nor shall this report be construed as an opinion as to whether you should enter into any swap or trading strategy involving a swap or any other transaction. The information contained in this report is not intended to be, and does not constitute, a recommendation of a swap or trading strategy involving a swap within the meaning of U.S. Commodity Futures Trading Commission Regulation 23.434 and Appendix A thereto. This material is not intended to be individually tailored to your needs or characteristics and should not be viewed as a “call to action” or suggestion that you enter into a swap or trading strategy involving a swap or any other transaction. Scotiabank may engage in transactions in a manner inconsistent with the views discussed this report and may have positions, or be in the process of acquiring or disposing of positions, referred to in this report.
Scotiabank, its affiliates and any of their respective officers, directors and employees may from time to time take positions in currencies, act as managers, co-managers or underwriters of a public offering or act as principals or agents, deal in, own or act as market makers or advisors, brokers or commercial and/or investment bankers in relation to securities or related derivatives. As a result of these actions, Scotiabank may receive remuneration. All Scotiabank products and services are subject to the terms of applicable agreements and local regulations. Officers, directors and employees of Scotiabank and its affiliates may serve as directors of corporations.
Any securities discussed in this report may not be suitable for all investors. Scotiabank recommends that investors independently evaluate any issuer and security discussed in this report, and consult with any advisors they deem necessary prior to making any investment.
This report and all information, opinions and conclusions contained in it are protected by copyright. This information may not be reproduced without the prior express written consent of Scotiabank.
™ Trademark of The Bank of Nova Scotia. Used under license, where applicable.
Scotiabank, together with “Global Banking and Markets”, is a marketing name for the global corporate and investment banking and capital markets businesses of The Bank of Nova Scotia and certain of its affiliates in the countries where they operate, including; Scotiabank Europe plc; Scotiabank (Ireland) Designated Activity Company; Scotiabank Inverlat S.A., Institución de Banca Múltiple, Grupo Financiero Scotiabank Inverlat, Scotia Inverlat Casa de Bolsa, S.A. de C.V., Grupo Financiero Scotiabank Inverlat, Scotia Inverlat Derivados S.A. de C.V. – all members of the Scotiabank group and authorized users of the Scotiabank mark. The Bank of Nova Scotia is incorporated in Canada with limited liability and is authorised and regulated by the Office of the Superintendent of Financial Institutions Canada. The Bank of Nova Scotia is authorized by the UK Prudential Regulation Authority and is subject to regulation by the UK Financial Conduct Authority and limited regulation by the UK Prudential Regulation Authority. Details about the extent of The Bank of Nova Scotia's regulation by the UK Prudential Regulation Authority are available from us on request. Scotiabank Europe plc is authorized by the UK Prudential Regulation Authority and regulated by the UK Financial Conduct Authority and the UK Prudential Regulation Authority.
Scotiabank Inverlat, S.A., Scotia Inverlat Casa de Bolsa, S.A. de C.V, Grupo Financiero Scotiabank Inverlat, and Scotia Inverlat Derivados, S.A. de C.V., are each authorized and regulated by the Mexican financial authorities.
Not all products and services are offered in all jurisdictions. Services described are available in jurisdictions where permitted by law.