- Canadian GDP shrank by more than expected in Q2…
- ...but the domestic economy ripped higher…
- ...led by rate-sensitive consumer spending and housing
- The BoC should be encouraged by the details, downplay headline volatility…
- ...as easing on the back of strong final domestic demand would be a policy mistake ...
- ...but let’s see jobs and CPI before deciding on September 17th...
- ...even though the rate sensitives may only just be getting started
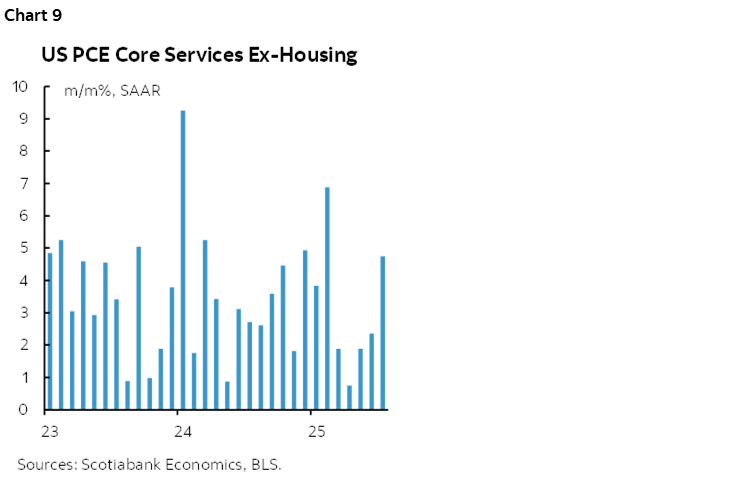
- US core inflation has accelerated over the past two months…
- ...with services leading the way, tariffs still ahead...
- ...sending a cautious signal to the Fed
- Both the BoC and Fed should have no comfort that inflation risk has been licked
- The US consumer is getting magattacked!
- Canada Q2 GDP, q/q SAAR %:
- Actual: -1.6
- Scotia: -0.3
- Consensus: -0.7
- Prior: +2.0 (revised from 2.2)
- Canadian GDP m/m %, SA, June:
- Actual: -0.1
- Scotia: +0.2
- Consensus: +0.1
- Prior: -0.1
- Canadian GDP m/m %, SA, July flash estimate: +0.1
Canada’s economy was much stronger than the headline GDP reading would suggest—so much so that it’s a textbook example for students of how sometimes GDP isn’t a great measure and particularly from the standpoint of what policy should do about it.
Yes, GDP disappointed expectations, for starters. Q2 GDP shrank by –1.6% q/q SAAR and so hats off to the BoC’s estimate in the July MPR that was closest, although that was a mountain of data ago and so luck also likely played a bit of a role alongside noisy trade and inventory swings that are hard to estimate. Chart 1 shows q/q growth using both the complete expenditure-based accounts that the BoC and other forecasters emphasize, as well as the higher frequency monthly production-based accounts. I’ll come back to Q3.
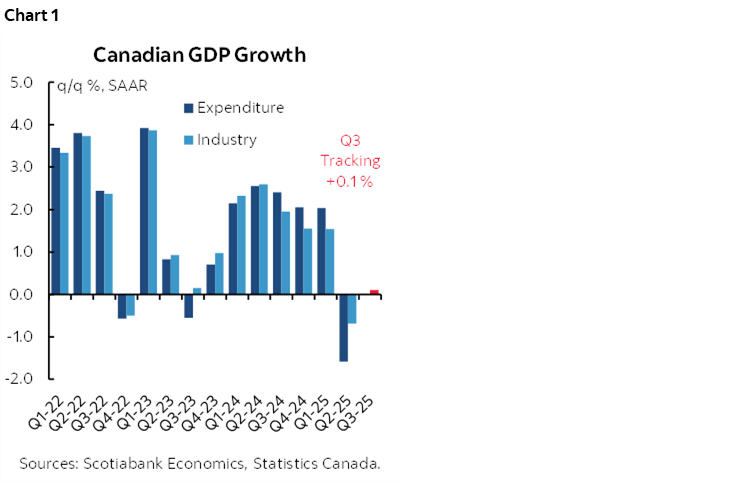
And yes, the monthly GDP figures aren’t great. They’re not terrible either, but –0.1% m/m SA in June and +0.1% m/m in July’s early estimate signals soft momentum.
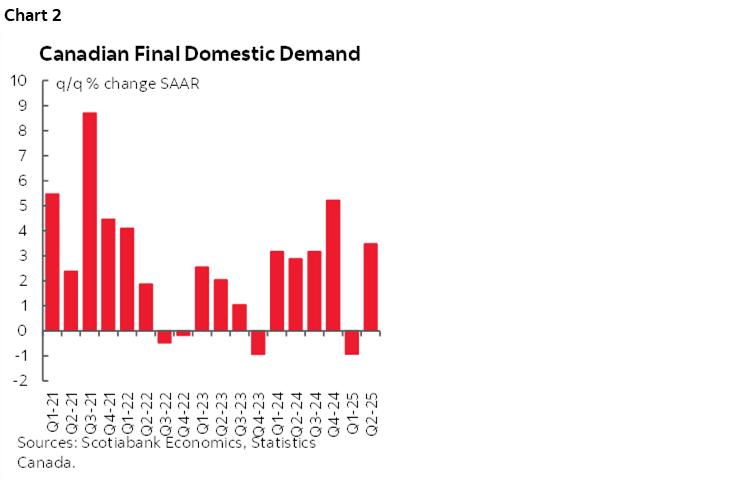
But the key here lies beneath the hood. The domestic economy ripped higher in Q2.
The measure of relevance in that regard is final domestic demand which adds consumption plus investment plus government spending and hence does not include trade and inventory effects. FDD was up by a whopping 3.4% q/q SAAR in Q2 (chart 2).
Why should anyone care? For two reasons.
For one, GDP is being wildly distorted by tariff front-running and unwinding effects in trade and inventory numbers and so it’s important to smooth them out over time while remaining cautious toward the path ahead. Here are the figures on these effects and chart 3 shows the weighted contributions to GDP growth in Q2:
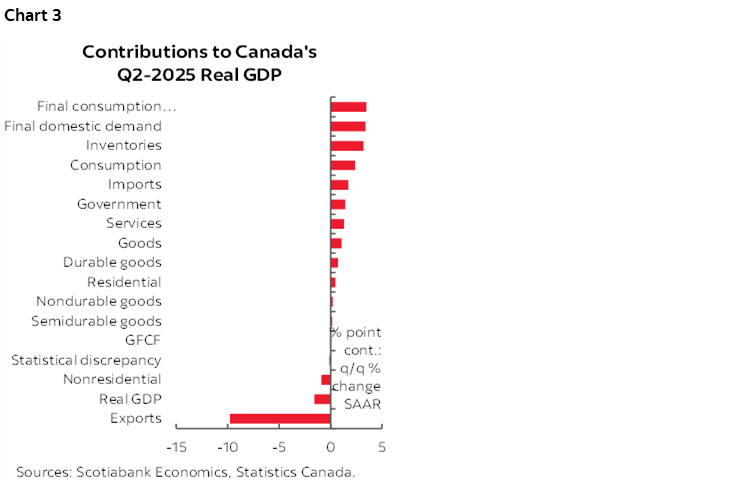
- Exports dragged 9.8 percentage points off of GDP in Q2 at an annualized rate because they plunged by 27% q/q SAAR in Q2 after jumping by about 7% in Q4 and then 6% in Q1.
- Imports offset some of the weakness in net trade (exports minus imports) because imports fell by 5.1% q/q SAAR in Q2 which means less of an import leakage drag effect on Q2 GDP and hence they added 3.2 ppts to Q2 GDP growth. Imports had previously been surging by 2½% in Q4 and 3½% in Q1.
And the second reason one should care about Final Domestic Demand is because of what it reveals about the household sector:
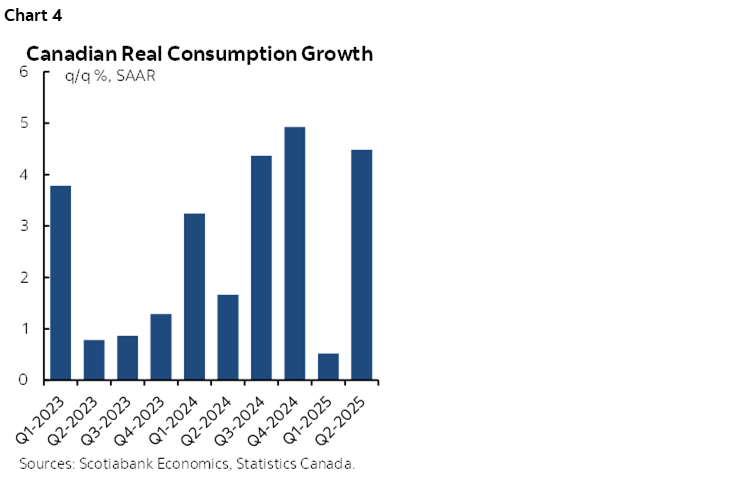
- Consumer spending was up by a whopping 4.5% at a seasonally adjusted and annualized rate (SAAR). Chart 4. That was big enough to contribute 2.4 percentage points to Q2 GDP growth in weighted terms which is huge.
- housing added 0.5 ppts to Q2 GDP growth because housing investment was up by 6.3% q/q SAAR.
- The other parts of the domestic economy were more mixed than the resounding strength in the household sector.
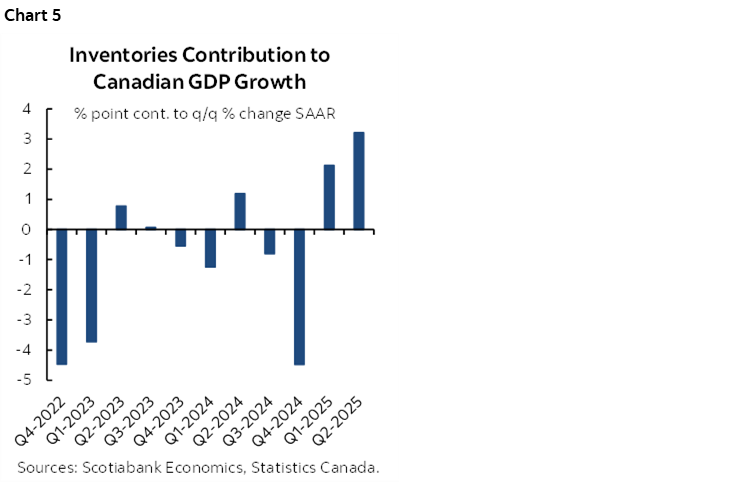
- Inventories added 3.2 ppts to Q2 GDP growth after adding 2 ppts to Q1 GDP growth as companies stockpile before global tariffs and other drivers of inflation make them potentially more expensive. Chart 5.
- business equipment spending subtracted 1.3 ppts, structures added 0.3 ppts.
- and government spending added 1.1 ppts with government fixed investment adding another 0.4.
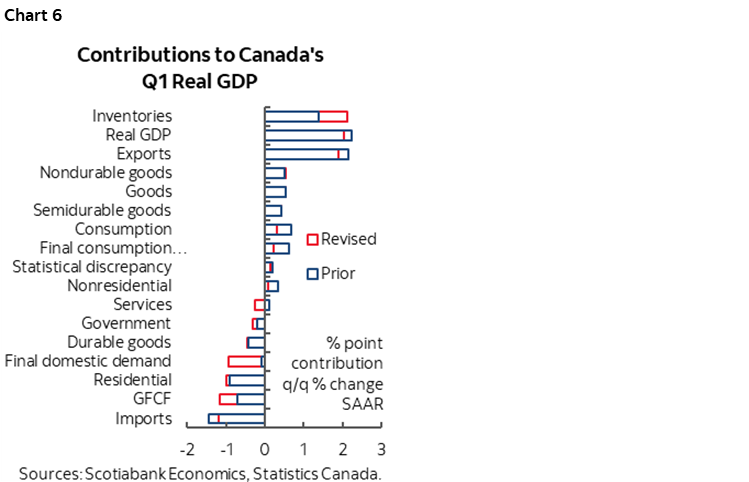
There were also revisions to Q1 GDP shown in chart 6. Inventories added more than previously estimated (2.1 ppts instead of 1.4). Imports declined more than initially estimated and therefore added more to GDP growth on revisions. Everything else was either left untouched or revised lower. Some of the Q2 rebound in Final Domestic Rebound was due to a downward revision to Q1, but even net of this jumping off effect from Q1 the figures for Q2 were solid.
Recent Momentum
The June and July monthly GDP figures signal softness, but no contraction on the trend.
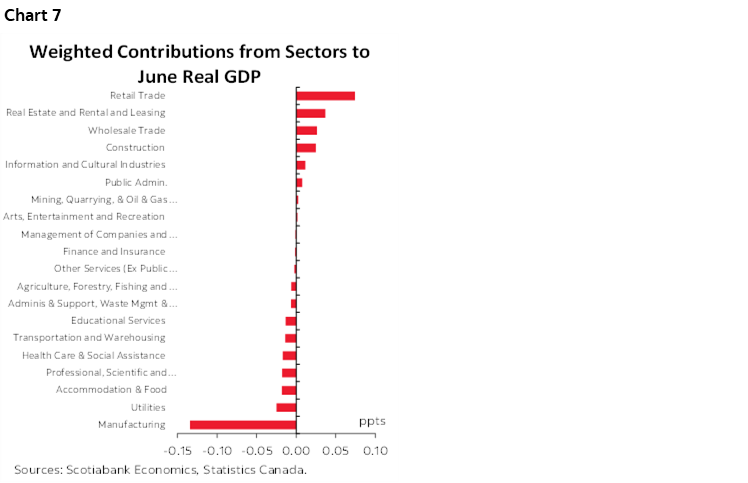
June GDP slipped by –0.08 %m/m SA. Manufacturing was the main reason (chart 7), much of which was offset by consumer and real estate contributions.
July’s advance guidance points to a +0.1% m/m SA gain. We don’t get details other than this light guidance from Statcan:
“Increases in real estate and rental and leasing, mining and quarrying (except oil and gas) and wholesale trade were partially offset by a decrease in retail trade.”
This leaves us tracking essentially no growth in Q3 (+0.1% q/q SAAR) but based on highly preliminary data with a lot more still ahead including important details like whether household sector momentum is maintained.
How Will the BoC React?
The BoC should emphasize the final domestic demand detail— which they have always tended to do in their statements at times like this—and fade the headline GDP number. I still want to see next Friday's spin of the wheel for Canadian jobs (+35k is my estimate) and then the next week's CPI figures and other information, but the market may not be correctly interpreting what these numbers mean to the BOC.
In general, the rate sensitive areas of the economy are accelerating. We see that in home sales that are up 3 months in a row, housing starts that are up 4 months in a row, retail sales that are doing fine, and auto sales that are up. And now look at the consumption and housing components of GDP that were very strong.
Obviously there are risks ahead, but they are two tailed, not all on one side. Trade uncertainty is a modest risk at this point with a minimal effective tariff shock and flexible currency with bidirectional uncertainties into the CUSMA negotiations; the biggest risk to Canadian exports is whether US growth proves to be resilient or not which puts the income pull effect on Canadian exports ahead of tariff-related price sensitivities. On the other hand, we've only just begun to see pass through of rate cuts. The first in July of last summer is only at the one-year anniversary and the last in March is still just a baby. There are 12–24 month lags for monetary policy actions and so a lot of the rate pass through to what's been done is still ahead.
US Consumers Are Getting Magattacked!
The US data was generally boring and so I’ll give it short shrift.
Core PCE landed on the screws at 0.27% m/m SA in July. That’s the second straight month of 0.3% m/m with slight upward rounding. Chart 8.
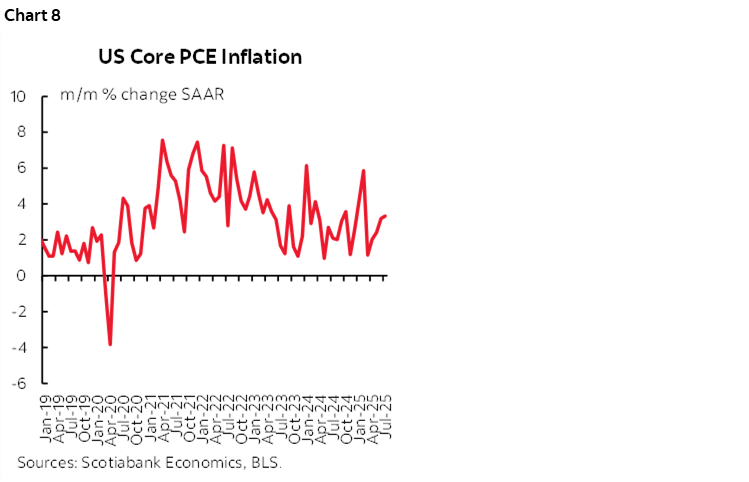
Tariffs? Oh please. This is more about services inflation (chart 9). Tariffs come later. Inflation risk remains very much alive and kicking in the US.
The consumer is paying the price. US consumption isn't strong and headlines imo are exaggerating its strength. Consumer spending was u pby 1.6% q/q SAAR in inflation-adjusted terms in Q2, and is tracking 1.3% in Q3. These numbers follow Q1 consumption that was up by only 0.5% q/q SAAR.
That's a U.S. consumer showing more caution. Gosh, wonder why.... The cycle may be maturing and they've been magattacked! It’s entirely feasible that a combination of much higher policy uncertainty, concern about a slowing labour market and economy, and the effects of tariffs and immigration are dragging down consumption growth.
DISCLAIMER
This report has been prepared by Scotiabank Economics as a resource for the clients of Scotiabank. Opinions, estimates and projections contained herein are our own as of the date hereof and are subject to change without notice. The information and opinions contained herein have been compiled or arrived at from sources believed reliable but no representation or warranty, express or implied, is made as to their accuracy or completeness. Neither Scotiabank nor any of its officers, directors, partners, employees or affiliates accepts any liability whatsoever for any direct or consequential loss arising from any use of this report or its contents.
These reports are provided to you for informational purposes only. This report is not, and is not constructed as, an offer to sell or solicitation of any offer to buy any financial instrument, nor shall this report be construed as an opinion as to whether you should enter into any swap or trading strategy involving a swap or any other transaction. The information contained in this report is not intended to be, and does not constitute, a recommendation of a swap or trading strategy involving a swap within the meaning of U.S. Commodity Futures Trading Commission Regulation 23.434 and Appendix A thereto. This material is not intended to be individually tailored to your needs or characteristics and should not be viewed as a “call to action” or suggestion that you enter into a swap or trading strategy involving a swap or any other transaction. Scotiabank may engage in transactions in a manner inconsistent with the views discussed this report and may have positions, or be in the process of acquiring or disposing of positions, referred to in this report.
Scotiabank, its affiliates and any of their respective officers, directors and employees may from time to time take positions in currencies, act as managers, co-managers or underwriters of a public offering or act as principals or agents, deal in, own or act as market makers or advisors, brokers or commercial and/or investment bankers in relation to securities or related derivatives. As a result of these actions, Scotiabank may receive remuneration. All Scotiabank products and services are subject to the terms of applicable agreements and local regulations. Officers, directors and employees of Scotiabank and its affiliates may serve as directors of corporations.
Any securities discussed in this report may not be suitable for all investors. Scotiabank recommends that investors independently evaluate any issuer and security discussed in this report, and consult with any advisors they deem necessary prior to making any investment.
This report and all information, opinions and conclusions contained in it are protected by copyright. This information may not be reproduced without the prior express written consent of Scotiabank.
™ Trademark of The Bank of Nova Scotia. Used under license, where applicable.
Scotiabank, together with “Global Banking and Markets”, is a marketing name for the global corporate and investment banking and capital markets businesses of The Bank of Nova Scotia and certain of its affiliates in the countries where they operate, including; Scotiabank Europe plc; Scotiabank (Ireland) Designated Activity Company; Scotiabank Inverlat S.A., Institución de Banca Múltiple, Grupo Financiero Scotiabank Inverlat, Scotia Inverlat Casa de Bolsa, S.A. de C.V., Grupo Financiero Scotiabank Inverlat, Scotia Inverlat Derivados S.A. de C.V. – all members of the Scotiabank group and authorized users of the Scotiabank mark. The Bank of Nova Scotia is incorporated in Canada with limited liability and is authorised and regulated by the Office of the Superintendent of Financial Institutions Canada. The Bank of Nova Scotia is authorized by the UK Prudential Regulation Authority and is subject to regulation by the UK Financial Conduct Authority and limited regulation by the UK Prudential Regulation Authority. Details about the extent of The Bank of Nova Scotia's regulation by the UK Prudential Regulation Authority are available from us on request. Scotiabank Europe plc is authorized by the UK Prudential Regulation Authority and regulated by the UK Financial Conduct Authority and the UK Prudential Regulation Authority.
Scotiabank Inverlat, S.A., Scotia Inverlat Casa de Bolsa, S.A. de C.V, Grupo Financiero Scotiabank Inverlat, and Scotia Inverlat Derivados, S.A. de C.V., are each authorized and regulated by the Mexican financial authorities.
Not all products and services are offered in all jurisdictions. Services described are available in jurisdictions where permitted by law.