- A large retail sales gain occurred in June…
- …with almost unbelievable surges in some components…
- …and July’s reported dip is based on a mysteriously low sampling rate
- Retail doesn’t capture what many consumers returned to doing in June and July
- fwiw, retail sales have a large gain baked into Q3
CDN retail sales, m/m % SA, June:
Actual: 4.2 / 4.7
Scotia: 5.0 / na
Consensus: 4.5 / 4.5
Prior: -1.9 / -1.7 (revised from -2.1 / -2.0)
July ‘flash’ guidance: -1.7
The good news is that retail sales soared in June and only slightly missed estimates. The other good news is that despite a possible dip in July, there is a large gain tentatively baked into Q3. It’s also the case that retail sales probably didn’t capture many of the activities Canadians returned to doing over the months of June and July as third wave restrictions were relaxed. The caution, or bad news, is that data quality may not be so good which means leaving the door open to the possibility we don’t have a great understanding of how retail spending is evolving of late.
Since the new information here is mostly about advance ‘flash’ guidance for July I’ll focus on that first. The dip of 1.7% m/m in the value of sales is in one sense not hugely surprising in a mean reversion sense given the magnitude of the gain in June. That’s if you trust the quality of the advance estimate.
On that note, StatsCan made no effort to explain why the response rate plunged to 38% last month when prior flash estimates have been based on around 60% response rates and the final response rate on the complete numbers usually lands around 90%. Chart 1 shows this flash response rate is the lowest since StatsCan began disclosing it and the previous lows were around times when COVID-19 cases were taking off and restrictions were being added. That wasn’t the case in July as the economy opened up as reflected in stringency measures. So were retailers simply too busy in July to respond? Did only the ones who had time because their sales fell bother to get back to StatsCan whereas the busy ones passed on it or were late? Did holidays—at retailers and maybe StatsCan itself— affect the low collection rate? It would have been nice to see an effort to explain this in StatsCan’s release mind you. Also note that whereas they often provide a qualitative hint at what drove the flash estimate in a sentence or two, this time they said nothing.
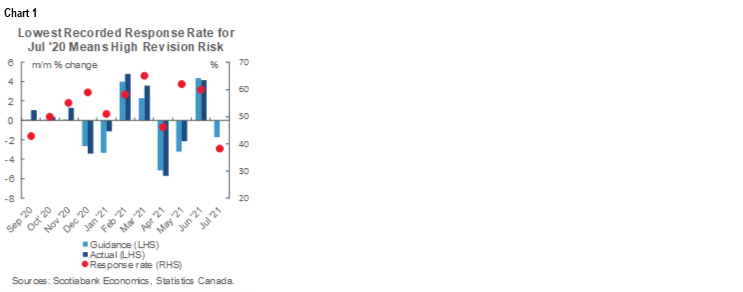
Frankly I’m almost inclined to ignore the July ‘flash’ estimate for now and it’s not clear which direction the complete estimate will land a month from now relative to the flash estimate. Chart 1 also shows what happened to initial flash estimates versus the final reading the only other two times when the response rate was anywhere close to being as low as it was in July. The previous lowest response rate in September saw the initial flash estimate revised up from +0.1% m/m to 1.1%. The next lowest response rate in April 2021 took the final estimate a bit in the other direction (-5.7% m/m, -5.1% flash). Then again, some of the larger revisions to initial flash readings were in months with high response rates. Go figure.
So back to what we can more reasonably focus upon which was the June figures. All of the June gain was through higher volumes (4.1%) which I'm a bit surprised by given rising prices.
The June gain was not enough to save Q2 overall. The volume of retail sales fell 3.4% q/q SAAR in Q2 after a large 6.8% rise in Q1. The way the figures evolved over Q2 and handed off to Q3 'bakes in' 8.2% annualized growth in retail sales volumes into Q3 before we even get any data (chart 2). I'm treating July as a big unknown given the very low sampling rate but the risks to hard goods spending are likely skewed lower in Q3 while retail under samples the services side that people are spending more money on.

Again, like the US and UK, Canadian retail excludes most of the services that are reopening. Swing a club last month? Not in here. Ate out as captured in soaring restaurant reservations (chart 3)? Ditto. Finally ditched the flowbee or amateur snip and got a professional hair cut? Not here. Hit a patio for a few pints with friends? Same. Hopped on a flight, booked a hotel, went to a movie etc etc, all not in here. I went to a drive-in movie with my family for the first time in decades, also not in here. Whether we’re talking US, UK or Canadian retail figures, treat them all with caution because the services part of consumer spending is generally not captured. This is old economy stuff when the only thing you spent money on were things you could touch. We don’t know that it’s an accurate reflection of how consumers spent their money last month. As written about the US and UK numbers, I think this is a global problem with retail figures understating the strength of the consumer to date.

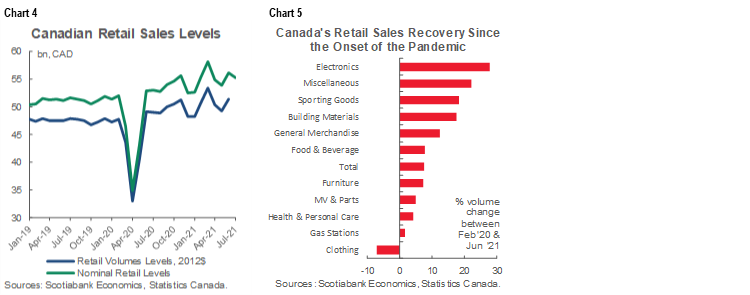
Chart 4 depicts where we presently stand in the cumulative retail recovery with sales still above pre-pandemic levels. The chart incorporates preliminary guidance for July but only for the value of sales since a volume flash is not provided. Chart 5 depicts the cumulative recovery to date across components of retail sales up to June since we don’t have a breakdown of the July flash estimate.
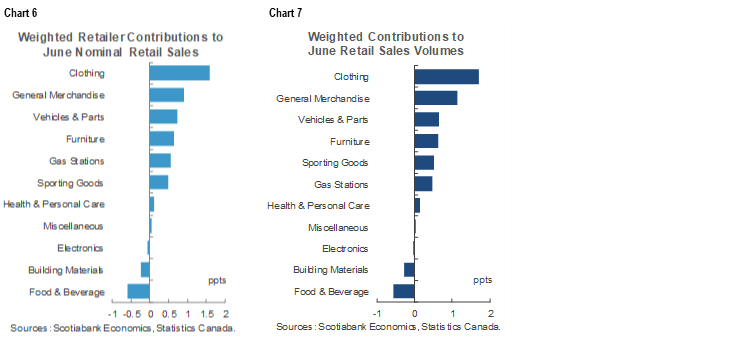
As for details, chart 6 shows what drove the gain in June in unweighted terms and chart 7 shows the weighted contributions. Some of the gains across individual types of retail sales were so powerful they naturally tend to be almost unbelievable. Clothing sales topped the list with a gain of 49% m/m, seasonally adjusted, not-annualized. Yep, 49%. My, you’re a well dressed bunch assuming it’s not still all wfh pajamas. Furniture sales soared 23% m/m so those are some pretty swank living rooms now since of course fancy clothes need nice sofas to sit on to complete the picture. Sporting goods sales were up 27.9% m/m so maybe the clothing they bought was about looking good on the golf course. Autos and parts were up as expected +2.7% m/m. Electronics and appliances fell 2.5% which doesn’t really surprise me since I’m still waiting for a stove ordered back in March! Building materials and garden supply stores fell 3.1% (too late for the gardens…), food/beverage store sales fell 2.6%, gasoline stations sales were up 6% on a combination of higher prices and more driving, health/personal goods were up 1.5%, and general merchandise sales were up 7.4%.
By province, sales growth was fastest in Nova Scotia (+16.3% m/m) but the 11.3% m/m jump in Toronto and 9.8% m/m overall in Ontario played a far bigger role in weighted terms. BC sales were flat (+0.2% m/m) but Vancouver was up 1.6%. Quebec was up 1.4% with Montreal leading (+2.4%); here’s to retailers rooting for the possible return of the Nordiques! Sales fell in Newfoundland and Labrador, PEI, New Brunswick and Saskatchewan.
Now, cross your fingers on the Delta variant’s effects and how long they may last. #mandatory may be the best hope along with a two tier system of access rights.
DISCLAIMER
This report has been prepared by Scotiabank Economics as a resource for the clients of Scotiabank. Opinions, estimates and projections contained herein are our own as of the date hereof and are subject to change without notice. The information and opinions contained herein have been compiled or arrived at from sources believed reliable but no representation or warranty, express or implied, is made as to their accuracy or completeness. Neither Scotiabank nor any of its officers, directors, partners, employees or affiliates accepts any liability whatsoever for any direct or consequential loss arising from any use of this report or its contents.
These reports are provided to you for informational purposes only. This report is not, and is not constructed as, an offer to sell or solicitation of any offer to buy any financial instrument, nor shall this report be construed as an opinion as to whether you should enter into any swap or trading strategy involving a swap or any other transaction. The information contained in this report is not intended to be, and does not constitute, a recommendation of a swap or trading strategy involving a swap within the meaning of U.S. Commodity Futures Trading Commission Regulation 23.434 and Appendix A thereto. This material is not intended to be individually tailored to your needs or characteristics and should not be viewed as a “call to action” or suggestion that you enter into a swap or trading strategy involving a swap or any other transaction. Scotiabank may engage in transactions in a manner inconsistent with the views discussed this report and may have positions, or be in the process of acquiring or disposing of positions, referred to in this report.
Scotiabank, its affiliates and any of their respective officers, directors and employees may from time to time take positions in currencies, act as managers, co-managers or underwriters of a public offering or act as principals or agents, deal in, own or act as market makers or advisors, brokers or commercial and/or investment bankers in relation to securities or related derivatives. As a result of these actions, Scotiabank may receive remuneration. All Scotiabank products and services are subject to the terms of applicable agreements and local regulations. Officers, directors and employees of Scotiabank and its affiliates may serve as directors of corporations.
Any securities discussed in this report may not be suitable for all investors. Scotiabank recommends that investors independently evaluate any issuer and security discussed in this report, and consult with any advisors they deem necessary prior to making any investment.
This report and all information, opinions and conclusions contained in it are protected by copyright. This information may not be reproduced without the prior express written consent of Scotiabank.
™ Trademark of The Bank of Nova Scotia. Used under license, where applicable.
Scotiabank, together with “Global Banking and Markets”, is a marketing name for the global corporate and investment banking and capital markets businesses of The Bank of Nova Scotia and certain of its affiliates in the countries where they operate, including; Scotiabank Europe plc; Scotiabank (Ireland) Designated Activity Company; Scotiabank Inverlat S.A., Institución de Banca Múltiple, Grupo Financiero Scotiabank Inverlat, Scotia Inverlat Casa de Bolsa, S.A. de C.V., Grupo Financiero Scotiabank Inverlat, Scotia Inverlat Derivados S.A. de C.V. – all members of the Scotiabank group and authorized users of the Scotiabank mark. The Bank of Nova Scotia is incorporated in Canada with limited liability and is authorised and regulated by the Office of the Superintendent of Financial Institutions Canada. The Bank of Nova Scotia is authorized by the UK Prudential Regulation Authority and is subject to regulation by the UK Financial Conduct Authority and limited regulation by the UK Prudential Regulation Authority. Details about the extent of The Bank of Nova Scotia's regulation by the UK Prudential Regulation Authority are available from us on request. Scotiabank Europe plc is authorized by the UK Prudential Regulation Authority and regulated by the UK Financial Conduct Authority and the UK Prudential Regulation Authority.
Scotiabank Inverlat, S.A., Scotia Inverlat Casa de Bolsa, S.A. de C.V, Grupo Financiero Scotiabank Inverlat, and Scotia Inverlat Derivados, S.A. de C.V., are each authorized and regulated by the Mexican financial authorities.
Not all products and services are offered in all jurisdictions. Services described are available in jurisdictions where permitted by law.