- Core inflation gauges ebbed in July
- The core inflation trend isn’t screaming out for rate cuts
- Wild revisions and wonky SA factors lessen data reliability
- Mild market reaction awaits much further evidence…
- ...to inform the BoC’s next steps including September’s decision
- Canadian CPI, m/m // y/y %, NSA, July:
- Actual: 0.30 / 1.7
- Scotia: 0.5 / 1.9
- Consensus: 0.3 / 1.8
- Prior: 0.1 / 1.9
- Trimmed mean CPI m/m % SAAR: 2.25
- Weighted median CPI m/m % SAAR: 2.2
- Traditional core CPI m/m % SAAR: 0.8
Measures of core inflation were softer in July but it’s just one set of readings ahead of a lot of further information on the road to the next Bank of Canada decision on September 17th. That’s probably why the market reactions were fairly muted. There are also serious questions to be raised regarding data reliability.
Muted Market Reaction
Canada’s 2-year GoC yield fell by about 5bps post-data with some of that due to position covering after the yield was rising into the data. USDCAD moved up by just over a third of a cent perhaps also influenced by stronger than expected US housing starts (+5.2% m/m SA, -1.8% consensus). OIS markets added a couple of basis points to September cut pricing that now stands at about 9–10bps and hence material but well shy of being priced.
Softer Core Gauges
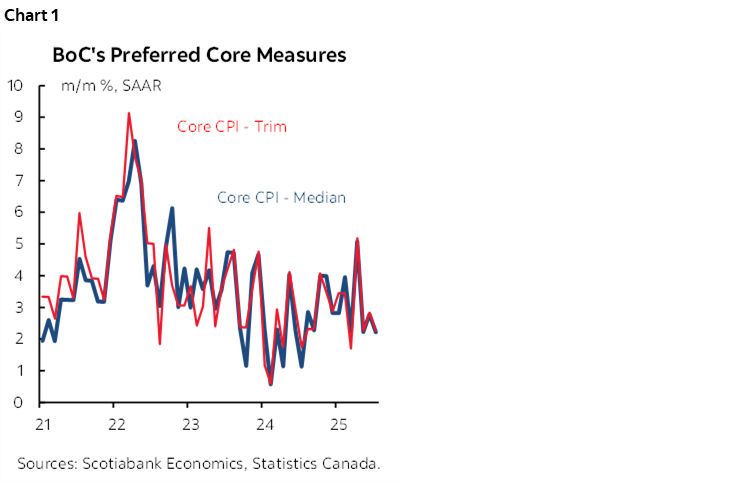
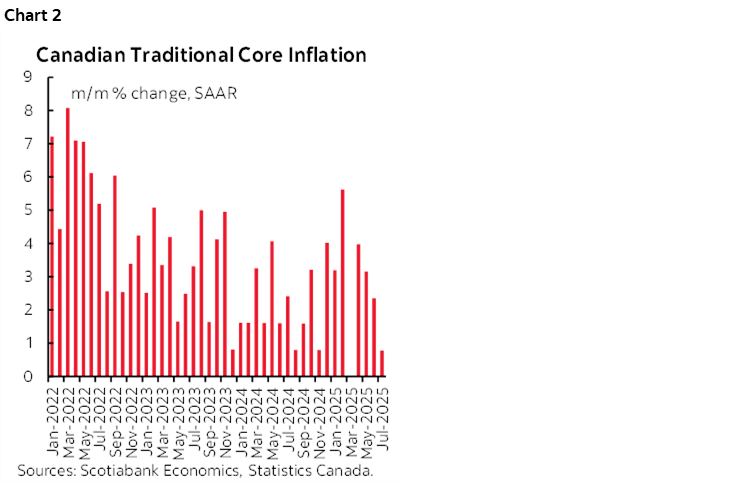
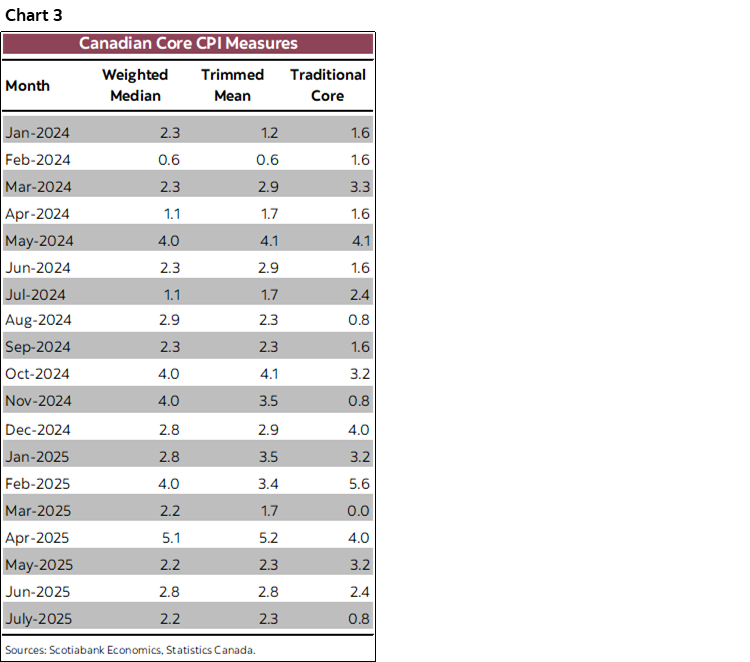
Trimmed mean CPI and weighted median CPI both landed at about 2¼% m/m at a seasonally adjusted and annualized rate in July (chart 1). Traditional core CPI was even lighter at 0.8% m/m SAAR (chart 2). Chart 3 lays out the numbers over time. The yearly trimmed mean (3%) and weighted median (3.1%) measures are not spot y/y calculations but get referenced by the BoC and remain at the top end of the inflation target range.
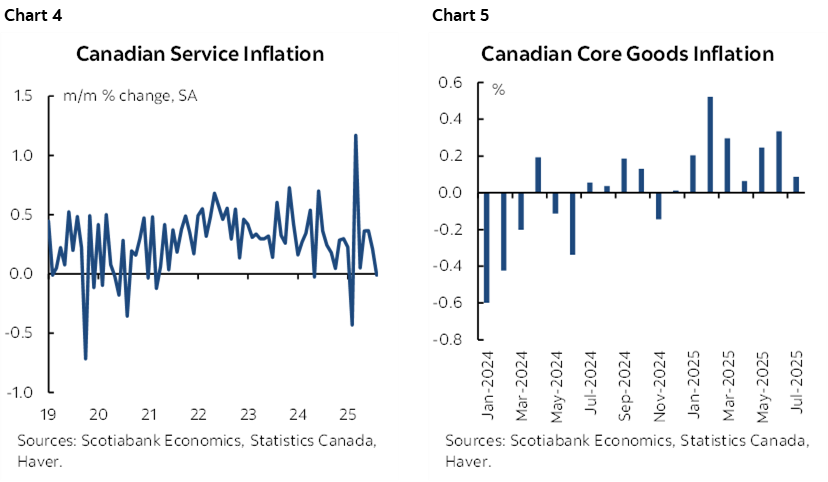
Service Price Inflation Ebbed
The key driver was cooler service price inflation (chart 4) which largely ground to a halt in July. Core goods inflation (ex-food and energy) also softened (chart 5).
Two Concerns About Data Reliability
Before turning to other details and Bank of Canada implications, there are two main issues with data reliability. One concerns Statcan’s seasonal adjustments. The other concerns wild revisions.
On the first one, why did Statcan opt for the lowest seasonal adjustment factor on record for traditional core CPI when comparing like months of July (chart 6)? There is a recency bias to how SA factors are calculated that is slanted to the experiences of recent years that may not be appropriate if distortions to seasonality in and after the pandemic are less representative now. What judgement might Statcan instead apply, or alternative methods of calculating SA factors, if there are outlier estimates of SA factors that stick out so much?
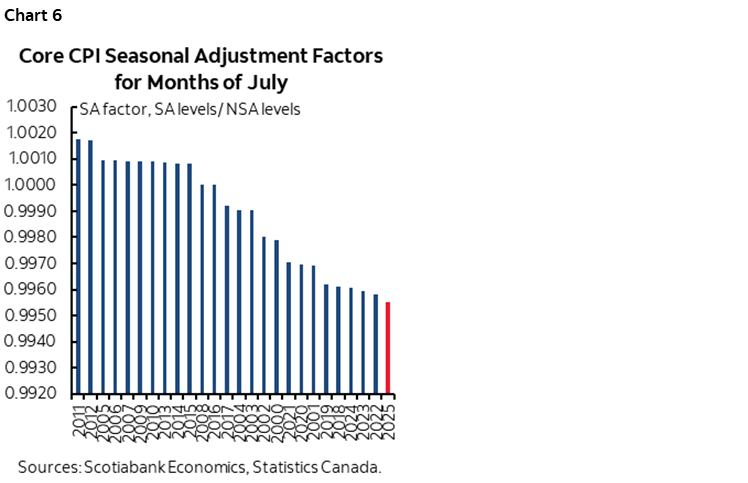
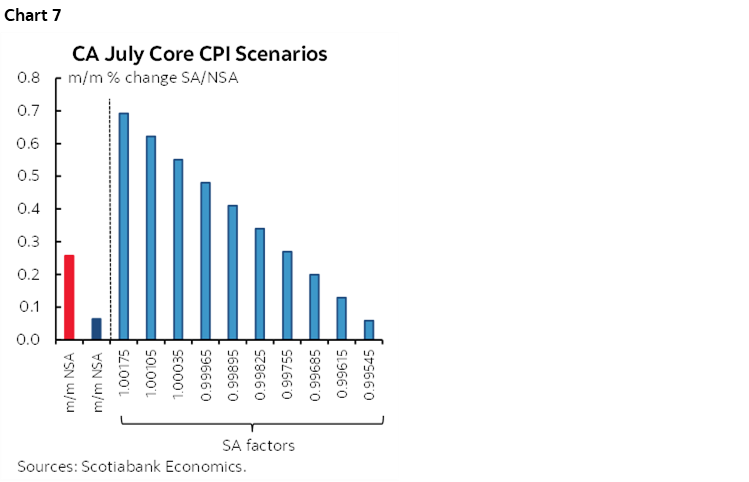
How much? Chart 7 shows what core CPI would have been at any other SA factor than the one they chose which is the far right bar. Instead of 0.1% m/m SA core CPI nonannualized, we could have easily gotten a materially higher estimate at a different SA factor. Again, if Statcan put some effort into explaining why they think this is an appropriate SA factor to use, then ok, we’ll have something to judge. But they just lob it out there and hide behind a model subject to recency bias without digging deeper.
On the second data concern, check out chart 8. It’s an ugly one, but it effectively makes the point. Statcan applied large revisions to the main core inflation readings over many months this morning. The chart shows the revisions to m/m SAAR readings for both core inflation gauges. It’s fair to say that when fresh numbers for these gauges are released, markets should apply about a +/-½% m/m SAAR bracket around the estimates based on this pattern.
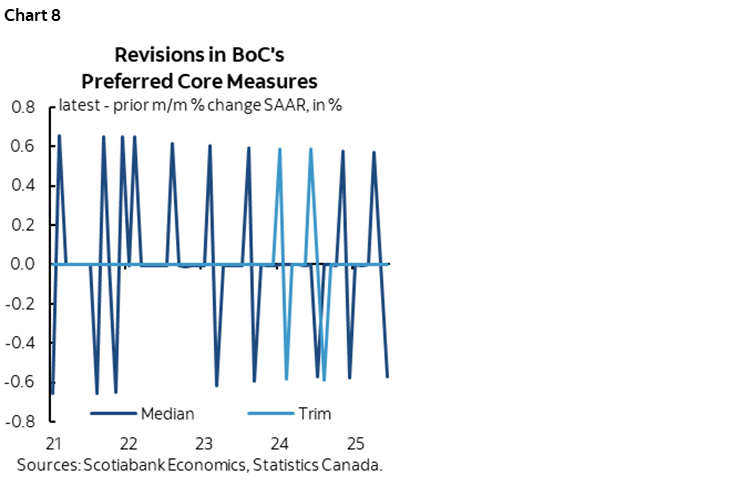
The revisions included the month of June with that month’s weighted median CPI reading being bumped down a half point to 2.8% m/m SAAR. Traditional core CPI was bumped down by a larger 0.7 points to 2.4%. Only trimmed mean was left unchanged at 2.8% in June with no revision.
The revisions and fresh data for July combine to change the math somewhat on the trend in price pressures. On a three-month moving average basis, trimmed mean CPI is now running at 2.4%, weighted median CPI is now at 2.5%, and traditional core CPI is 2.1% all on a seasonally adjusted and annualized basis.
Statcan needs to provide a decomposition of the reasons behind these large revisions. Is it having the same problem with obtaining adequate data as the BLS is having in the US? Does fresh price data really arrive with such long lags months, quarters, even years later to merit sudden revisions and if so, then why? Are there methodological changes, or errors being applied?
Bank of Canada Implications
In any event, based on the data as it stands now, those are not light core inflation readings, and they’re definitely not undershooting the BoC’s 2% inflation target, but they are back in the confines of the BoC’s 1–3% target range for headline inflation while using core gauges as the more stable way of operationalizing achievement of this target range. That balances the risks to the rate outlook a little more than previously.
The BoC couldn’t base further easing from what is already a roughly neutral policy rate on such numbers in my opinion. They would either need more evidence of downside risk to inflation tracking that may or may not arrive with further data, or high confidence in their ability to forecast price pressures which doesn’t seem to be in vogue at the BoC that continues to avoid a base case projection.
DETAILS
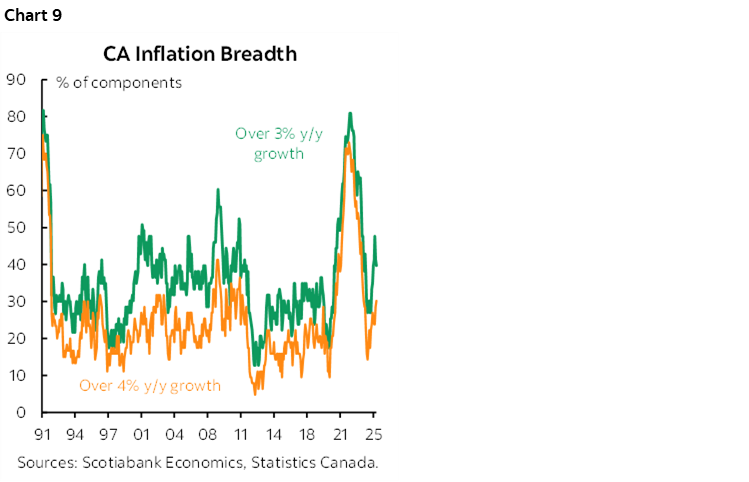
Turning to a breakdown of the basket, chart 9 illustrates what’s going on with the breadth of price increases in the CPI basket. About 40% of the basket is rising by more than 3% y/y and about 30% of the basket is rising by over 4%. The breadth of price pressures remains disconcerting.
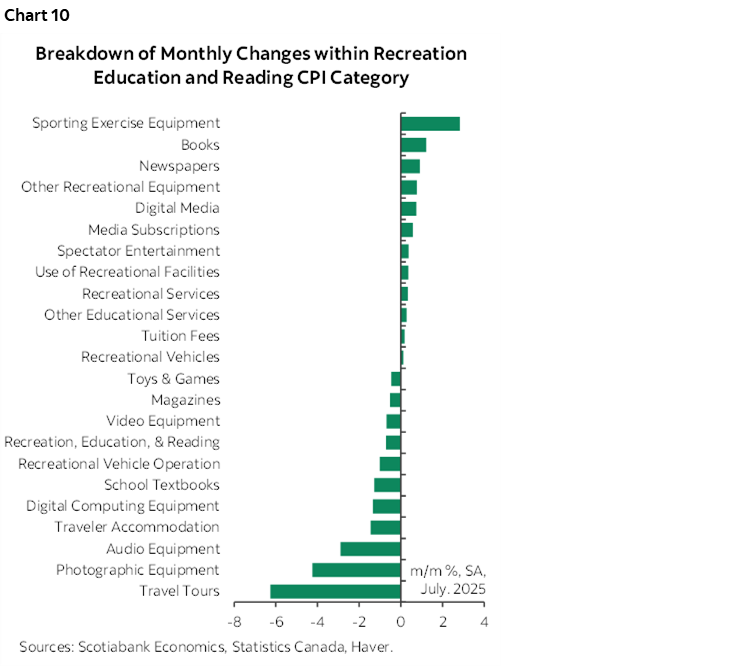
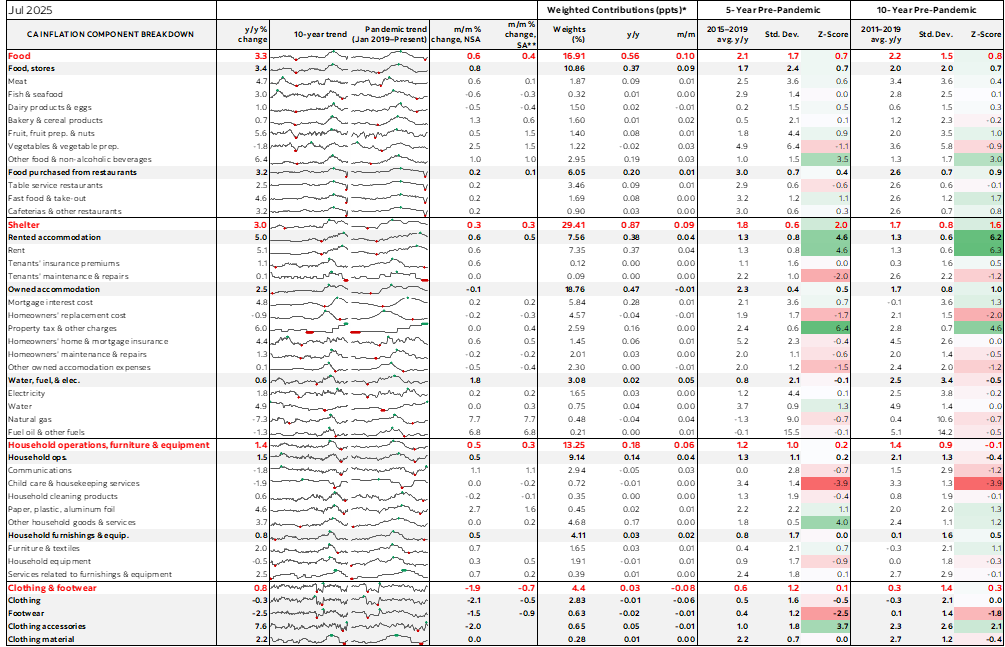
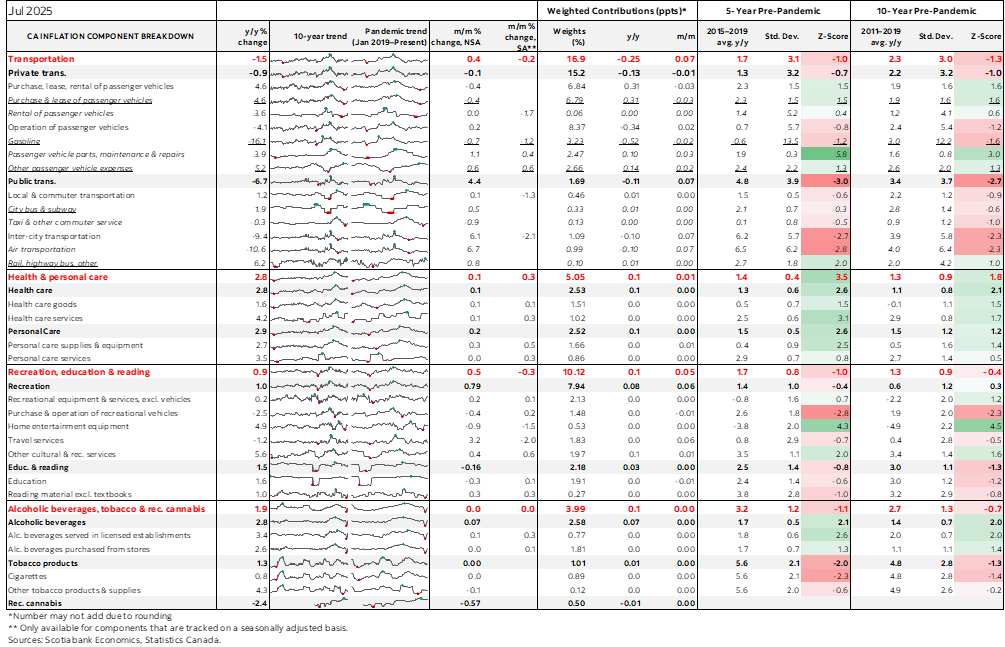
Charts 10–19 provide illustrations of some of the key components. The leisure category—”recreation, reading and education”—fell –0.3% m/m SA with contributing factors such as travel tours and traveler accommodation. It’s unclear whether that’s temporary or not, but wildfires across much of the country may have inhibited travel and tourism.
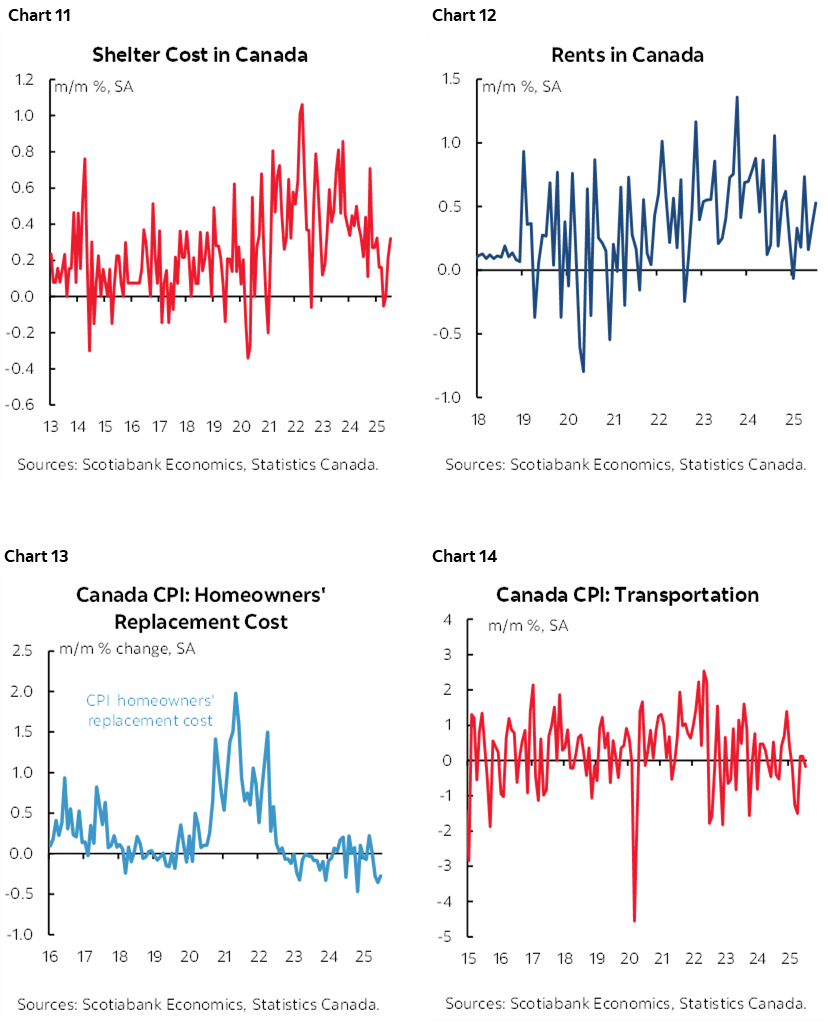
Shelter cost inflation moved up including through rent, but house prices as captured in CPI exerted some downward pressure.
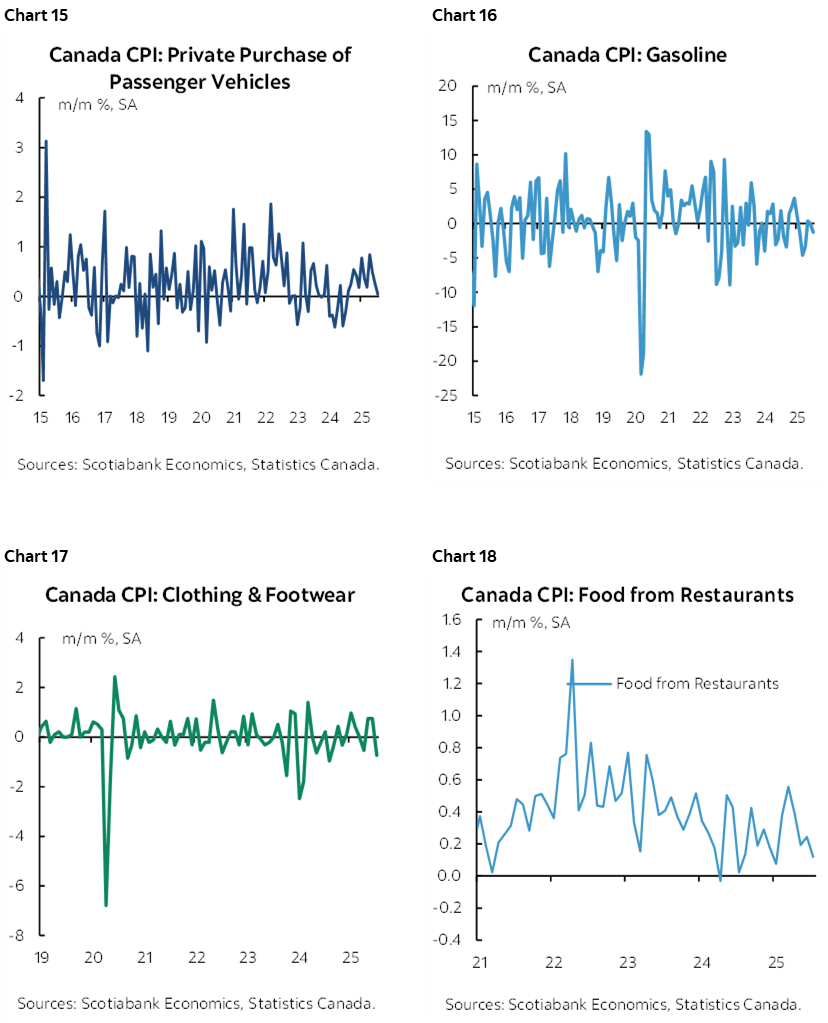
Transportation prices were soft including both gas prices and vehicle prices.
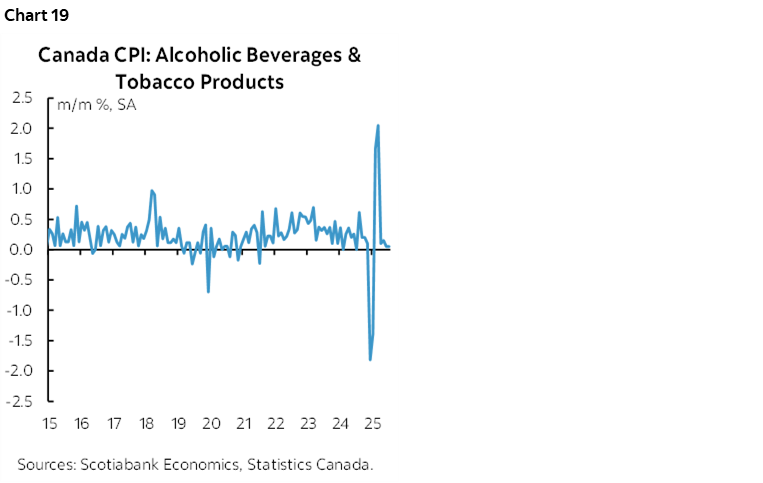
Clothing, restaurant prices and the so-called ‘sins’ prices were also relatively soft.
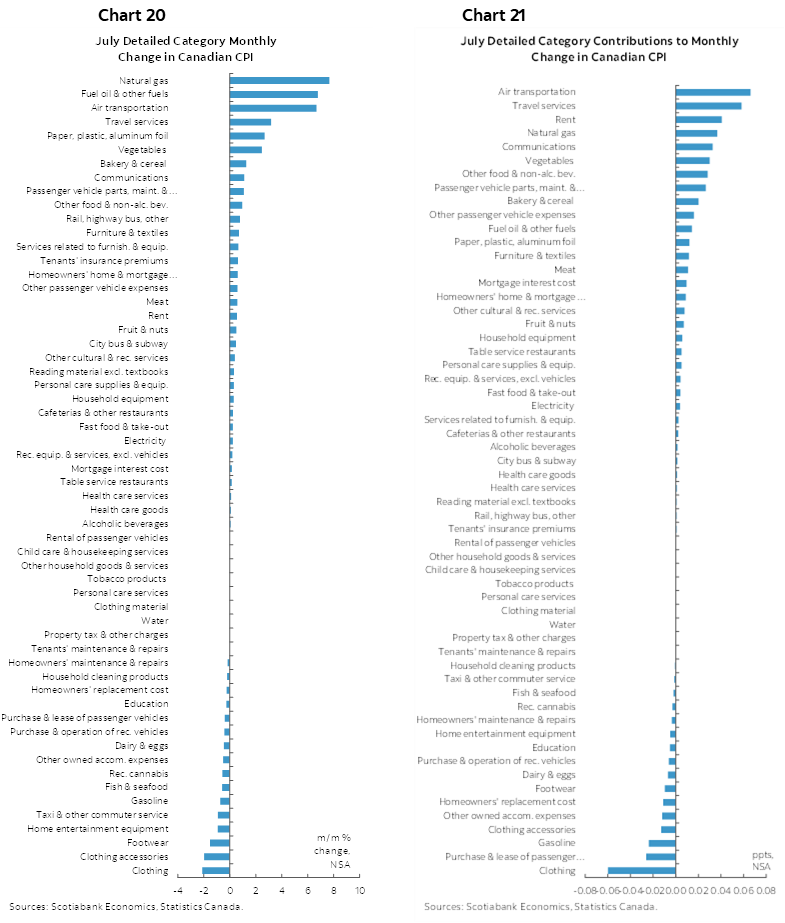
Charts 20–21 provide a fuller breakdown of the CPI basket in m/m % terms and weighted contributions to m/m % changes in CPI.
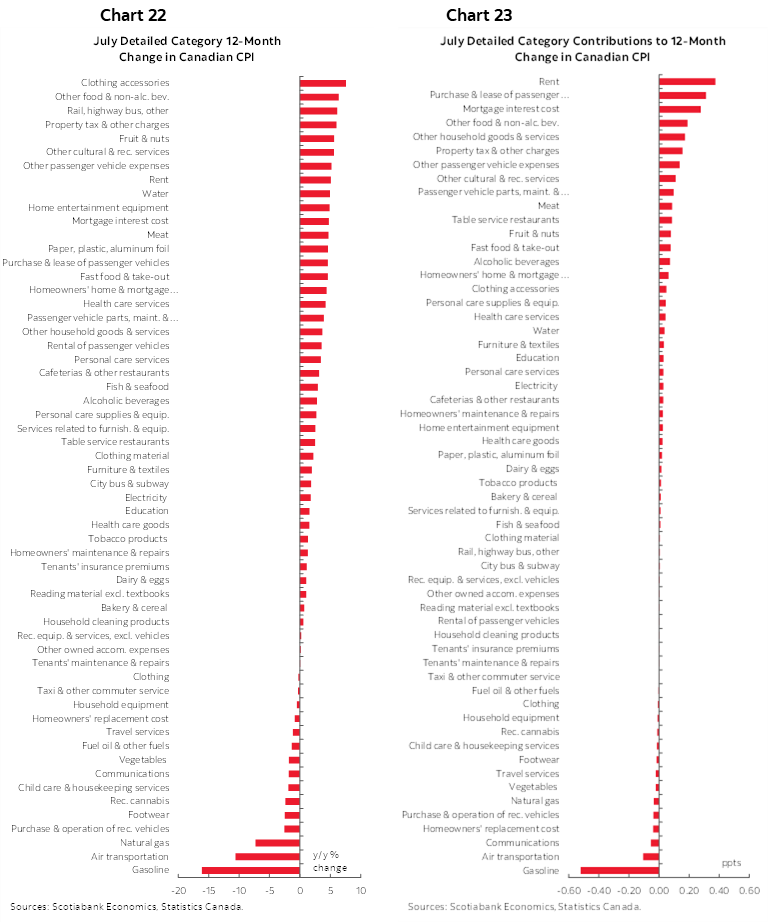
Charts 22–23 do likewise for the y/y measures.
Please also see the accompanying table that provides greater detail.
DISCLAIMER
This report has been prepared by Scotiabank Economics as a resource for the clients of Scotiabank. Opinions, estimates and projections contained herein are our own as of the date hereof and are subject to change without notice. The information and opinions contained herein have been compiled or arrived at from sources believed reliable but no representation or warranty, express or implied, is made as to their accuracy or completeness. Neither Scotiabank nor any of its officers, directors, partners, employees or affiliates accepts any liability whatsoever for any direct or consequential loss arising from any use of this report or its contents.
These reports are provided to you for informational purposes only. This report is not, and is not constructed as, an offer to sell or solicitation of any offer to buy any financial instrument, nor shall this report be construed as an opinion as to whether you should enter into any swap or trading strategy involving a swap or any other transaction. The information contained in this report is not intended to be, and does not constitute, a recommendation of a swap or trading strategy involving a swap within the meaning of U.S. Commodity Futures Trading Commission Regulation 23.434 and Appendix A thereto. This material is not intended to be individually tailored to your needs or characteristics and should not be viewed as a “call to action” or suggestion that you enter into a swap or trading strategy involving a swap or any other transaction. Scotiabank may engage in transactions in a manner inconsistent with the views discussed this report and may have positions, or be in the process of acquiring or disposing of positions, referred to in this report.
Scotiabank, its affiliates and any of their respective officers, directors and employees may from time to time take positions in currencies, act as managers, co-managers or underwriters of a public offering or act as principals or agents, deal in, own or act as market makers or advisors, brokers or commercial and/or investment bankers in relation to securities or related derivatives. As a result of these actions, Scotiabank may receive remuneration. All Scotiabank products and services are subject to the terms of applicable agreements and local regulations. Officers, directors and employees of Scotiabank and its affiliates may serve as directors of corporations.
Any securities discussed in this report may not be suitable for all investors. Scotiabank recommends that investors independently evaluate any issuer and security discussed in this report, and consult with any advisors they deem necessary prior to making any investment.
This report and all information, opinions and conclusions contained in it are protected by copyright. This information may not be reproduced without the prior express written consent of Scotiabank.
™ Trademark of The Bank of Nova Scotia. Used under license, where applicable.
Scotiabank, together with “Global Banking and Markets”, is a marketing name for the global corporate and investment banking and capital markets businesses of The Bank of Nova Scotia and certain of its affiliates in the countries where they operate, including; Scotiabank Europe plc; Scotiabank (Ireland) Designated Activity Company; Scotiabank Inverlat S.A., Institución de Banca Múltiple, Grupo Financiero Scotiabank Inverlat, Scotia Inverlat Casa de Bolsa, S.A. de C.V., Grupo Financiero Scotiabank Inverlat, Scotia Inverlat Derivados S.A. de C.V. – all members of the Scotiabank group and authorized users of the Scotiabank mark. The Bank of Nova Scotia is incorporated in Canada with limited liability and is authorised and regulated by the Office of the Superintendent of Financial Institutions Canada. The Bank of Nova Scotia is authorized by the UK Prudential Regulation Authority and is subject to regulation by the UK Financial Conduct Authority and limited regulation by the UK Prudential Regulation Authority. Details about the extent of The Bank of Nova Scotia's regulation by the UK Prudential Regulation Authority are available from us on request. Scotiabank Europe plc is authorized by the UK Prudential Regulation Authority and regulated by the UK Financial Conduct Authority and the UK Prudential Regulation Authority.
Scotiabank Inverlat, S.A., Scotia Inverlat Casa de Bolsa, S.A. de C.V, Grupo Financiero Scotiabank Inverlat, and Scotia Inverlat Derivados, S.A. de C.V., are each authorized and regulated by the Mexican financial authorities.
Not all products and services are offered in all jurisdictions. Services described are available in jurisdictions where permitted by law.