

- US core inflation came in fairly tame during July
- Markets continue to scale back Fed hike pricing
- US CPI / core CPI, m/m %, SA, July:
- Actual: 0.074 / 0.215
- Scotia: 0.2 / 0.3
- Consensus: 0.1 / 0.2
- Prior: -0.4 / 0.0
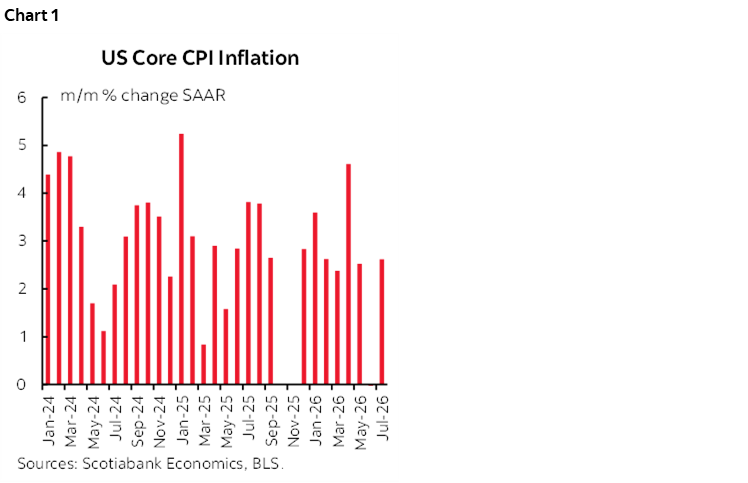
US CPI came and went with little market fanfare. Core inflation landed on the generous side of consensus at 0.215% m/m SA as core goods and core services inflation picked up.
Pricing for the September FOMC meeting slipped and now sits at just 10bps, down sharply from a peak of 27bps toward the end of July. I still think there is merit to receiving. It’s pretty clear to date that markets have been overly aggressive in pricing nearer term hikes as July’s 8bps of tightening was countered by a hold and September keeps getting reduced. The 2-year Treasury yield has fallen by about 15bps over the period since late July to 4.18% now with bonds becoming more and more attractive. Perhaps this illustrates the point that Chair Warsh shouldn’t outsource monetary policy to markets which has merely upped volatility. Just like 2023 with SVB, or the post-GFC period when markets wrongly thought inflation would rip higher.
The three-month moving average of core inflation is now 1.65% m/m SAAR which does not scream hike. June's -0.2% m/m SAAR is straddled by 2.5% and 2.6% readings (chart 1).
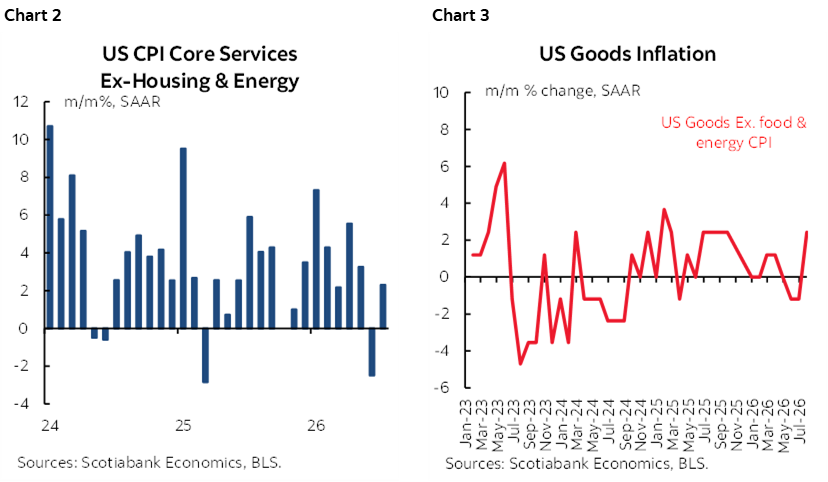
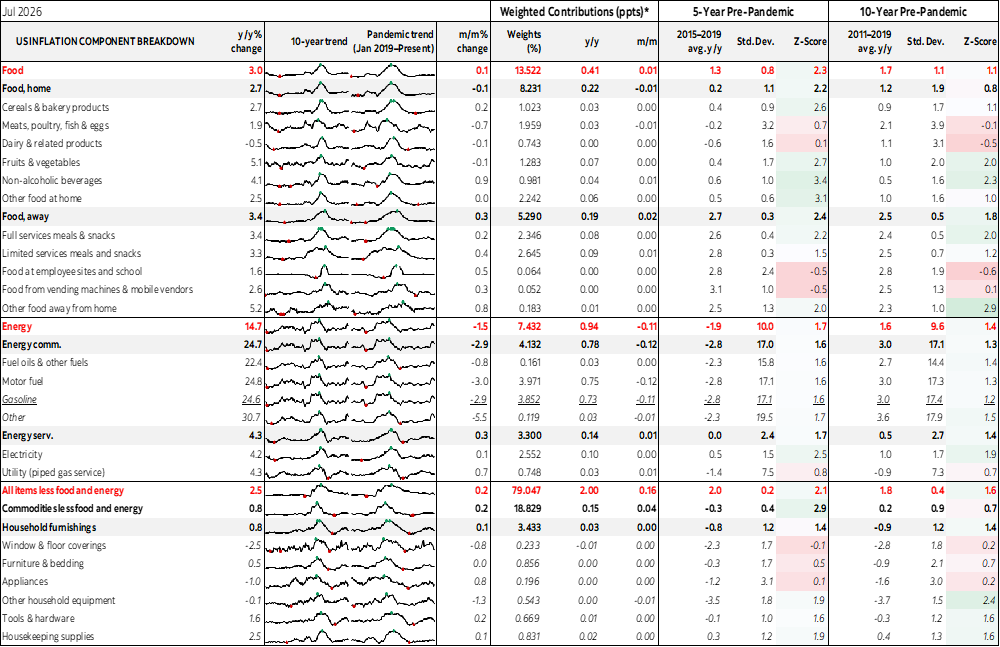
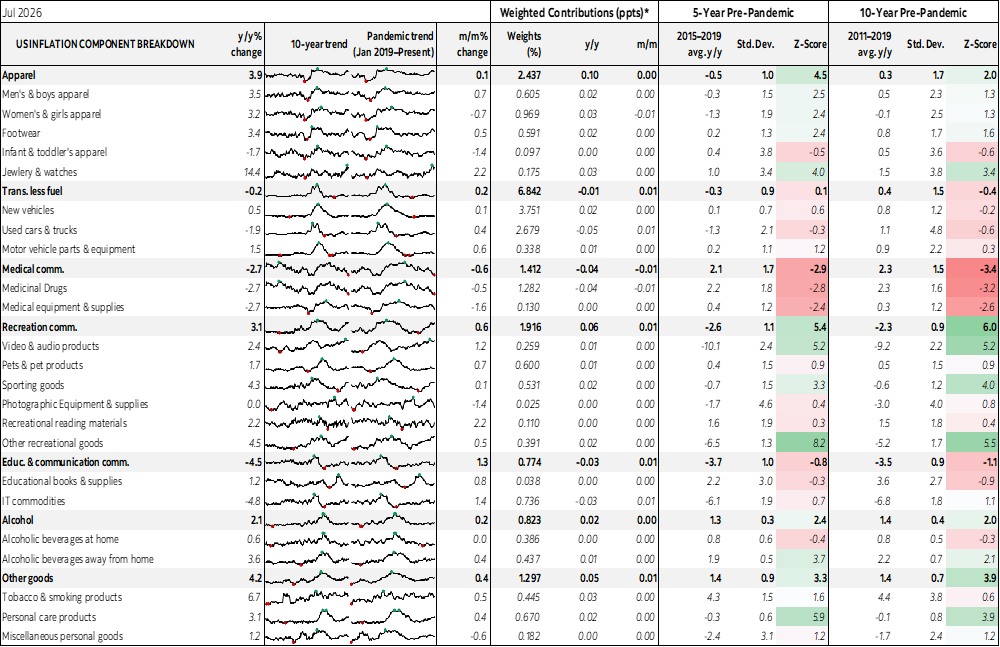
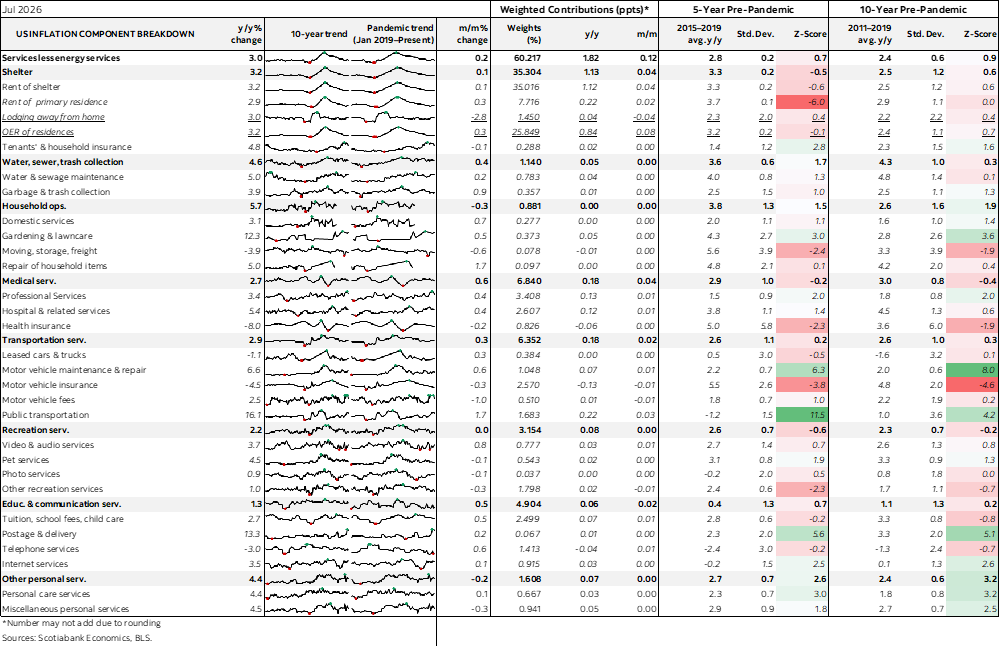
Supercore services CPI (services ex-housing services and energy services) did indeed accelerate to +0.2% m/m SA (chart 2). Core goods inflation also picked up (chart 3).
Taking account of weighting differences between CPI and PCE reveals headline PCE tracking at 0.1% m/m SA and core at 0.18% m/m SA. We need select components of tomorrow's PPI to firm up the PCE estimates
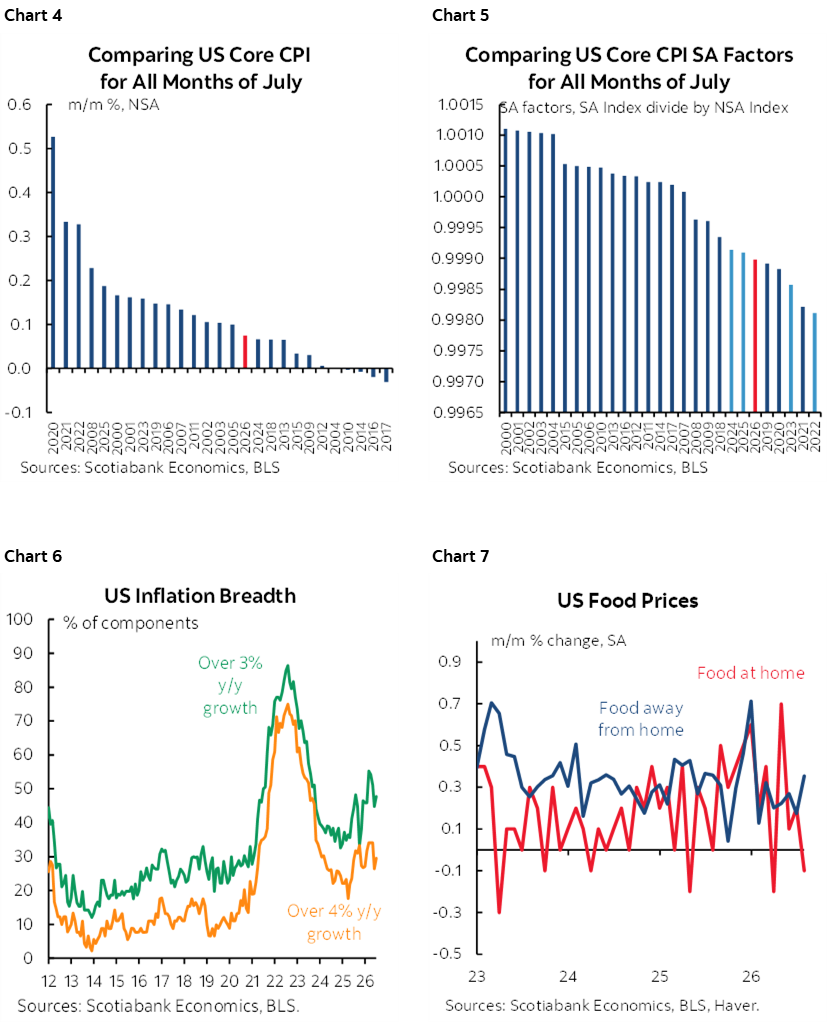
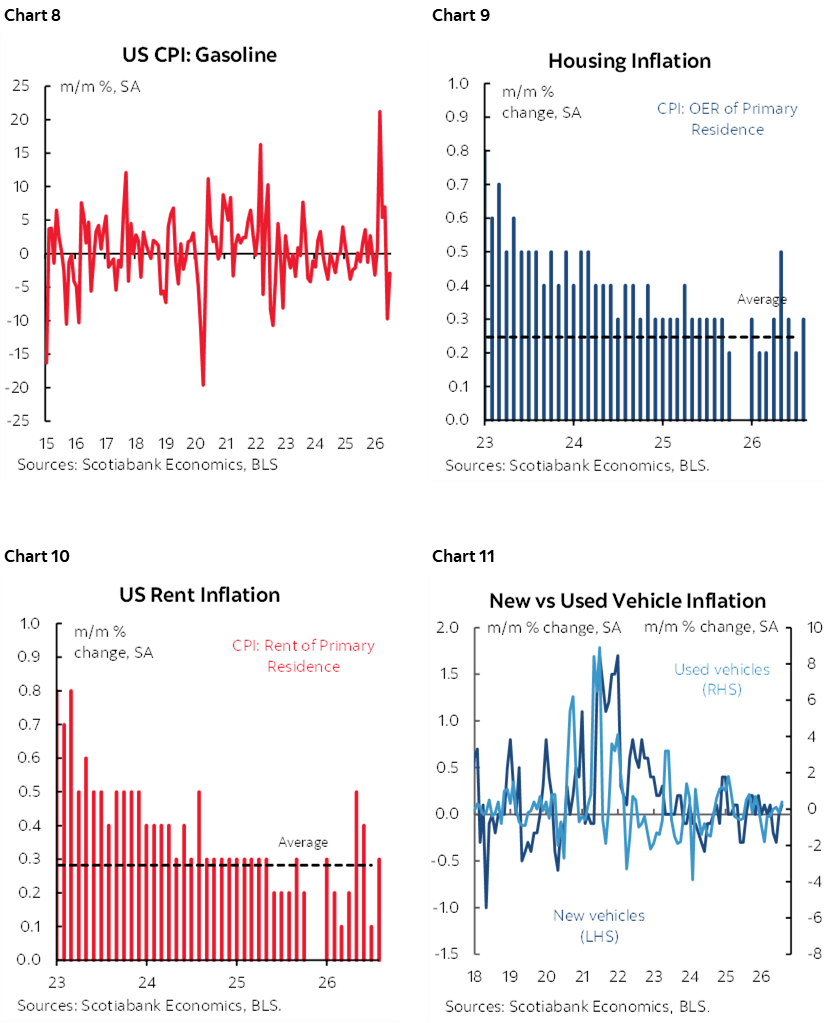
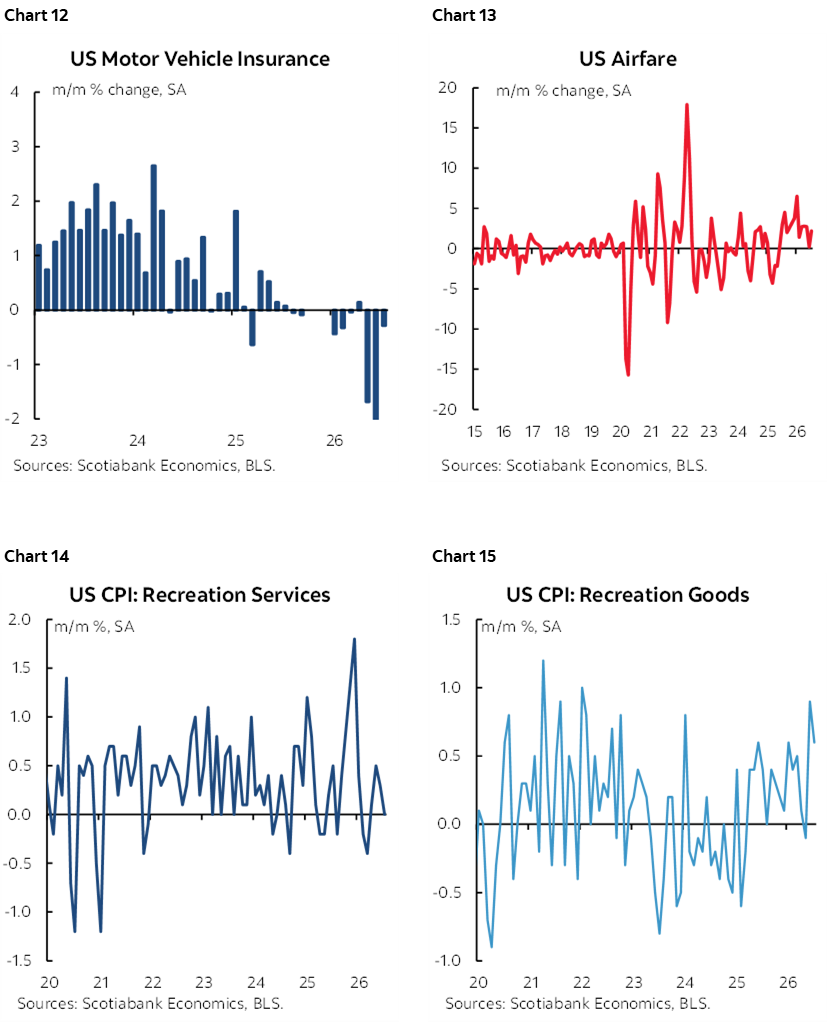
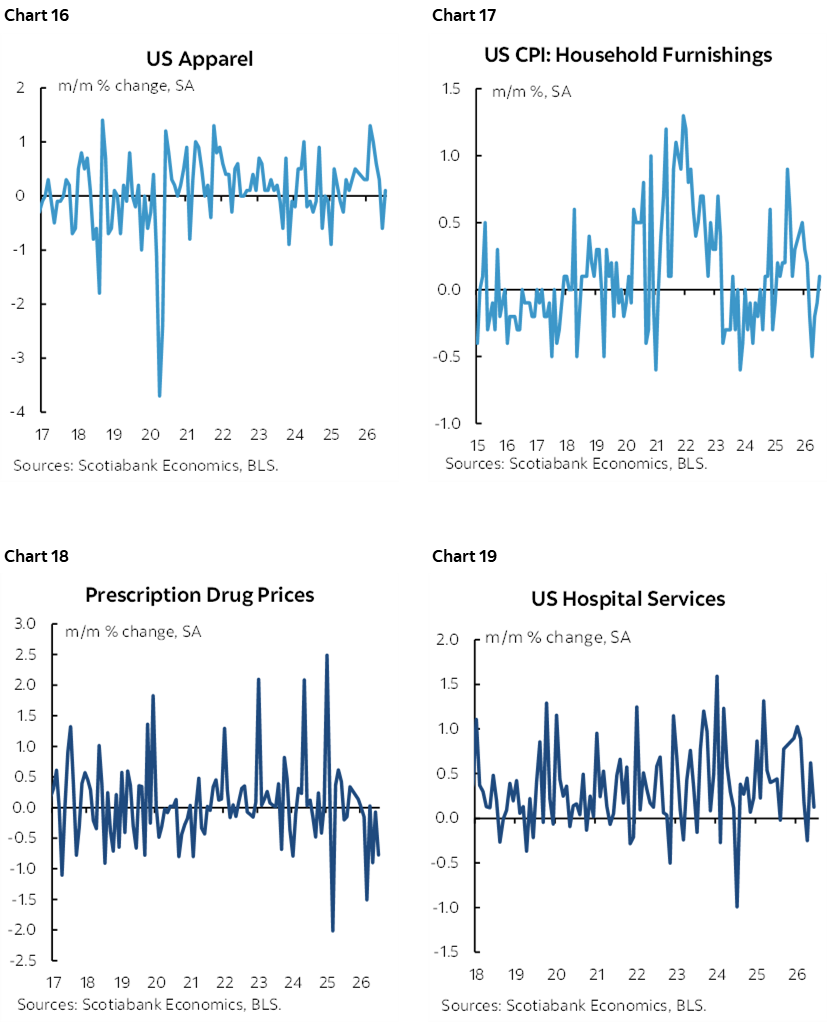
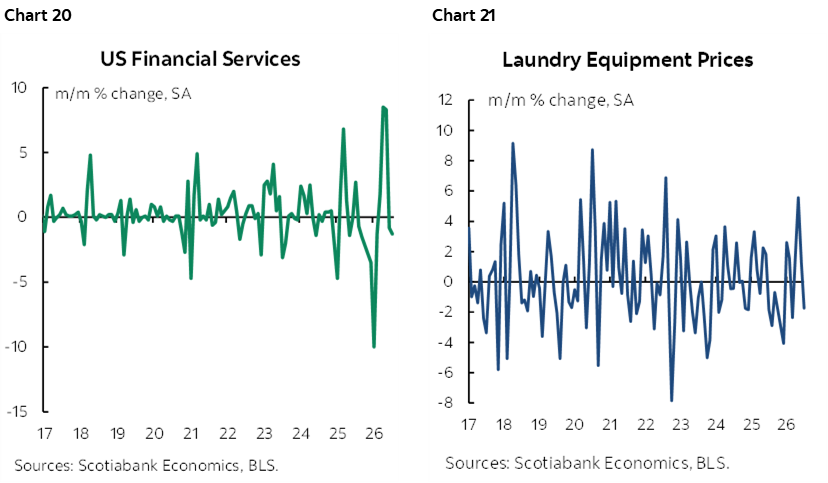
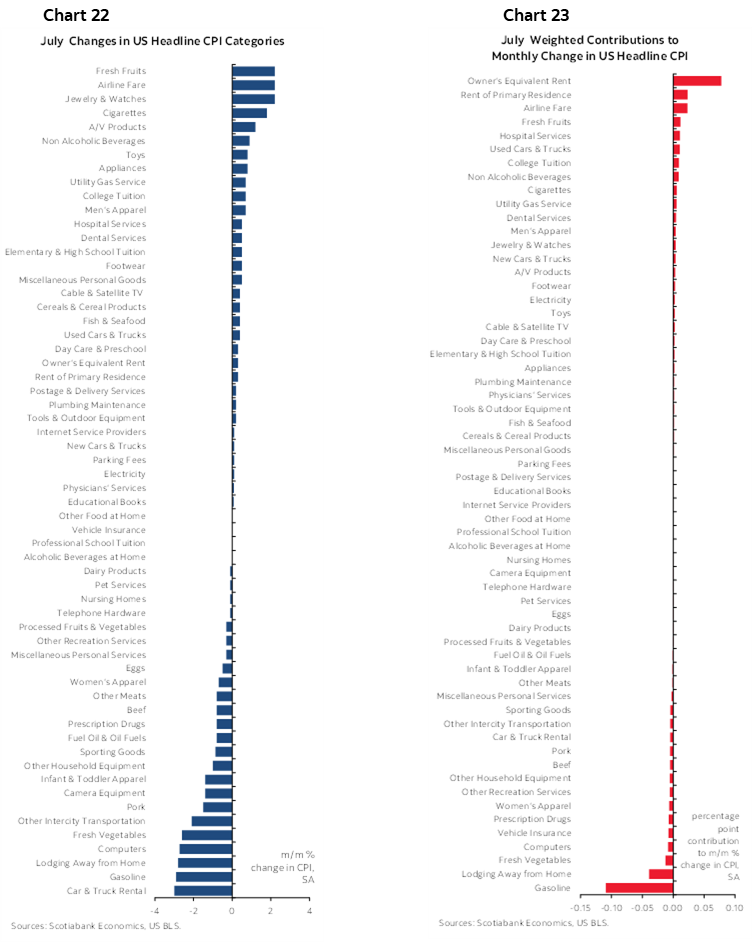
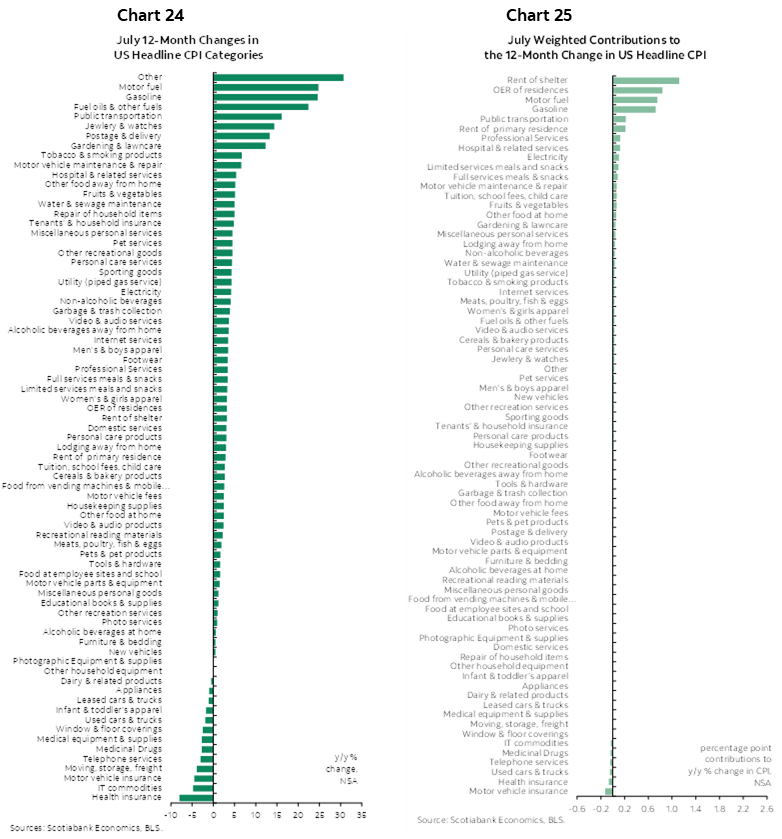
Please refer to the chartapalooza on the following pages for more trends including charts that show weighted contributions to y/y and m/m inflation by component. The table at the back offers further detail, micro charts and additional measures.
Watch for the Cleveland Fed’s trimmed mean and weighted median measures plus the BLS figure for the share of the basket estimated by proxy methods.
DISCLAIMER
This report has been prepared by Scotiabank Economics as a resource for the clients of Scotiabank. Opinions, estimates and projections contained herein are our own as of the date hereof and are subject to change without notice. The information and opinions contained herein have been compiled or arrived at from sources believed reliable but no representation or warranty, express or implied, is made as to their accuracy or completeness. Neither Scotiabank nor any of its officers, directors, partners, employees or affiliates accepts any liability whatsoever for any direct or consequential loss arising from any use of this report or its contents.
These reports are provided to you for informational purposes only. This report is not, and is not constructed as, an offer to sell or solicitation of any offer to buy any financial instrument, nor shall this report be construed as an opinion as to whether you should enter into any swap or trading strategy involving a swap or any other transaction. The information contained in this report is not intended to be, and does not constitute, a recommendation of a swap or trading strategy involving a swap within the meaning of U.S. Commodity Futures Trading Commission Regulation 23.434 and Appendix A thereto. This material is not intended to be individually tailored to your needs or characteristics and should not be viewed as a “call to action” or suggestion that you enter into a swap or trading strategy involving a swap or any other transaction. Scotiabank may engage in transactions in a manner inconsistent with the views discussed this report and may have positions, or be in the process of acquiring or disposing of positions, referred to in this report.
Scotiabank, its affiliates and any of their respective officers, directors and employees may from time to time take positions in currencies, act as managers, co-managers or underwriters of a public offering or act as principals or agents, deal in, own or act as market makers or advisors, brokers or commercial and/or investment bankers in relation to securities or related derivatives. As a result of these actions, Scotiabank may receive remuneration. All Scotiabank products and services are subject to the terms of applicable agreements and local regulations. Officers, directors and employees of Scotiabank and its affiliates may serve as directors of corporations.
Any securities discussed in this report may not be suitable for all investors. Scotiabank recommends that investors independently evaluate any issuer and security discussed in this report, and consult with any advisors they deem necessary prior to making any investment.
This report and all information, opinions and conclusions contained in it are protected by copyright. This information may not be reproduced without the prior express written consent of Scotiabank.
™ Trademark of The Bank of Nova Scotia. Used under license, where applicable.
Scotiabank, together with “Global Banking and Markets”, is a marketing name for the global corporate and investment banking and capital markets businesses of The Bank of Nova Scotia and certain of its affiliates in the countries where they operate, including; Scotiabank Europe plc; Scotiabank (Ireland) Designated Activity Company; Scotiabank Inverlat S.A., Institución de Banca Múltiple, Grupo Financiero Scotiabank Inverlat, Scotia Inverlat Casa de Bolsa, S.A. de C.V., Grupo Financiero Scotiabank Inverlat, Scotia Inverlat Derivados S.A. de C.V. – all members of the Scotiabank group and authorized users of the Scotiabank mark. The Bank of Nova Scotia is incorporated in Canada with limited liability and is authorised and regulated by the Office of the Superintendent of Financial Institutions Canada. The Bank of Nova Scotia is authorized by the UK Prudential Regulation Authority and is subject to regulation by the UK Financial Conduct Authority and limited regulation by the UK Prudential Regulation Authority. Details about the extent of The Bank of Nova Scotia's regulation by the UK Prudential Regulation Authority are available from us on request. Scotiabank Europe plc is authorized by the UK Prudential Regulation Authority and regulated by the UK Financial Conduct Authority and the UK Prudential Regulation Authority.
Scotiabank Inverlat, S.A., Scotia Inverlat Casa de Bolsa, S.A. de C.V, Grupo Financiero Scotiabank Inverlat, and Scotia Inverlat Derivados, S.A. de C.V., are each authorized and regulated by the Mexican financial authorities.
Not all products and services are offered in all jurisdictions. Services described are available in jurisdictions where permitted by law.