

- Core CPI was warm again, matching our above-consensus estimate…
- …but early translation into core PCE is a bit milder
- Markets reinforced post-Waller reaction by leaning further toward upsizing
- Three reasons why upsizing could be a mistake
- BoC pricing was lifted back to a December coin-toss
- US CPI / core CPI, m/m %, SA, October:
- Actual: 0.4 / 0.3
- Scotia: 0.3 / 0.3
- Consensus: 0.3 / 0.2
- Prior: 0.6 / 0.3
US core CPI landed above consensus and on my estimate at 0.3% m/m SA (0.296% m/m to be exact, hence no rounding effect). When paired with Governor Waller’s pre-data remark that indicated he would lean toward 50bps on December 9th on such a reading the result is that US short-term yields are spiking. The USD 2-year yield is up 17bps on the day including about a dozen points after CPI to add to the sell off post Waller. Pricing for the December FOMC meeting crossed above a quarter point at about 28bps. The result also raised pricing for the BoC’s next decision to about 13bps of a hike in December.
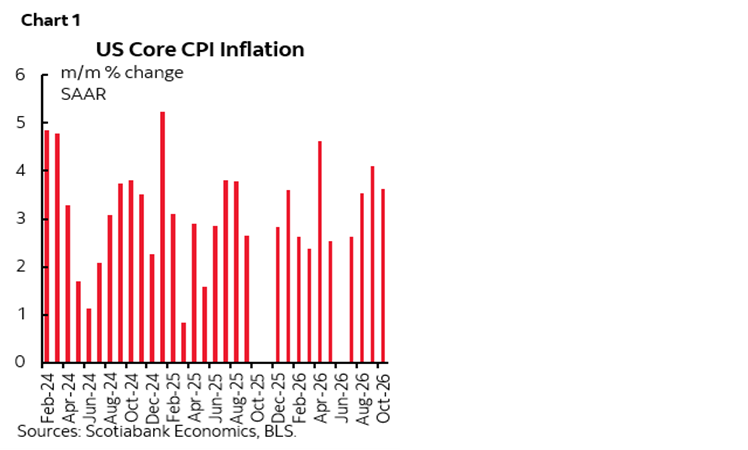
Core CPI was up 3.6% m/m SAAR which continues the elevated readings of prior months (chart 1).
REASONS TO BALK AT UPSIZING
Watch for the views of other FOMC officials today and see my morning note for views on how I think upsizing on backward data could be a misstep. That could be one reason for why other voting officials may balk at upsizing if at least some of the voting officials are forecast oriented instead of looking backward.
Another reason against upsizing is what it could reveal about true Fed independence. Go 50 and some say you’ll look political after having skipped just days before the midterms and then catching up afterward. That could compromise efforts to claim policy independence but also make it look like December would be one-and-done for upsizing as a catch-up.
Another reason against upsizing is that while we still need PPI on Friday and then final adjustments, accounting for weighting differences knocks down core CPI upon translation into core PCE maybe by half a tenth to being on the bubble between 0.2% and 0.3% m/m SA. The Fed follows core PCE, not core CPI, and they’ll get the estimate before the next decision.
DETAILS
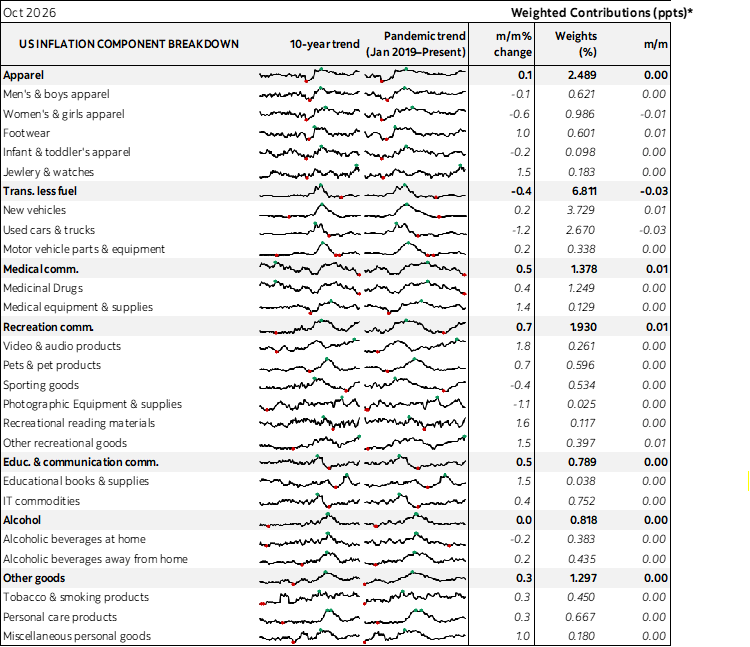
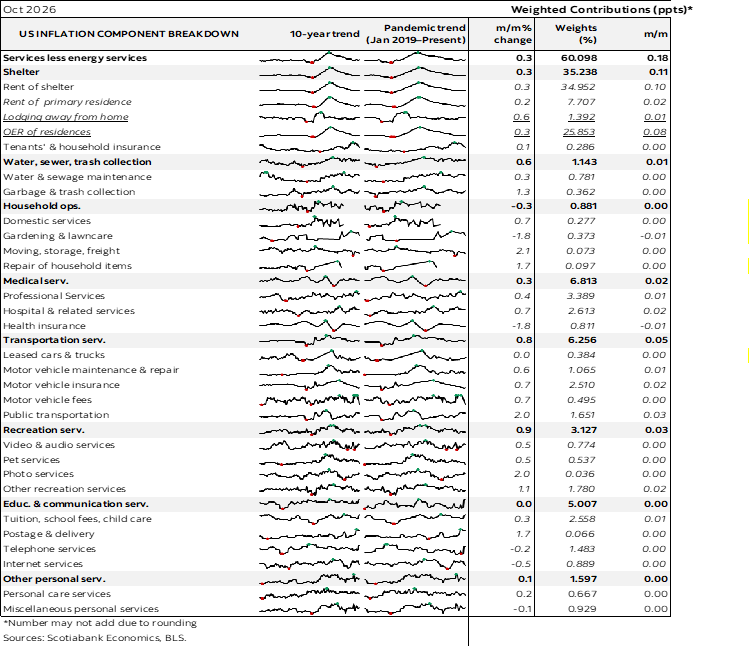
Core services prices (ie: ex-housing services and energy services) were up by 0.3% m/m SA, or 4.9% m/m SAAR. Core goods CPI (ex-food and energy) was up 0.2% m/m, or 2.4% m/m SAAR. This was a services story as shown in charts 2 and 3.
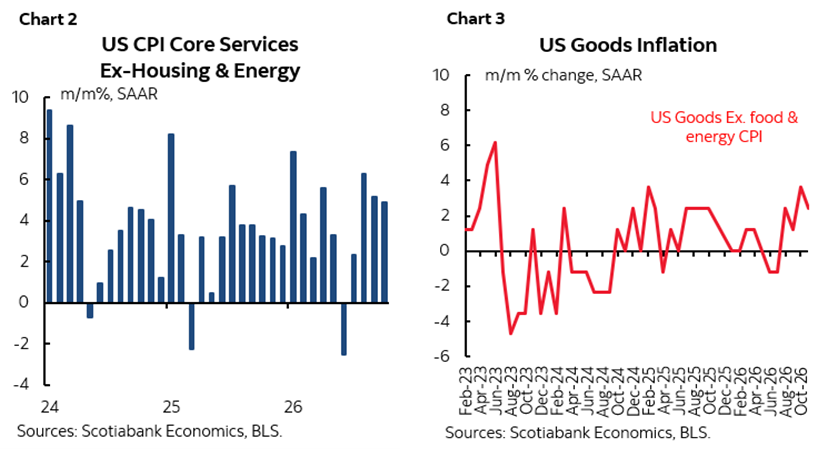
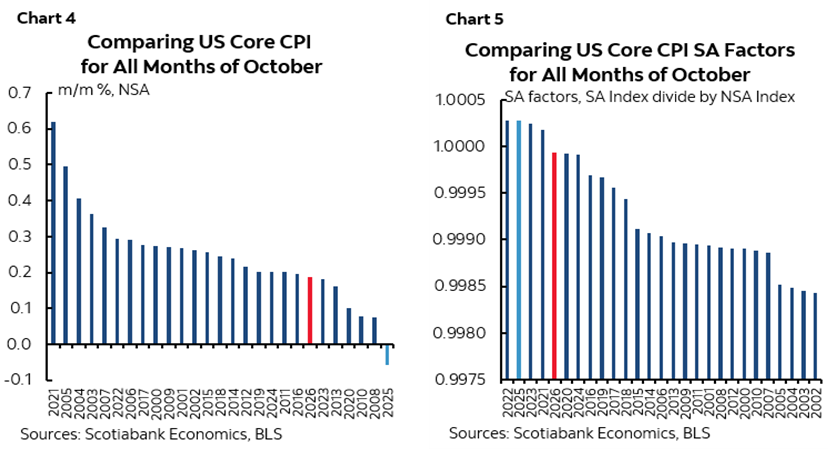
Chart 4 shows that this was not a particularly warm October in terms of m/m seasonally unadjusted (NSA) prices compared to like months of October in time. The reason why core was warm is because they backed off on the SA factor (chart 5).
Recall that there are no y/y rates because of the gov't shutdown last October that resulted in no October CPI but using interpolation for October 2025 we can roughly estimated this October's y/y rates at 3.95% (3.71% prior) for headline and 2.77% for core (2.56% prior)
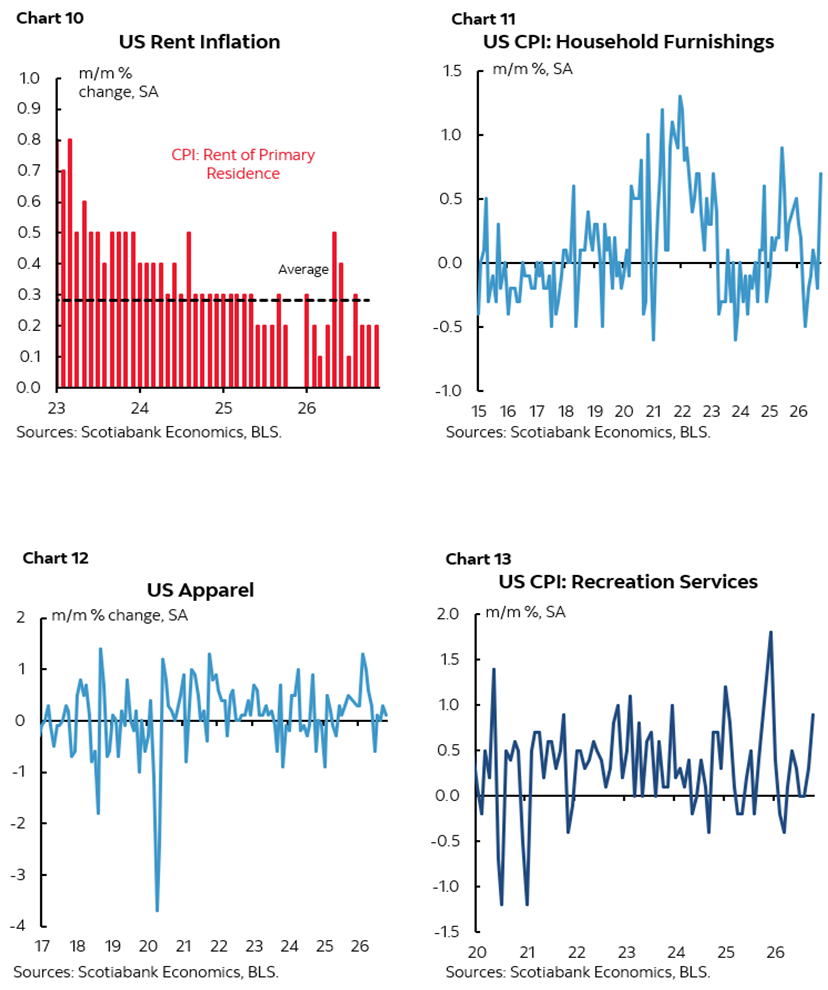
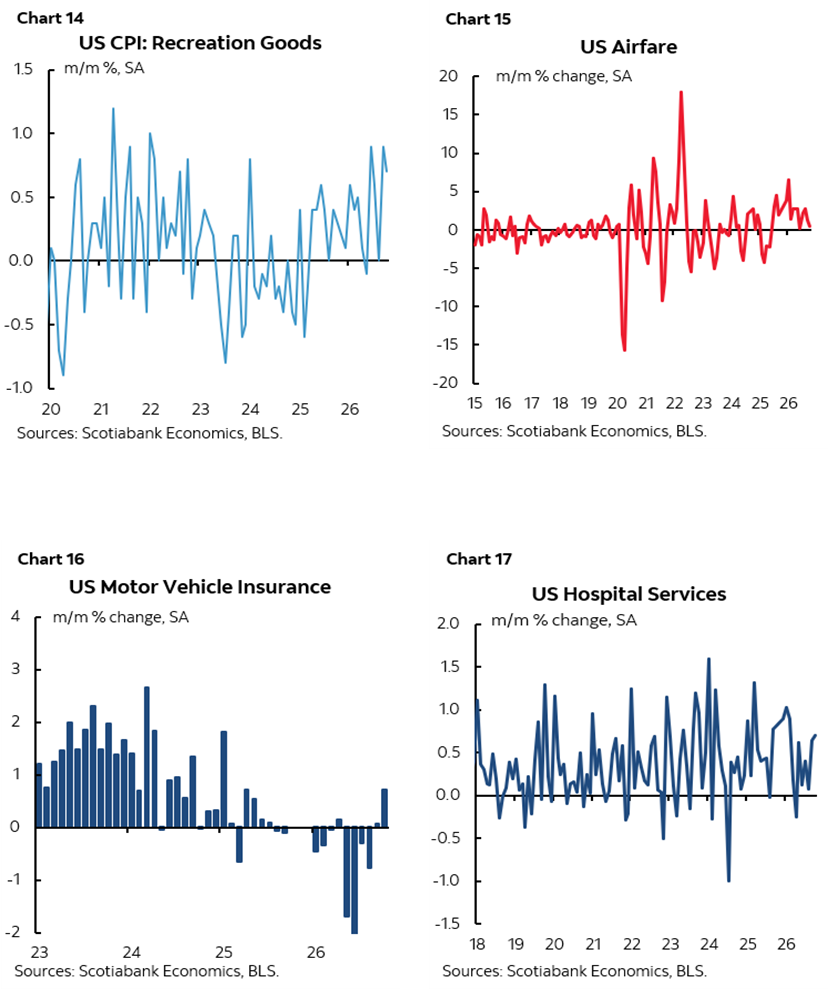
Charts 6–17 break down parts of the basket. Shelter prices increased by 0.3% m/m SA primarily due to the weight applied to owners’ equivalent rent that was up 0.3 as primary rent was up 0.2%.
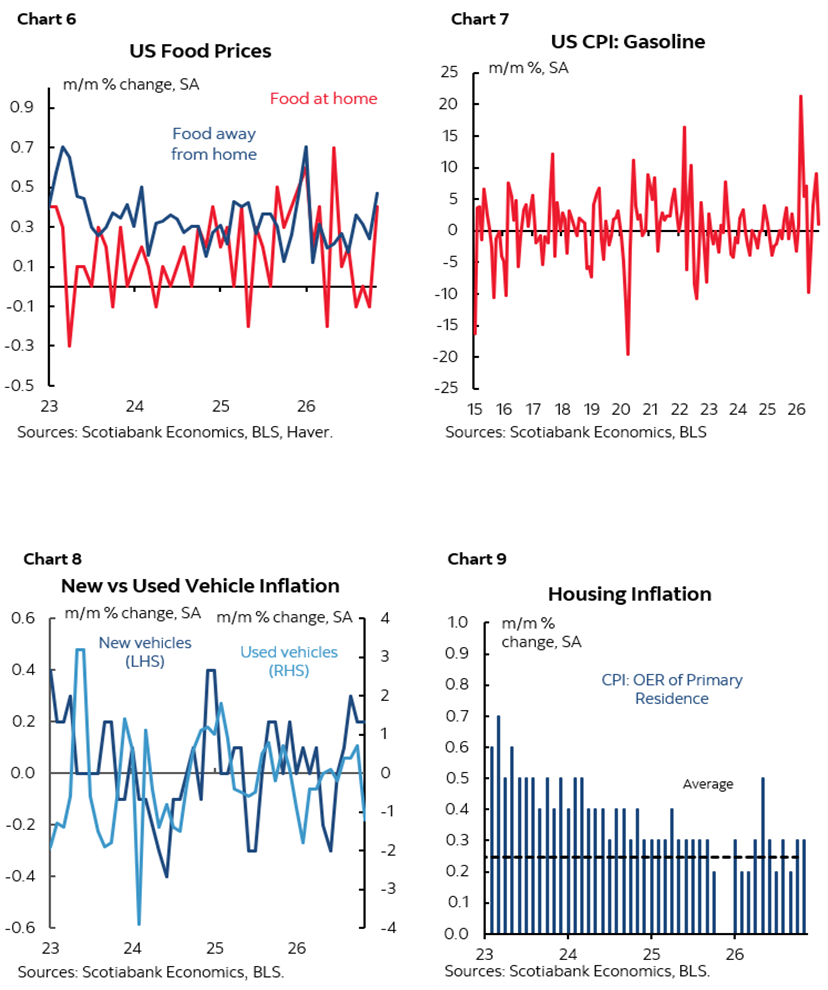
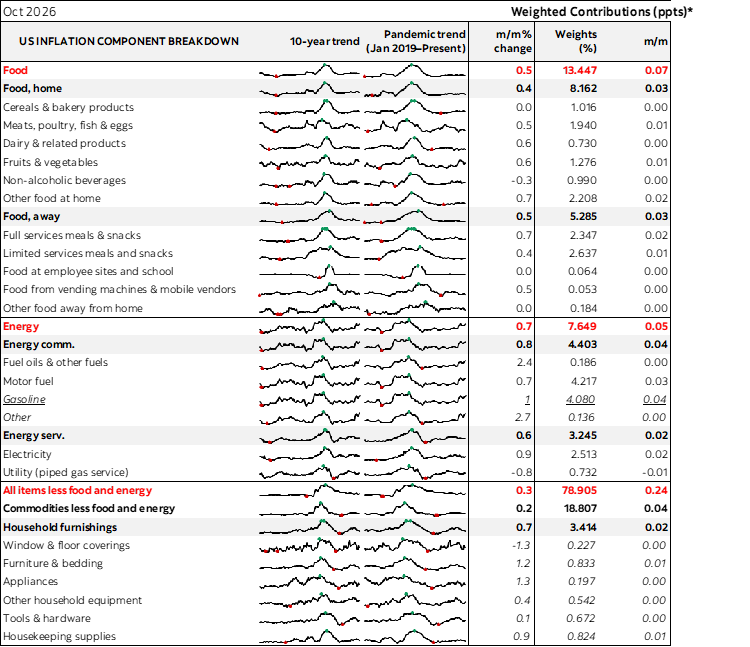
Food prices are stripped out of core, but they were a hot influence on headline CPI. Prices for food at home (ie: groceries) were up 0.4% m/m SA while food away from home (ie: restaurants etc) were up 0.5% m/m SA.
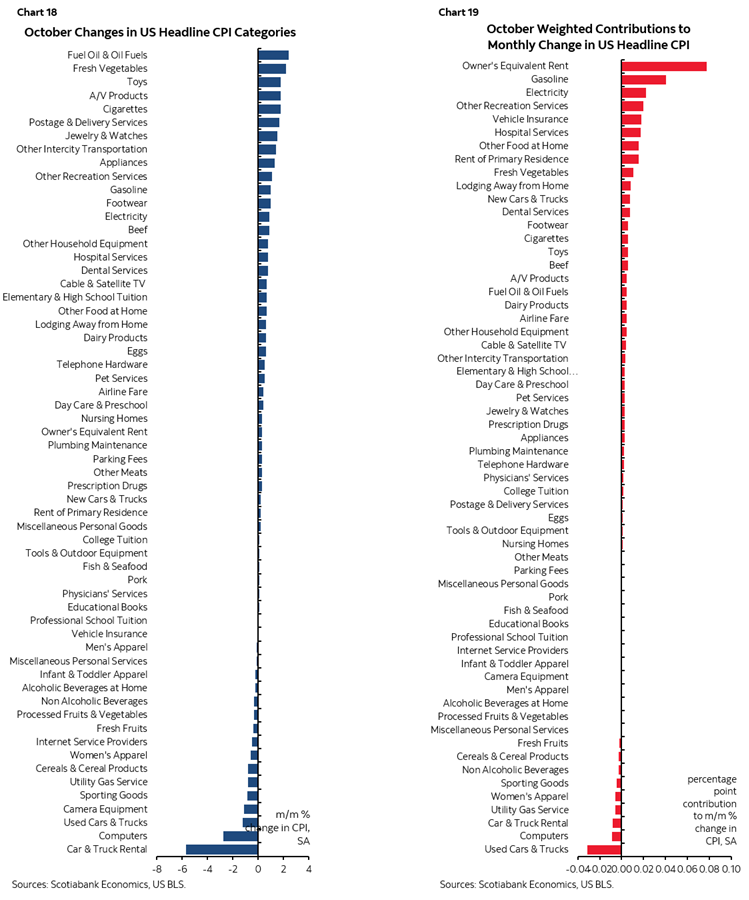
Charts 18 and 19 break down the CPI basket in m/m unadjusted terms and weight contributions to the change in prices respectively. Also see the detailed table.
DISCLAIMER
This report has been prepared by Scotiabank Economics as a resource for the clients of Scotiabank. Opinions, estimates and projections contained herein are our own as of the date hereof and are subject to change without notice. The information and opinions contained herein have been compiled or arrived at from sources believed reliable but no representation or warranty, express or implied, is made as to their accuracy or completeness. Neither Scotiabank nor any of its officers, directors, partners, employees or affiliates accepts any liability whatsoever for any direct or consequential loss arising from any use of this report or its contents.
These reports are provided to you for informational purposes only. This report is not, and is not constructed as, an offer to sell or solicitation of any offer to buy any financial instrument, nor shall this report be construed as an opinion as to whether you should enter into any swap or trading strategy involving a swap or any other transaction. The information contained in this report is not intended to be, and does not constitute, a recommendation of a swap or trading strategy involving a swap within the meaning of U.S. Commodity Futures Trading Commission Regulation 23.434 and Appendix A thereto. This material is not intended to be individually tailored to your needs or characteristics and should not be viewed as a “call to action” or suggestion that you enter into a swap or trading strategy involving a swap or any other transaction. Scotiabank may engage in transactions in a manner inconsistent with the views discussed this report and may have positions, or be in the process of acquiring or disposing of positions, referred to in this report.
Scotiabank, its affiliates and any of their respective officers, directors and employees may from time to time take positions in currencies, act as managers, co-managers or underwriters of a public offering or act as principals or agents, deal in, own or act as market makers or advisors, brokers or commercial and/or investment bankers in relation to securities or related derivatives. As a result of these actions, Scotiabank may receive remuneration. All Scotiabank products and services are subject to the terms of applicable agreements and local regulations. Officers, directors and employees of Scotiabank and its affiliates may serve as directors of corporations.
Any securities discussed in this report may not be suitable for all investors. Scotiabank recommends that investors independently evaluate any issuer and security discussed in this report, and consult with any advisors they deem necessary prior to making any investment.
This report and all information, opinions and conclusions contained in it are protected by copyright. This information may not be reproduced without the prior express written consent of Scotiabank.
™ Trademark of The Bank of Nova Scotia. Used under license, where applicable.
Scotiabank, together with “Global Banking and Markets”, is a marketing name for the global corporate and investment banking and capital markets businesses of The Bank of Nova Scotia and certain of its affiliates in the countries where they operate, including; Scotiabank Europe plc; Scotiabank (Ireland) Designated Activity Company; Scotiabank Inverlat S.A., Institución de Banca Múltiple, Grupo Financiero Scotiabank Inverlat, Scotia Inverlat Casa de Bolsa, S.A. de C.V., Grupo Financiero Scotiabank Inverlat, Scotia Inverlat Derivados S.A. de C.V. – all members of the Scotiabank group and authorized users of the Scotiabank mark. The Bank of Nova Scotia is incorporated in Canada with limited liability and is authorised and regulated by the Office of the Superintendent of Financial Institutions Canada. The Bank of Nova Scotia is authorized by the UK Prudential Regulation Authority and is subject to regulation by the UK Financial Conduct Authority and limited regulation by the UK Prudential Regulation Authority. Details about the extent of The Bank of Nova Scotia's regulation by the UK Prudential Regulation Authority are available from us on request. Scotiabank Europe plc is authorized by the UK Prudential Regulation Authority and regulated by the UK Financial Conduct Authority and the UK Prudential Regulation Authority.
Scotiabank Inverlat, S.A., Scotia Inverlat Casa de Bolsa, S.A. de C.V, Grupo Financiero Scotiabank Inverlat, and Scotia Inverlat Derivados, S.A. de C.V., are each authorized and regulated by the Mexican financial authorities.
Not all products and services are offered in all jurisdictions. Services described are available in jurisdictions where permitted by law.