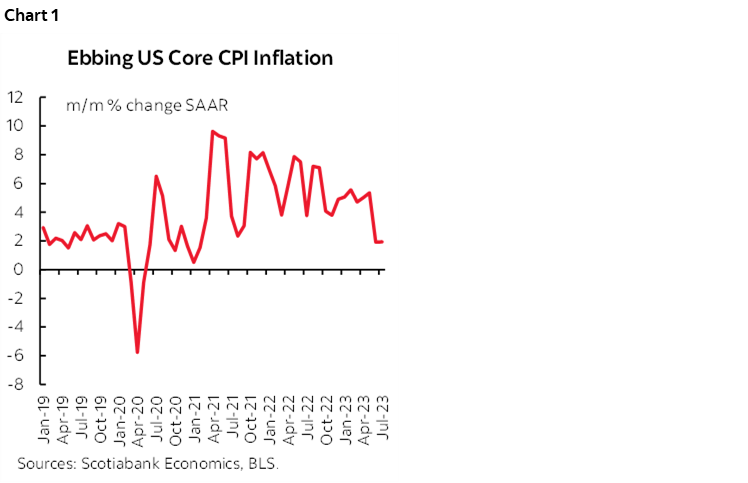
- Soft US core CPI met expectations at 0.16% m/m
- Breadth was equally soft across core services and core goods
- Markets shook it off as expected relative to what was priced
- A lot of data still lies ahead before the September FOMC...
- ...and Powell will likely remain adherent to history’s cautions...
- ...in what could be the fourth temporary core CPI soft patch of the pandemic era...
- ...by setting a higher bar for pulling out the pom poms than markets may be doing
- US CPI / core CPI, m/m SA, July:
- Actual: 0.17 / 0.16
- Scotia: 0.1 / 0.1
- Consensus: 0.2 / 0.2
- Prior: 0.2 / 0.2
US CPI broadly met expectations for another soft print and this was accompanied by soft underlying details. The 0.16% m/m SA core reading generously rounded up to 0.2% and was only the slightest bit stronger than my guesstimate. Close enough for throwing horseshoes!
There was little market reaction relatively to what had been baked in ahead of time. The US two-year yield ticked up by a couple of basis points post-data and the dollar was flat. S&P equity futures initially yawned but the index pushed higher into the cash open.
The readings will encourage the Fed but with the following strong cautions.
1. There is a lot more data before the Sept 20th FOMC decision including another CPI reading for August, another PCE reading for July, another nonfarm and wages report for August etc. If they had to decide what to do now then they’d have a solid case for another skip, but that could change and there is also the matter of managing the next upcoming round of dots.
2. It's a soft patch but Powell is likely to repeat references to how history cautions against prematurely declaring victory. We’ve seen similar back-to-back soft patches that proved to be temporary in October–November last year with a pair of 0.3 core CPI readings, in the summer of 2021 with a trio of 0.2s and 0.3s, and throughout late 2020 into early 2021 with a string of soft readings. We know what happened in the aftermath of each of those episodes.
On that last point, various measures of global food price inflation are returning albeit in volatile fashion and including CRB spot US food prices and rice prices for the few billion folks who treat it as a staple in their diets with particular implications for many EMs. So is energy inflation such as WTI that’s up by about US$16 since June along with firmer gasoline prices this month. Then there are strong wage gains in a tight labour market, an economy that is still not taking steps toward opening up disinflationary slack as GDP growth outpaces potential GDP growth, and mixed evidence across global supply chains that are at a highly nascent stage of being revamped. Add in solid consumer confidence that still has them spending and wealth effects such as the S&P’s 25% gain since last October plus rebounding house prices with the repeat sales house price index up for four straight months in a row now.
The point is that markets notoriously pounce on every short-term data point and swing with the prevailing breeze in volatile fashion. The Fed can't afford to behave that way. Their bar for a sustained period of soft inflation prints is likely set much higher than the markets such that the Committee would probably require at least six and perhaps as many as a protracted year-long string of soft readings before being confident to ease up. We’re a long way from Powell pulling out the pom poms and doing sky high leg kicks in a press conference! Image...
DETAILS
Chart 1 shows the back-to-back soft prints in core CPI.
Breadth backed that up. Chart 2 shows that CPI core services that exclude energy services and housing was up by 0.2% m/m SA in an extension of a soft period. Chart 3 shows that core goods inflation ex-food and energy was also soft at –0.3% m/m SA for the second negative print in a row. A full breakdown of the basket is here.
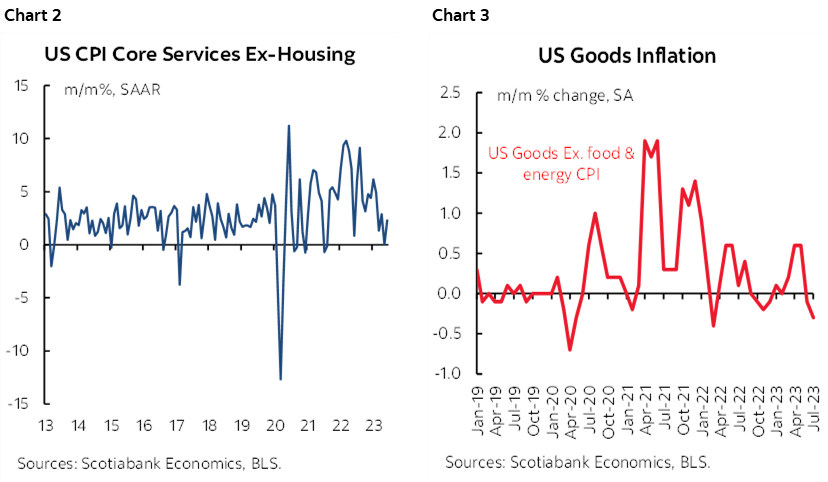
Chart 4 shows that housing inflation remains off the peak but is hardly light. Owners equivalent rent was up by 0.5% m/m SA and rent of primary residence increased by 0.4%. Both are trending hot but expected to wane in lagging fashion to already known softening of market rent gauges.
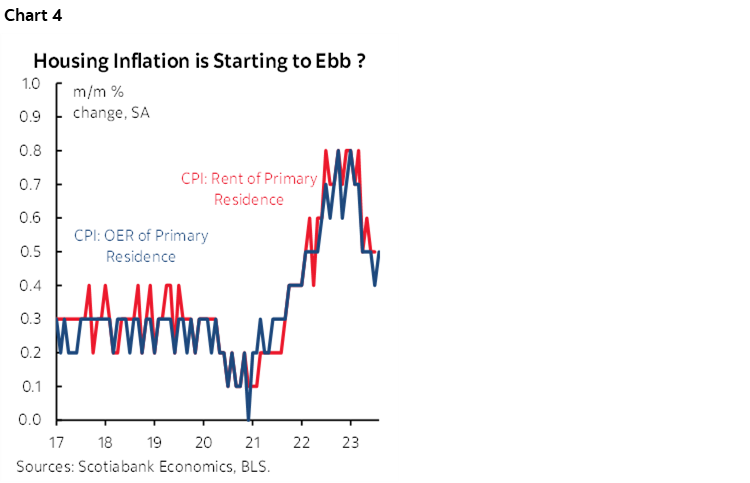
Chart 5 shows that vehicle prices were indeed soft with a drop in used vehicle prices leading the way, but not by as much as trade-in values indicated before all of the adjustments the BLS makes to the source data.
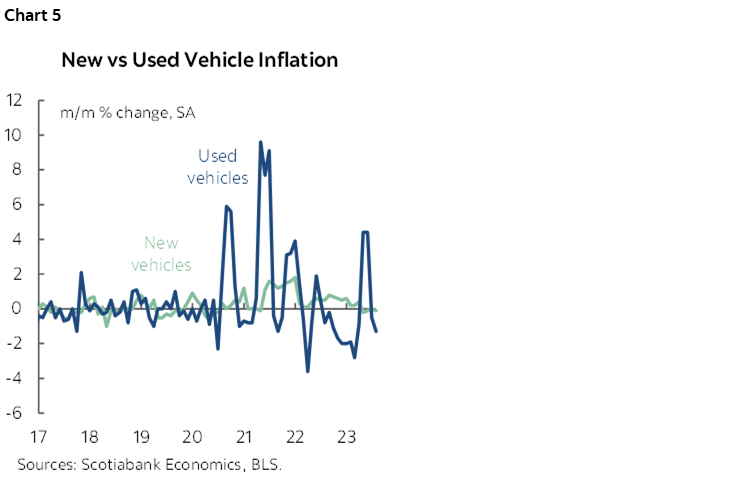
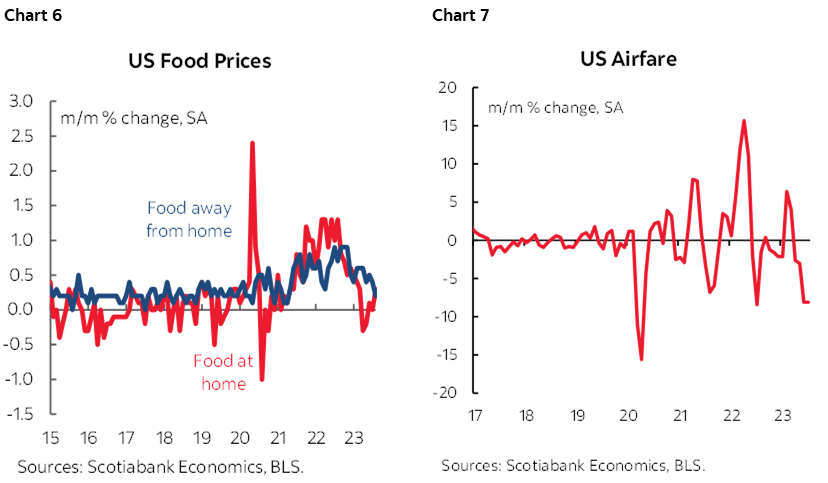
Chart 6 shows that food prices were up 0.2% m/m led by groceries (aka food at home) at 0.3% m/m while away from home was up 0.2%. Soft prices for eating out were accompanied by other travel and leisure evidence like the fourth straight drop in airfare (chart 7), a second dip in lodging prices and a small drop in vehicle rental prices.
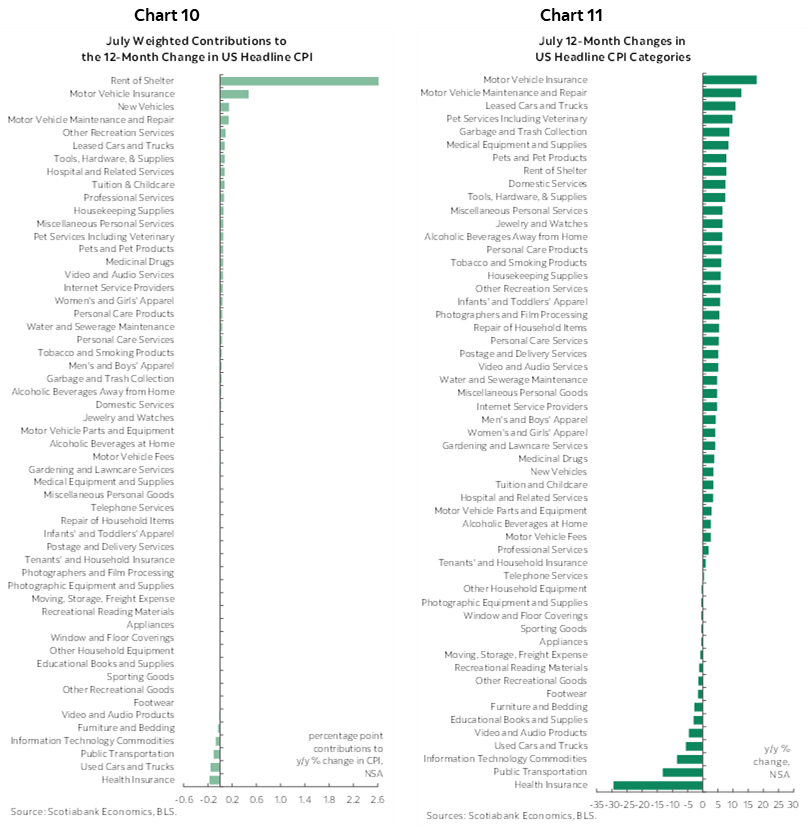
Charts 8 and 9 break down the CPI basket in m/m terms by component and in terms of weighted contributions. Charts 10 and 11 do likewise for the year-over-year contributions.

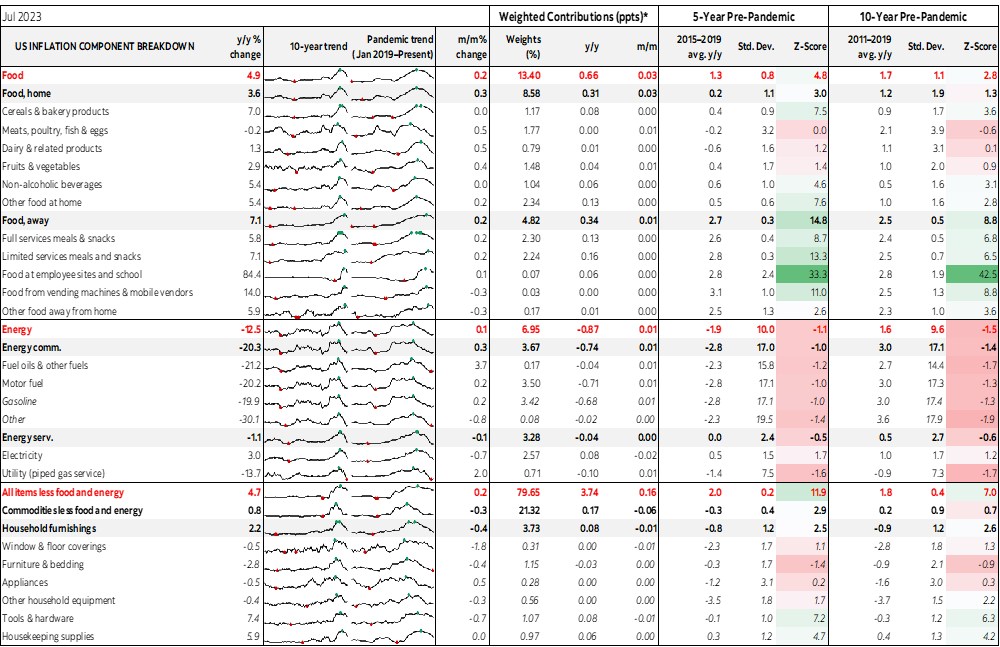
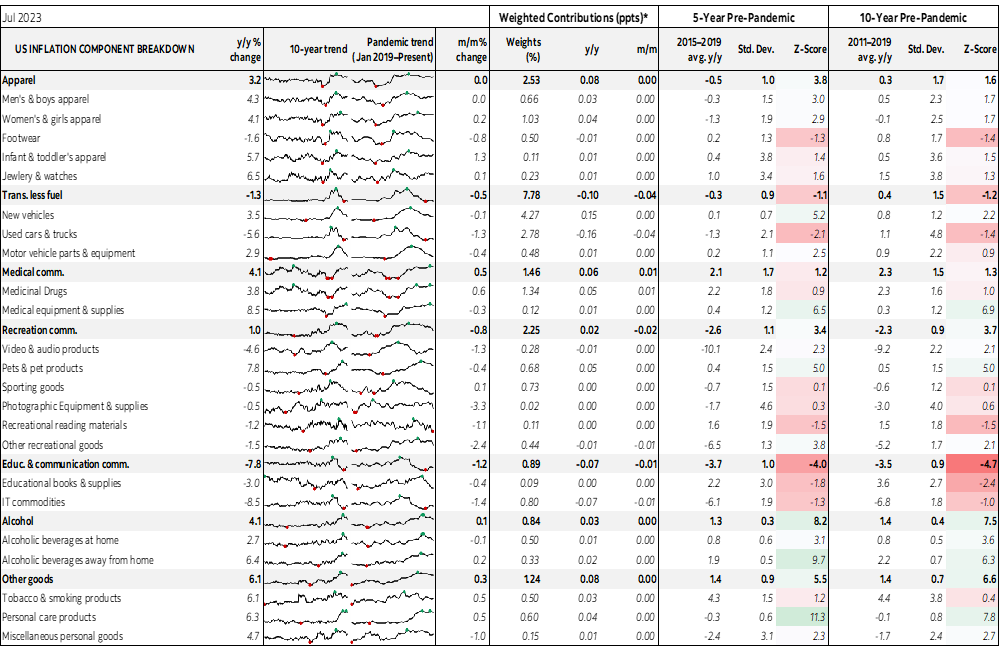
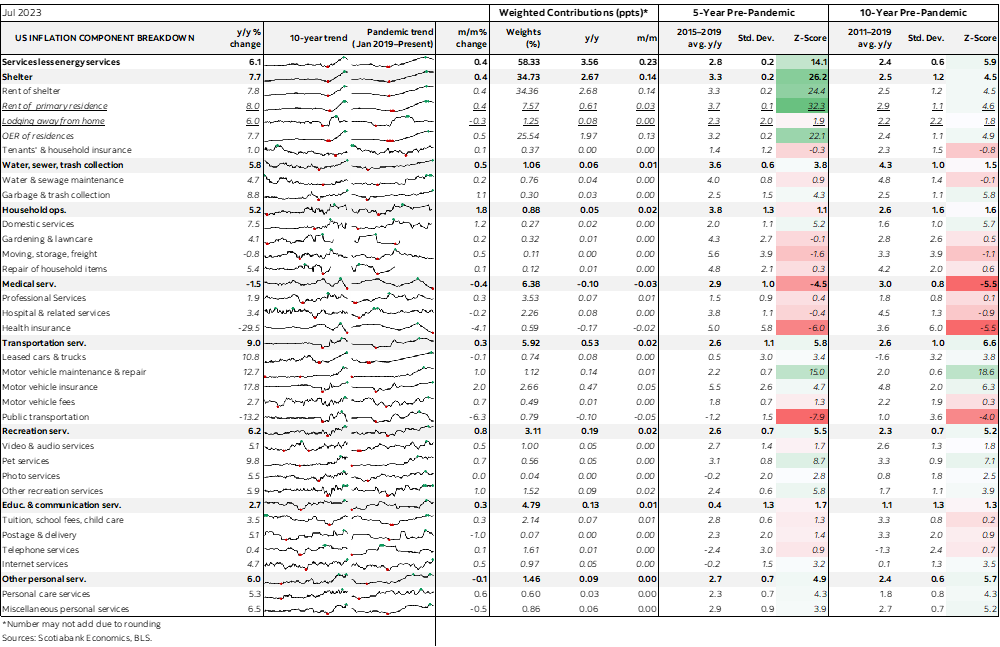
Please see the accompanying appendix that provides more detail on the subcomponents with microcharts and z-score measures of deviations from trends.
DISCLAIMER
This report has been prepared by Scotiabank Economics as a resource for the clients of Scotiabank. Opinions, estimates and projections contained herein are our own as of the date hereof and are subject to change without notice. The information and opinions contained herein have been compiled or arrived at from sources believed reliable but no representation or warranty, express or implied, is made as to their accuracy or completeness. Neither Scotiabank nor any of its officers, directors, partners, employees or affiliates accepts any liability whatsoever for any direct or consequential loss arising from any use of this report or its contents.
These reports are provided to you for informational purposes only. This report is not, and is not constructed as, an offer to sell or solicitation of any offer to buy any financial instrument, nor shall this report be construed as an opinion as to whether you should enter into any swap or trading strategy involving a swap or any other transaction. The information contained in this report is not intended to be, and does not constitute, a recommendation of a swap or trading strategy involving a swap within the meaning of U.S. Commodity Futures Trading Commission Regulation 23.434 and Appendix A thereto. This material is not intended to be individually tailored to your needs or characteristics and should not be viewed as a “call to action” or suggestion that you enter into a swap or trading strategy involving a swap or any other transaction. Scotiabank may engage in transactions in a manner inconsistent with the views discussed this report and may have positions, or be in the process of acquiring or disposing of positions, referred to in this report.
Scotiabank, its affiliates and any of their respective officers, directors and employees may from time to time take positions in currencies, act as managers, co-managers or underwriters of a public offering or act as principals or agents, deal in, own or act as market makers or advisors, brokers or commercial and/or investment bankers in relation to securities or related derivatives. As a result of these actions, Scotiabank may receive remuneration. All Scotiabank products and services are subject to the terms of applicable agreements and local regulations. Officers, directors and employees of Scotiabank and its affiliates may serve as directors of corporations.
Any securities discussed in this report may not be suitable for all investors. Scotiabank recommends that investors independently evaluate any issuer and security discussed in this report, and consult with any advisors they deem necessary prior to making any investment.
This report and all information, opinions and conclusions contained in it are protected by copyright. This information may not be reproduced without the prior express written consent of Scotiabank.
™ Trademark of The Bank of Nova Scotia. Used under license, where applicable.
Scotiabank, together with “Global Banking and Markets”, is a marketing name for the global corporate and investment banking and capital markets businesses of The Bank of Nova Scotia and certain of its affiliates in the countries where they operate, including; Scotiabank Europe plc; Scotiabank (Ireland) Designated Activity Company; Scotiabank Inverlat S.A., Institución de Banca Múltiple, Grupo Financiero Scotiabank Inverlat, Scotia Inverlat Casa de Bolsa, S.A. de C.V., Grupo Financiero Scotiabank Inverlat, Scotia Inverlat Derivados S.A. de C.V. – all members of the Scotiabank group and authorized users of the Scotiabank mark. The Bank of Nova Scotia is incorporated in Canada with limited liability and is authorised and regulated by the Office of the Superintendent of Financial Institutions Canada. The Bank of Nova Scotia is authorized by the UK Prudential Regulation Authority and is subject to regulation by the UK Financial Conduct Authority and limited regulation by the UK Prudential Regulation Authority. Details about the extent of The Bank of Nova Scotia's regulation by the UK Prudential Regulation Authority are available from us on request. Scotiabank Europe plc is authorized by the UK Prudential Regulation Authority and regulated by the UK Financial Conduct Authority and the UK Prudential Regulation Authority.
Scotiabank Inverlat, S.A., Scotia Inverlat Casa de Bolsa, S.A. de C.V, Grupo Financiero Scotiabank Inverlat, and Scotia Inverlat Derivados, S.A. de C.V., are each authorized and regulated by the Mexican financial authorities.
Not all products and services are offered in all jurisdictions. Services described are available in jurisdictions where permitted by law.