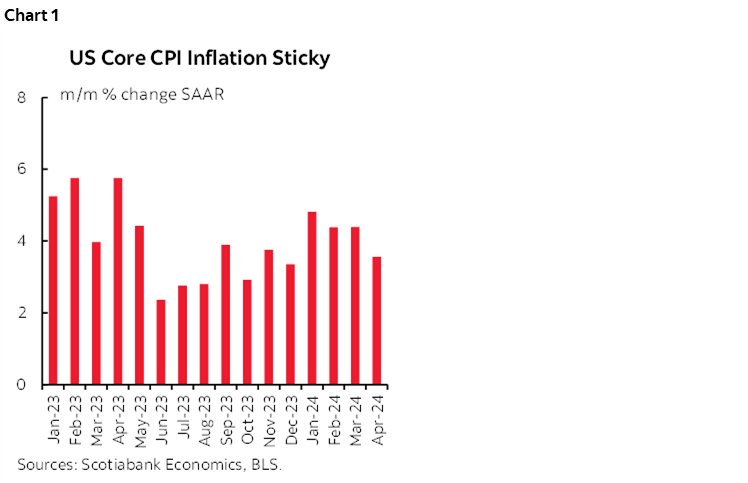
- Core inflation landed on softer expectations, but was not soft
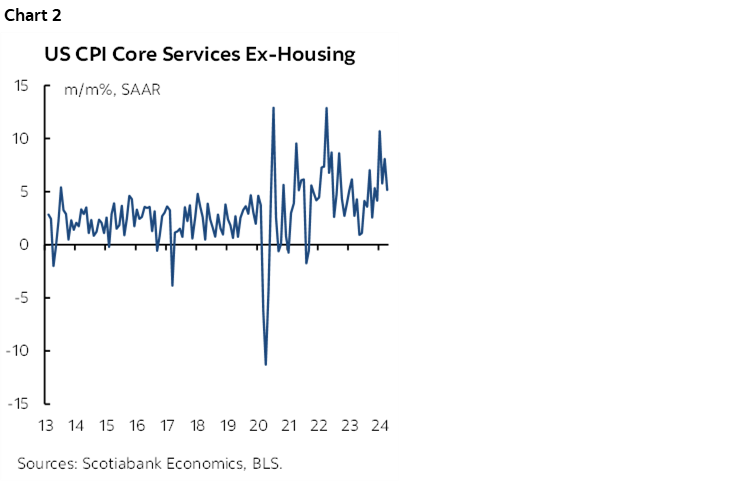
- Cooler volatile core services inflation drove it
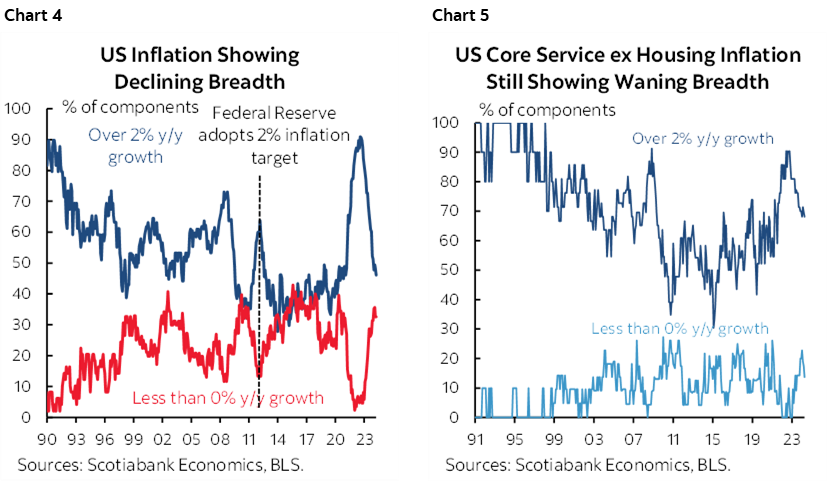
- Breadth continues to improve
- The FOMC will want more evidence
- US CPI headline / core, m/m %, SA, April:
- Actual: 0.3 / 0.3
- Scotia: 0.4 / 0.3
- Consensus: 0.4 / 0.3
- Prior: 0.4 / 0.4
Markets expressed mild relief toward a pair of US inflation and consumer spending prints that change nothing yet for the FOMC. The result had markets gently piling into the US front-end, driving a weaker dollar, and putting a bid to US equities. That’s a sensible market reaction in a positioning sense that has been programmed to be surprised by higher core inflation readings this year which didn’t happen this time, but it’s not going to sway the Fed any time soon.
Core CPI landed at 0.29% m/m SA which rounds to 0.3%. That matched just about every estimate within consensus and across nowcasts. At 3.6% m/m SAAR, core CPI is still too hot for the FOMC’s liking (chart 1), but it’s very slight, tentative progress relative to four-handled readings in each of the prior three months.
Markets
The US two-year Treasury yield initially fell by about 7bps after the data before retracing some of that move. The dollar broadly weakened at first, but also retraced some of the initial reaction. S&P futures jumped about ½% at first and are slightly building on that gain in the cash market.
Fed funds futures are pricing nothing for June, only about 8bps for July, and still about 22–23bps for the September meeting which remains my base case for a first cut. Markets added a few more basis points to cumulative easing this year and are now pretty much bang on pricing a 50bps reduction.
Services Inflation Eases
The main driver of the softer core CPI reading this time was on the services side. Core services CPI ex-housing and ex-energy services was up by 0.4% m/m SA which is not light, but it is toward the lower end of the recent range following gains of 0.85% m/m SA in January, then 0.5% in February, then 0.65% in March (chart 2).
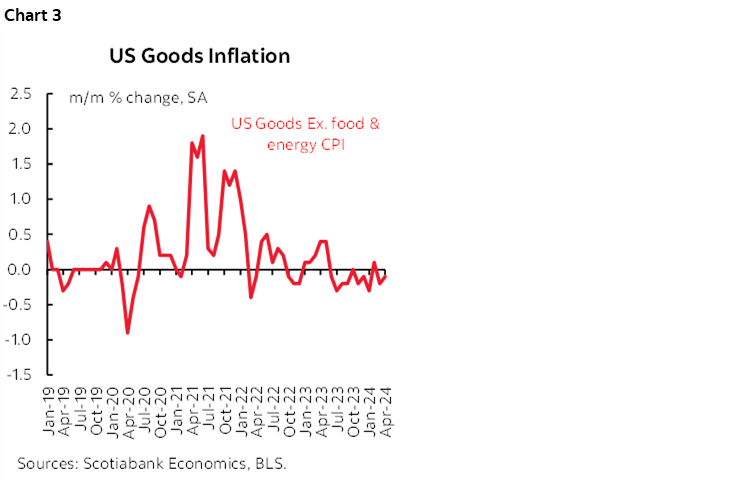
Core goods inflation remains soft as prices for commodities ex-food and energy continue to fall (chart 3).
Softening Breadth
Breadth is improving. Charts 4–5 drive this point home.
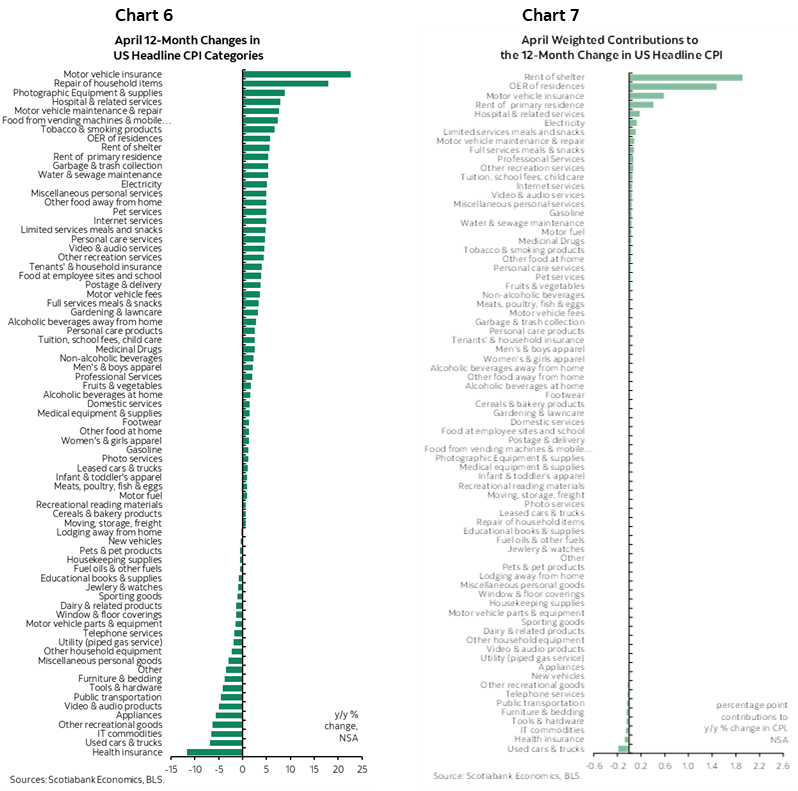
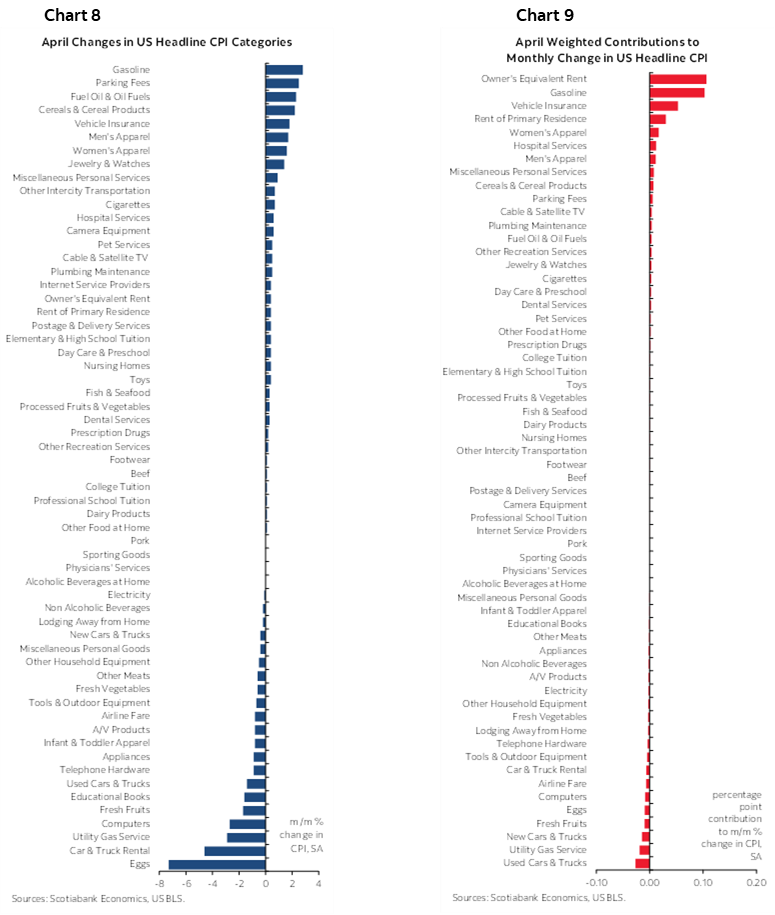
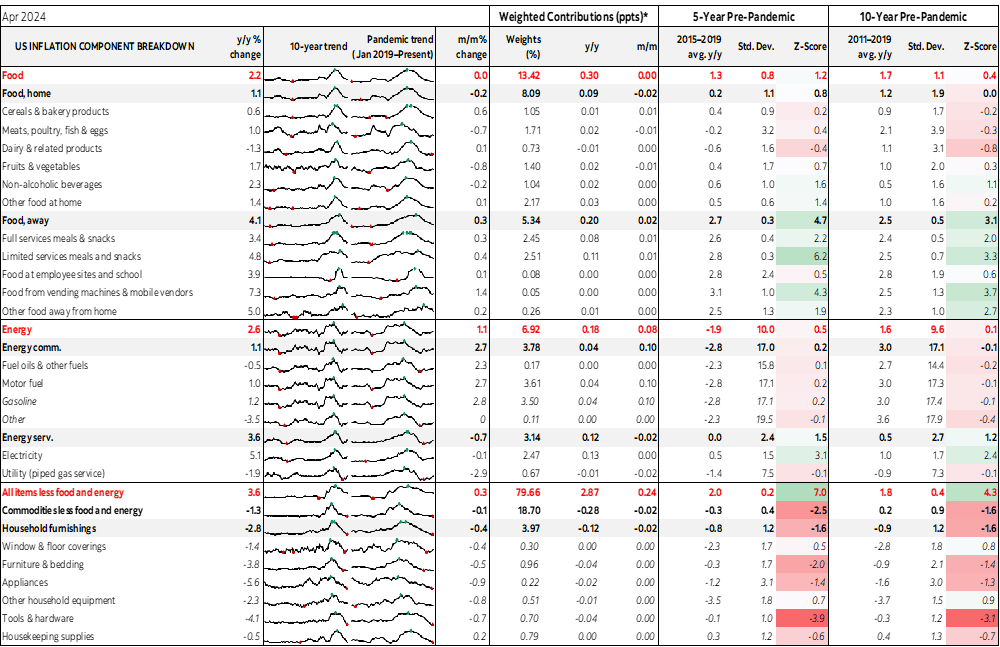
So do charts 6–7 on the next page that break down the change in CPI by component and the weighted contributions to the overall change in CPI in y/y terms. Charts 8 and 9 do the same thing for m/m price changes on the following page. On a month-over-month basis there were about 4 categories that stood out in terms of weighted contributions to the price changes and little breadth beyond that.
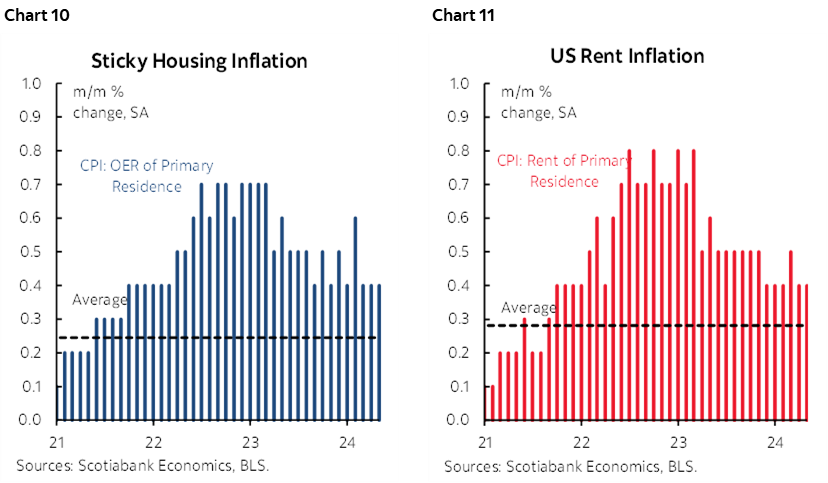
One of those categories that remains very sticky is shelter costs. Chart 10 shows owners’ equivalent rent held in at the same pace of increase as the prior couple of months. Chart 11 shows ongoing persistent pressure in rent inflation.
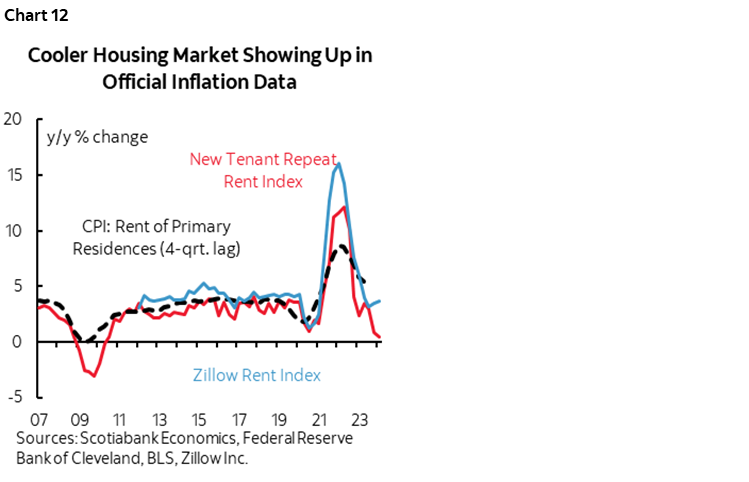
Since the Fed is mandated to target total inflation they cannot just ignore 36% of the basket that is hot. There are similar debates elsewhere like in Canada. What is frustrating is the length of time it is taking for easing market rents to show up in lighter shelter cost inflation. There is always a lag, but the length of time is getting toward the extremes of the amount of time it should take (chart 12).
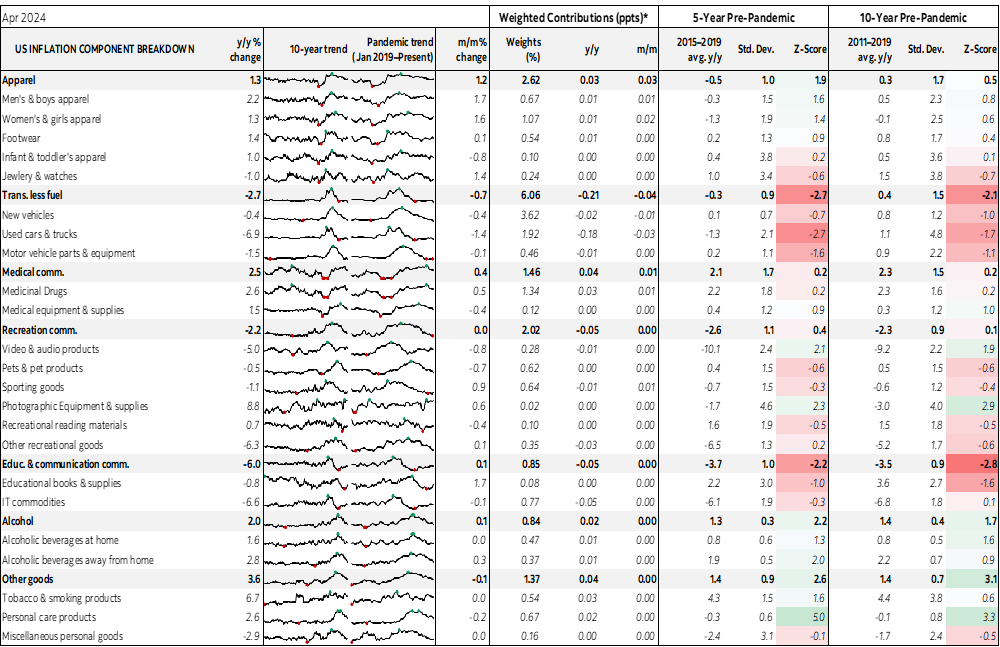
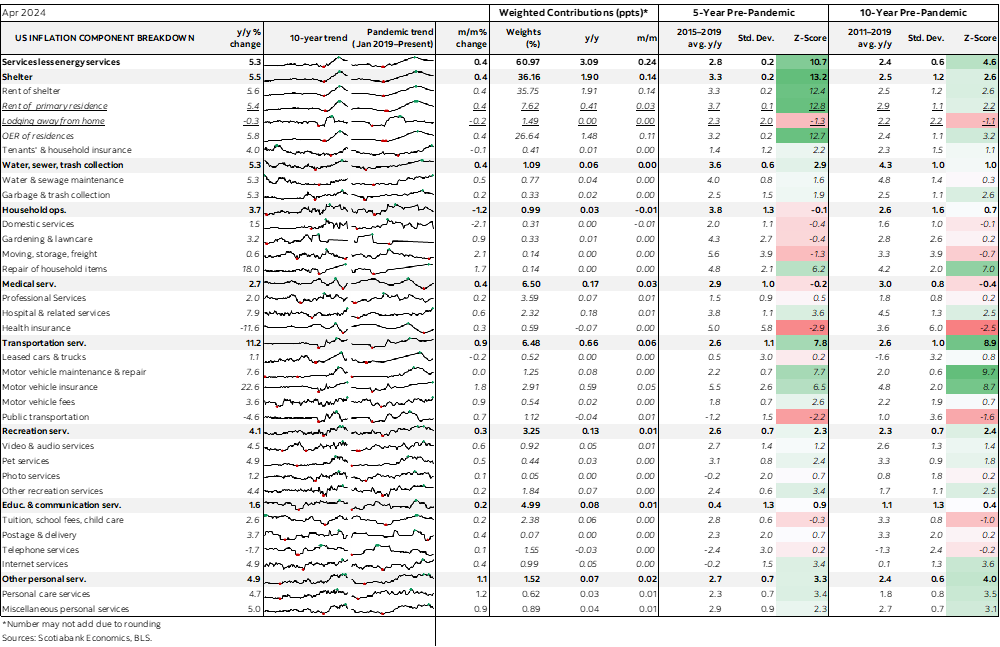
Details
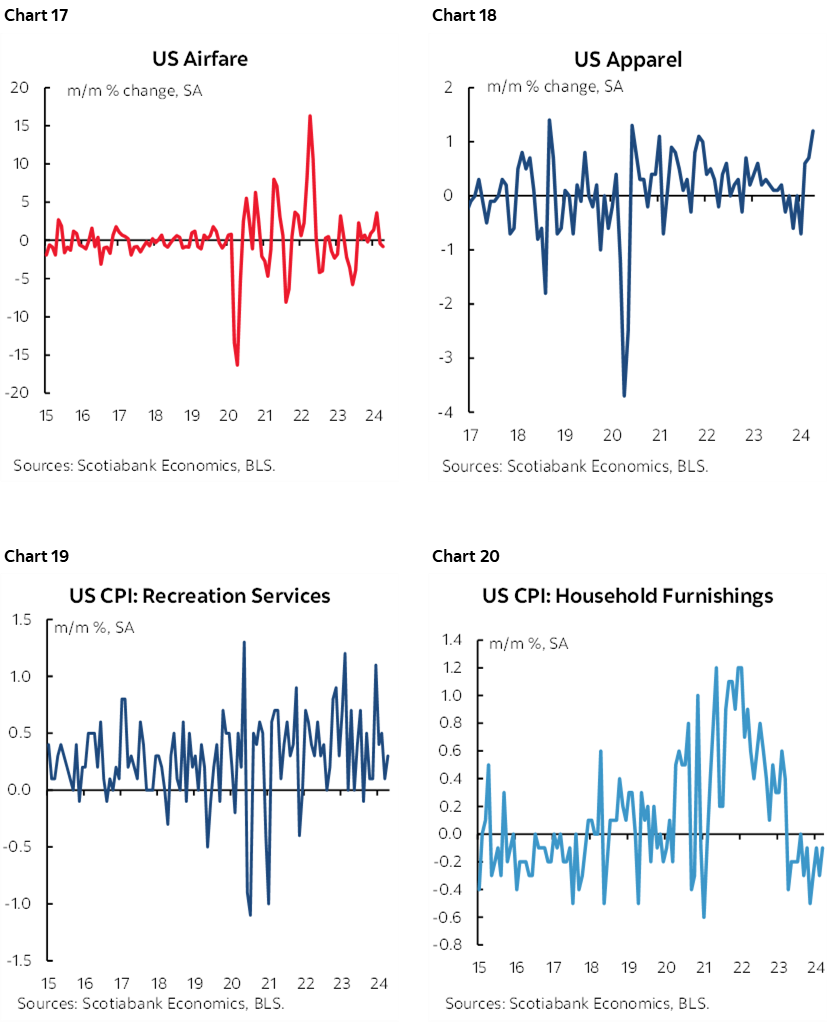
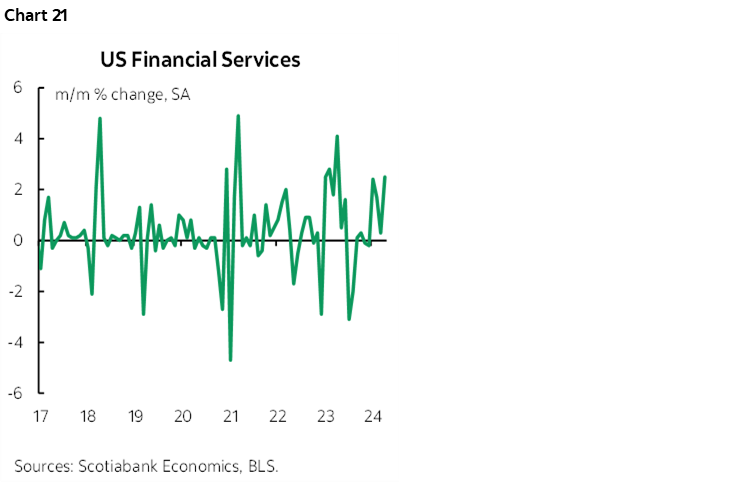
Charts 13–21 show other breakdowns of the CPI basket with comments to follow.
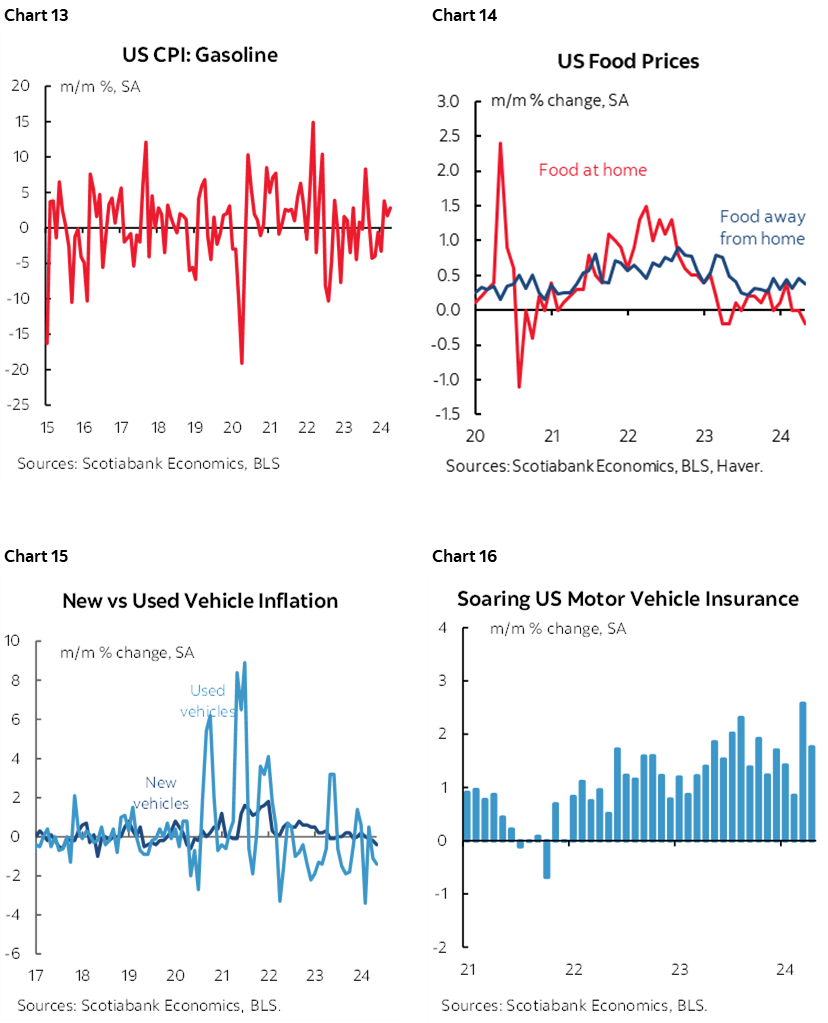
Headline CPI unexpectedly matched core CPI instead of being firmer as expected because a rise in gasoline prices was tempered by cooler food prices.
New vehicle prices fell by –0.4% m/m SA which was about what was expected. I was surprised by the 1.4% m/m SA drop in used vehicle prices. Industry guidance including on trade-in values pointed to a seasonally adjusted gain and are usually a better advance indicator than, say, measures of used vehicle prices at auctions.
Other transportation categories were mixed, such as soft airfare, versus another large jump in auto insurance premiums.
Clothing prices soared by 1.2% m/m SA with broadly based gains except for outerwear.
Recreation service prices were up at a slower pace, prices for household furnishings fell again, and so did food prices. Prices for financial services and health care continue to creep higher. Please also see the detailed table and micro charts in the appendix.
DISCLAIMER
This report has been prepared by Scotiabank Economics as a resource for the clients of Scotiabank. Opinions, estimates and projections contained herein are our own as of the date hereof and are subject to change without notice. The information and opinions contained herein have been compiled or arrived at from sources believed reliable but no representation or warranty, express or implied, is made as to their accuracy or completeness. Neither Scotiabank nor any of its officers, directors, partners, employees or affiliates accepts any liability whatsoever for any direct or consequential loss arising from any use of this report or its contents.
These reports are provided to you for informational purposes only. This report is not, and is not constructed as, an offer to sell or solicitation of any offer to buy any financial instrument, nor shall this report be construed as an opinion as to whether you should enter into any swap or trading strategy involving a swap or any other transaction. The information contained in this report is not intended to be, and does not constitute, a recommendation of a swap or trading strategy involving a swap within the meaning of U.S. Commodity Futures Trading Commission Regulation 23.434 and Appendix A thereto. This material is not intended to be individually tailored to your needs or characteristics and should not be viewed as a “call to action” or suggestion that you enter into a swap or trading strategy involving a swap or any other transaction. Scotiabank may engage in transactions in a manner inconsistent with the views discussed this report and may have positions, or be in the process of acquiring or disposing of positions, referred to in this report.
Scotiabank, its affiliates and any of their respective officers, directors and employees may from time to time take positions in currencies, act as managers, co-managers or underwriters of a public offering or act as principals or agents, deal in, own or act as market makers or advisors, brokers or commercial and/or investment bankers in relation to securities or related derivatives. As a result of these actions, Scotiabank may receive remuneration. All Scotiabank products and services are subject to the terms of applicable agreements and local regulations. Officers, directors and employees of Scotiabank and its affiliates may serve as directors of corporations.
Any securities discussed in this report may not be suitable for all investors. Scotiabank recommends that investors independently evaluate any issuer and security discussed in this report, and consult with any advisors they deem necessary prior to making any investment.
This report and all information, opinions and conclusions contained in it are protected by copyright. This information may not be reproduced without the prior express written consent of Scotiabank.
™ Trademark of The Bank of Nova Scotia. Used under license, where applicable.
Scotiabank, together with “Global Banking and Markets”, is a marketing name for the global corporate and investment banking and capital markets businesses of The Bank of Nova Scotia and certain of its affiliates in the countries where they operate, including; Scotiabank Europe plc; Scotiabank (Ireland) Designated Activity Company; Scotiabank Inverlat S.A., Institución de Banca Múltiple, Grupo Financiero Scotiabank Inverlat, Scotia Inverlat Casa de Bolsa, S.A. de C.V., Grupo Financiero Scotiabank Inverlat, Scotia Inverlat Derivados S.A. de C.V. – all members of the Scotiabank group and authorized users of the Scotiabank mark. The Bank of Nova Scotia is incorporated in Canada with limited liability and is authorised and regulated by the Office of the Superintendent of Financial Institutions Canada. The Bank of Nova Scotia is authorized by the UK Prudential Regulation Authority and is subject to regulation by the UK Financial Conduct Authority and limited regulation by the UK Prudential Regulation Authority. Details about the extent of The Bank of Nova Scotia's regulation by the UK Prudential Regulation Authority are available from us on request. Scotiabank Europe plc is authorized by the UK Prudential Regulation Authority and regulated by the UK Financial Conduct Authority and the UK Prudential Regulation Authority.
Scotiabank Inverlat, S.A., Scotia Inverlat Casa de Bolsa, S.A. de C.V, Grupo Financiero Scotiabank Inverlat, and Scotia Inverlat Derivados, S.A. de C.V., are each authorized and regulated by the Mexican financial authorities.
Not all products and services are offered in all jurisdictions. Services described are available in jurisdictions where permitted by law.