- Nonfarm payrolls were weaker than expected…
- ...and so were other details…
- But it changes nothing for the Fed…
- ...as the focus remains on inflation
- Governor Bowman reemphasized her inflation focus post-payrolls
- ISM-services disappointed….
- ….but maybe because of an entirely missed Easter effect in both March and April…
- ….and markets focused more on a disturbing jump in prices paid anyway
- US nonfarm payrolls m/m 000s SA // UR %, April:
- Actual: 175 / 3.9
- Scotia: 250 / 3.7
- Consensus: 240 / 3.8
- Prior: 315 / 3.8 (revised from 303k / 3.8)
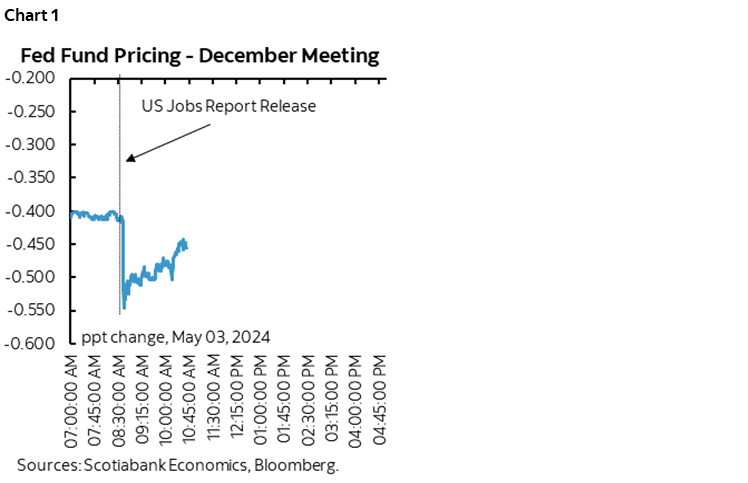
Markets initially pounced on the front-end, driving short-term yields lower in the wake of a softer pace of increase in nonfarm payrolls than prior months. Other details were also on the softer side including breadth, wages and hours worked. That market reaction reversed upon itself as markets returned to focus upon inflation worries backed by ISM-services prices paid and Fed comments.
Markets Temporarily Rejoiced — But the Fed Won’t
The 2-year Treasury yield fell by as much as 13bps post-release but reined that in to what is now only a 2–3bps decline after payrolls and ISM-services. Pricing for cumulative rate cuts by the December meeting moved back above more than 50bps to being on the fence between 50 and 75 bps of cuts but then reversed most of that (chart 1). Stocks loved it all at first with e-mini S&P futures gaining another 0.75% post-release of nonfarm payrolls and setting up a solid cash market open likely on the theory that job growth is good enough for the economy but light enough to reawaken sentiment in favour of Fed rate cuts. That sentiment was cut in half as the morning wore on. The USD noticeably depreciated including a nearly half penny appreciation in the C$ at first before US dollar strength returned to drive CAD a touch weaker.
I don’t think Chair Powell will be swayed by the payroll figures and for two reasons. For one, he’s already onto the narrative that the job market is rebalancing away from excess demand for labour with a pick-up in population growth aiding the supply side while trend job growth is still strong enough to absorb new entrants. For another, the Committee’s focus is squarely upon the price stability part of the dual mandate where they need to see a resumption of progress toward lower core inflation readings after recently hotter ones. Barring a collapse in job growth, the focus in terms of easing policy will remain on inflation as punctuated by ISM-prices paid.
Soft Details
The 175k rise in nonfarm payrolls was ok, but below consensus and revisions knocked a small amount of jobs off of the prior two months (-22k) that are now reported at +315k in March (from 303k previously) and +236k (from 270k).
Breadth was also soft as shown in chart 2. Employment in the goods sector was up by only 14k and split between construction and manufacturing. Employment in the services sector was up 153k with health and social services accounting for a little over half of that.
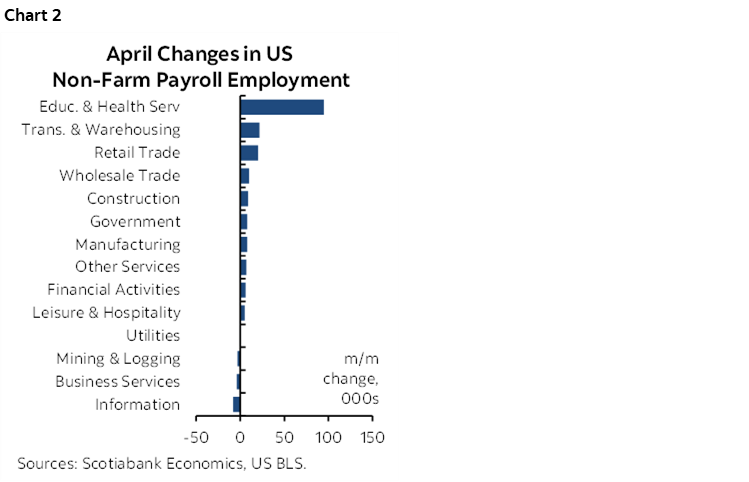
The biggest deceleration was in government hiring. Government slowed markedly to +8k compared to the prior months in the 50–75k range with the Federal government hiring only 2k workers and state/local governments adding 6k. I don’t know this for sure, but it’s feasible that the Federal portion was weighed down by the army’s announced restructuring in February/March; the net effect and timing of reductions is unclear.
Wages
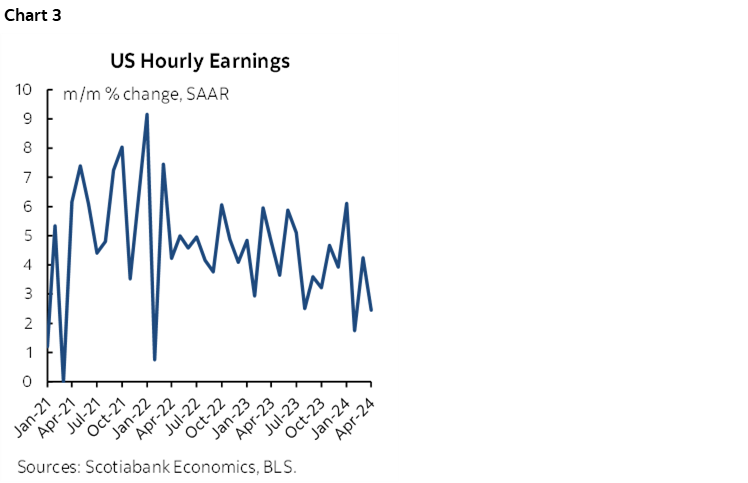
Wage growth slowed to 0.2% m/m SA from 0.3% previously.
The trend remains pointed lower (chart 3). The three-month moving average for m/m wage gains nevertheless slowed to 2.8% m/m SAAR from 4% the prior month. The six-month moving average was stable at 3.9% (4% prior).
Slightly More Slack
The unemployment rate edged up a tenth to 3.9% which continues the mild ascent from a low of 3.4% about a year-ago to a half point higher now. The UR moved up last month because the companion household survey posted a +25k gain in jobs and an 87k rise in the labour force. Both figures are small, but the labour force grew at a slightly faster pace than jobs and the participation rate has been moving up this year (chart 4).

As a reminder, the noise in the household survey (from which the UR is derived) is even greater than for nonfarm. The 90% confidence interval for the change in the number of unemployed from month to month is +/-300,000 and for the UR it is +/- 0.2 ppts.
In my opinion, markets have little appreciation for, or understanding of, the noise factor behind these numbers. It’s a fine state of affairs when volatile markets are chasing white noise...
Soft Hours = Soft GDP Growth
Hours worked were also soft after two very strong prior months. They fell by -0.17% m/m SA in April after rising by 0.5% m/m and 0.4% m/m in the prior two months.
Q1 saw a rise of 1% q/q SAAR in total hours worked and Q1 is tracking at a similar pace of 1.2% based solely on April and the Q1 average (chart 5).

This matters because GDP is an identity defined as hours worked times labour productivity, and so the first glimpse at Q2 data suggests that hours worked are contributing to mild GDP growth barring a pick up in productivity growth compared to the slow down in Q1.
This Changes Nothing for the Fed
Fed Governor Bowman was quick to pounce after the release and made it clear that, at least in her mind, it’s not about jobs. Her published remarks repeated a readiness to hike if inflation disappoints.
The pace of payrolls growth is still a little higher than what is needed to absorb entrants and Chair Powell has been clear that the labour market is rebalancing toward less excess demand in any event. His focus is inflation. They look at a suite of measures that support the rebalancing narrative, like the ratio of JOLTS job openings to the number of unemployed, outright job postings, and a pick up in population growth (although from nothing previously...).
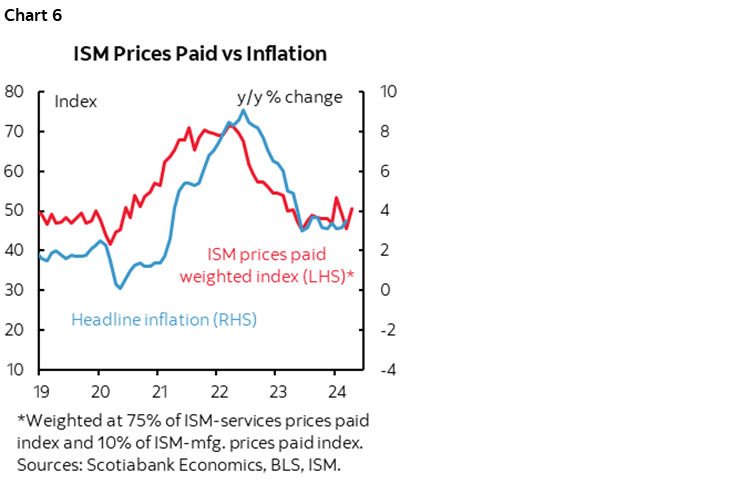
I think the reaction to ISM-services that landed after payrolls highlights the focus upon inflation. ISM-services disappointed by falling two points to 49.4 and hence barely into contraction territory signalling weakness in the services sector last month. Markets ignored that and focused upon the fact that the ISM-services report signalled a large jump in prices paid by almost five points to 59.2. That suggests firmer price pressures. Chart 6 shows the weighted ISM prices paid readings correlated to inflation over the pandemic era and indicates that inflation is likely to remain sticky. It’s a stronger but very volatile relationship over a longer period of time.
ISM Might Have Totally Missed Any Easter Effect in Both March and April
Besides, the Easter Bunny may have pooped on the ISM weaker headline. The earlier than normal Good Friday on March 29th and Easter Sunday/Monday on March 31st / April 1st robbed retailers of some of the normal Easter holiday spending that more often occurs in April. In fact, it’s entirely possible that the Easter effect on services including retail was completely missed in the March and April ISM readings.
This is because the ISM survey goes out at the start of the month but the ISM folks say they usually get most responses late in the month. The distribution of the responses is therefore very likely to have been skewed before the March 30th G.F. and March 31st that pushed into the weekend and therefore may not have captured much of an Easter effect in March. It’s highly doubtful that all responses came in at the very last minute and captured Easter effects in late March. It’s more likely that ISM-services failed to capture any Easter boost this year with responses for full month activity during April received later in the month.
DISCLAIMER
This report has been prepared by Scotiabank Economics as a resource for the clients of Scotiabank. Opinions, estimates and projections contained herein are our own as of the date hereof and are subject to change without notice. The information and opinions contained herein have been compiled or arrived at from sources believed reliable but no representation or warranty, express or implied, is made as to their accuracy or completeness. Neither Scotiabank nor any of its officers, directors, partners, employees or affiliates accepts any liability whatsoever for any direct or consequential loss arising from any use of this report or its contents.
These reports are provided to you for informational purposes only. This report is not, and is not constructed as, an offer to sell or solicitation of any offer to buy any financial instrument, nor shall this report be construed as an opinion as to whether you should enter into any swap or trading strategy involving a swap or any other transaction. The information contained in this report is not intended to be, and does not constitute, a recommendation of a swap or trading strategy involving a swap within the meaning of U.S. Commodity Futures Trading Commission Regulation 23.434 and Appendix A thereto. This material is not intended to be individually tailored to your needs or characteristics and should not be viewed as a “call to action” or suggestion that you enter into a swap or trading strategy involving a swap or any other transaction. Scotiabank may engage in transactions in a manner inconsistent with the views discussed this report and may have positions, or be in the process of acquiring or disposing of positions, referred to in this report.
Scotiabank, its affiliates and any of their respective officers, directors and employees may from time to time take positions in currencies, act as managers, co-managers or underwriters of a public offering or act as principals or agents, deal in, own or act as market makers or advisors, brokers or commercial and/or investment bankers in relation to securities or related derivatives. As a result of these actions, Scotiabank may receive remuneration. All Scotiabank products and services are subject to the terms of applicable agreements and local regulations. Officers, directors and employees of Scotiabank and its affiliates may serve as directors of corporations.
Any securities discussed in this report may not be suitable for all investors. Scotiabank recommends that investors independently evaluate any issuer and security discussed in this report, and consult with any advisors they deem necessary prior to making any investment.
This report and all information, opinions and conclusions contained in it are protected by copyright. This information may not be reproduced without the prior express written consent of Scotiabank.
™ Trademark of The Bank of Nova Scotia. Used under license, where applicable.
Scotiabank, together with “Global Banking and Markets”, is a marketing name for the global corporate and investment banking and capital markets businesses of The Bank of Nova Scotia and certain of its affiliates in the countries where they operate, including; Scotiabank Europe plc; Scotiabank (Ireland) Designated Activity Company; Scotiabank Inverlat S.A., Institución de Banca Múltiple, Grupo Financiero Scotiabank Inverlat, Scotia Inverlat Casa de Bolsa, S.A. de C.V., Grupo Financiero Scotiabank Inverlat, Scotia Inverlat Derivados S.A. de C.V. – all members of the Scotiabank group and authorized users of the Scotiabank mark. The Bank of Nova Scotia is incorporated in Canada with limited liability and is authorised and regulated by the Office of the Superintendent of Financial Institutions Canada. The Bank of Nova Scotia is authorized by the UK Prudential Regulation Authority and is subject to regulation by the UK Financial Conduct Authority and limited regulation by the UK Prudential Regulation Authority. Details about the extent of The Bank of Nova Scotia's regulation by the UK Prudential Regulation Authority are available from us on request. Scotiabank Europe plc is authorized by the UK Prudential Regulation Authority and regulated by the UK Financial Conduct Authority and the UK Prudential Regulation Authority.
Scotiabank Inverlat, S.A., Scotia Inverlat Casa de Bolsa, S.A. de C.V, Grupo Financiero Scotiabank Inverlat, and Scotia Inverlat Derivados, S.A. de C.V., are each authorized and regulated by the Mexican financial authorities.
Not all products and services are offered in all jurisdictions. Services described are available in jurisdictions where permitted by law.