- The US job market is suddenly weaker than previously thought
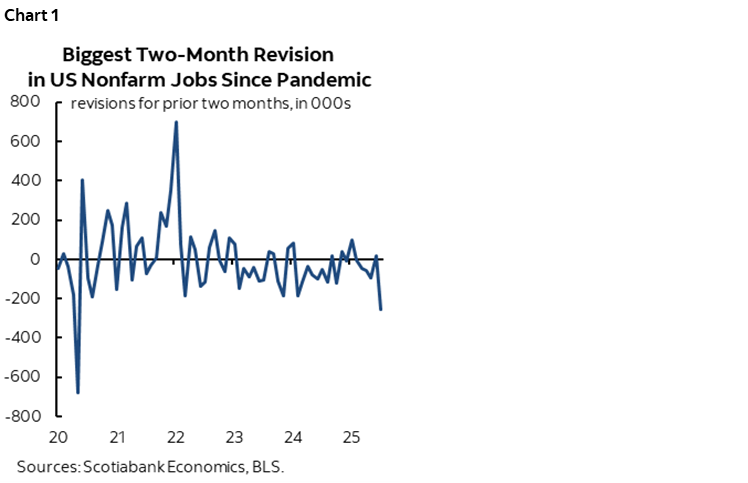
- Negative revisions were the biggest since the pandemic first struck
- What explains the revisions
- July payrolls missed expectations but were swamped by the negative revisions
- Trump administration policies are likely at fault…
- ...but so may be data quality…
- ...that may be informed by whether survey responses tanked amid the uncertainty
- Stocks fell, but rates might be getting the Fed narrative dead wrong...
- ...as the bigger policy pivot may have to be made by the Trump administration
- US nonfarm payrolls m/m 000s / UR %, SA, July:
- Actual: 73 / 4.2
- Scotia: 150 / 4.0
- Consensus: 104 / 4.2
- Prior: 14 / 4.1 (revised from 147 / 4.1)
- Two-month revision to change in payrolls: -258
Nonfarm payrolls sharply disappointed expectations primarily on record negative revisions unseen since the very depths of the pandemic (chart 1). Before digging into the numbers and interpretations and concerns about the numbers, my key takeaways are the following:
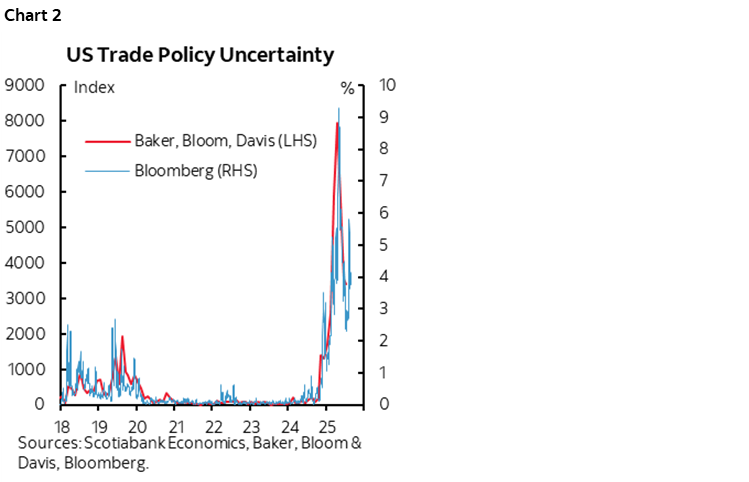
- The impact of the economic uncertainty (chart 2) being driven by the Trump administration’s policies on the labour market is suddenly becoming much clearer. If the data is genuine and stands up to further revisions, then in my view this is a Trump effect, not a Powell effect. Monetary policy isn’t what has changed so rapidly in such a short period of time.
- Second, perhaps some good may come of it. To date, markets and fundamentals have not shown enough of an impact of soaring policy uncertainty. That may be changing. If so, then along with the ongoing court challenge against Trump’s tariffs, this may be the best hope to restore some sense of reason within the US administration in terms of the toxic effects of its trade policies on the world and US economies. All along, the best hope for pushing back against US tariffs as they went globally has been to exact a toll on the US itself.
- Third, I have even bigger concerns about US data quality now and will explain why.
- Fourth, markets are wrong in pursuing a one-way bet on implications for the Fed that are driving short-term Treasury yields much lower. The US two-year yield is down 23bps on the day so far in a bull steepener that has US 10s down 14bps . The S&P500 is down 1½% on the day thus far. The dollar is broadly weaker. The Fed is heading into stagflation risks and the implications for monetary policy are much less clear than the knee-jerk reaction in markets which I’ll come back to.
WHAT CAUSED THE REVISIONS
There were two fundamental drivers of the 258k negative revision to job growth in May and June that is now reported as 14k in June (was 147k) and 19k in May (instead of 144k).
Chart 3 breaks down two sources of the revisions. The BLS recalculated seasonal adjustment factors for those two months. This had the effect of lowering estimated growth in payrolls over those two months by 77k (-97k in May, +20k in June). A lower SA factor accounted for most of May’s revision.
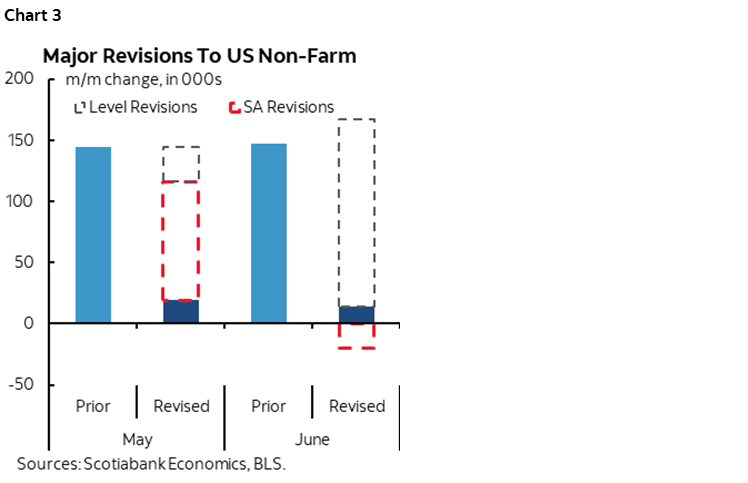
The biggest source of the overall 258k negative revision, however, was that the estimated level of seasonally unadjusted payrolls was revised lower. That accounted for the remaining 181k of negative revisions to the two months and was responsible for taking down June payrolls.
No explanations were offered by the BLS other than to flag that they always incorporate additional reports and data that have since become available and recalculation of seasonal factors.
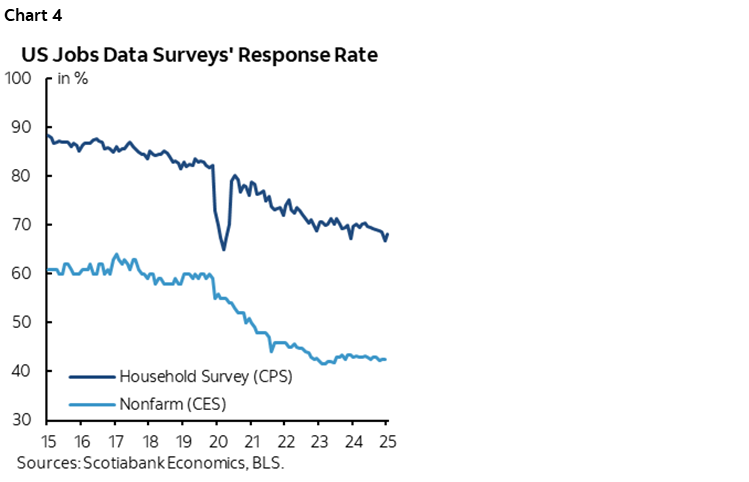
So what really caused the revisions to seasonally unadjusted payrolls in May and June? That’s unclear, but it’s possible that amid the turmoil that has employers scrambling to deal with the effects of rapid change to trade, immigration, fiscal and other policies, that data quality is being further impaired by low response rates. Nobody is answering the BLS. Well, not nobody, but clearly far fewer than was once the case. Chart 4 shows the response rates to the nonfarm payrolls and household surveys. Response rates have long been in decline, but fell particularly hard at the start of the pandemic. Unfortunately the BLS presently only makes the response rates available up to March for payrolls and April for the household survey (here). We can’t tell what happened to them in May and June when developments like the wild tariff and immigration policies began to kick in.
But did response rates fall even more than usual in May and June as turmoil hit? Was it like the start of the pandemic in that sense when all hands on deck were being applied to managing new risks and not answering government surveys? Did federal government employees dealing with DOGE cuts cut back on survey responses? We’ll be watching this data carefully.
Bigger potential revisions are coming in the September 9th preliminary benchmark revisions that incorporate the updated Quarterly Census of Employment and Wages (WCEW) for March of this year. Those revisions can be very large when they happen.
THE DETAILS
Chart 5 shows that hiring was soft across most sectors but that popular theories about why payrolls could be weak were not the reasons.
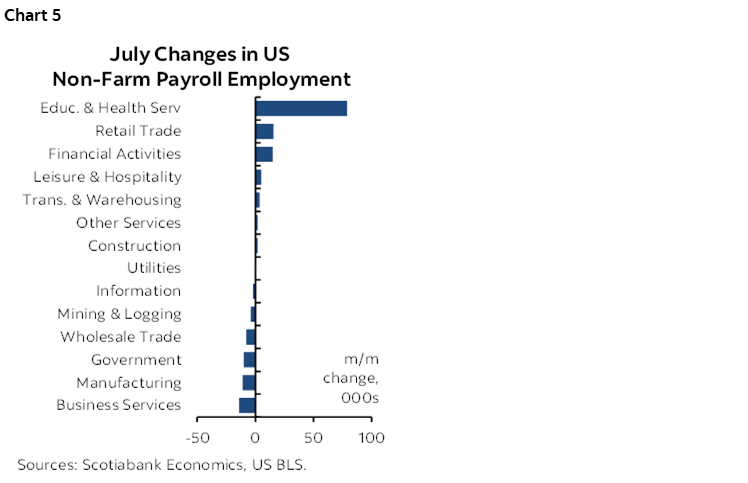
For instance, private education and health added another 79k jobs led by health. Health jobs are partially benefitting from associated visa sponsorship in some cases which is valuable as immigration policy shifts. Some forecasters thought this category would tank.
Government jobs fell by only 10k in July, entirely due to federal government losses (-12k) while state and local government employment was flat. Some felt that state/local government hiring would tank after the previously reported surge and were half right. It didn’t tank in July, but the previously reported surge in June was suddenly wiped out to now post a state/local gain of just 20k which is one-quarter the reported amount for June before this revision. How can mess up government employment so badly? Maybe DOGE cuts explain this.
All other sectors posted a range of small losses to small gains in payrolls.
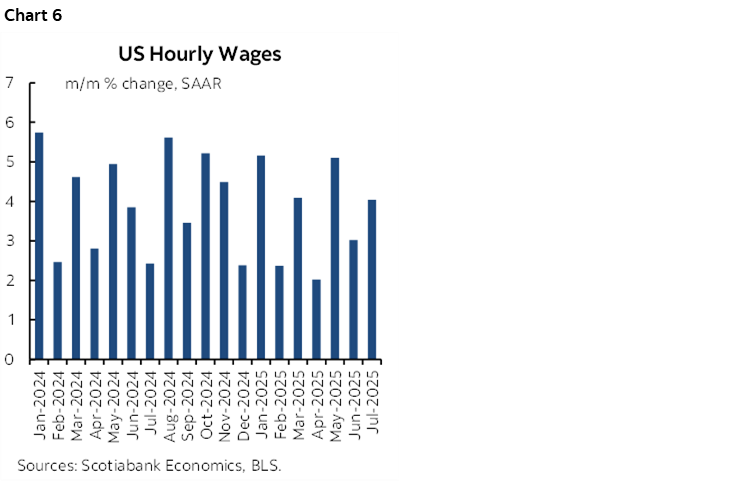
Wage growth picked up to 4% m/m SAAR (chart 6).
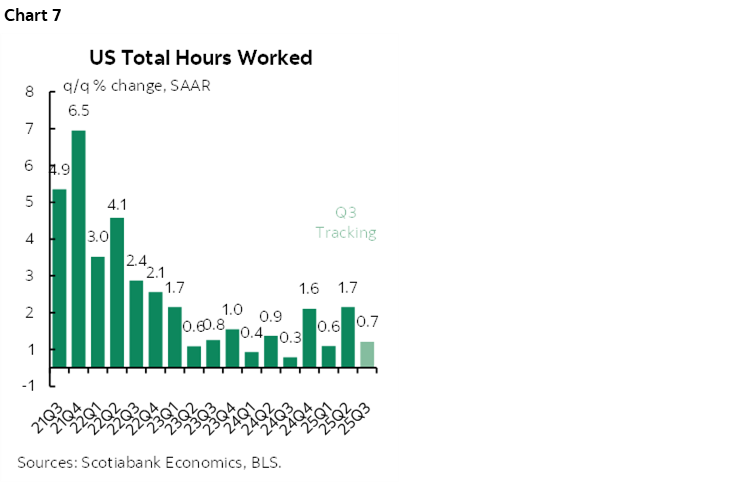
Hours worked rebounded in July by posting a 0.35% m/m SA gain that reversed the –0.3% drop the prior month. It’s early, but so far we’re tracking 0.7% q/q SAAR growth in hours worked in Q2 versus the 1.7% gain in Q2 (chart 7). Hours worked are tracking toward the bottom end of the range of the weakest growth rates in recent years. Since GDP is hours times labour productivity, this points to an early warning sign on economic growth in Q3 pending what happens with further data and productivity.
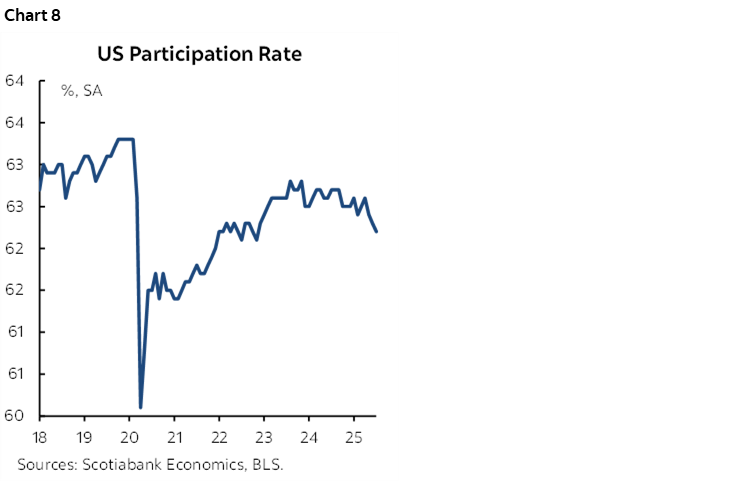
The unemployment rate bumped up a tenth to 4.2% in July. That’s because it’s derived from the companion household survey that registered an employment loss of 260k that exceeded the 38k decline in the size of the eligible labour force.
As a result of the drop in the labour force, the participation rate fell a tick to 62.3% and is down from the year’s peak of 62.6% (chart 8). It’s unclear why, but some combination of aggressive immigration policy that is removing people from the workforce and causing others to avoid workplaces and discouraged workers are likely explanations.
STAGFLATION IS THE FED’S WORST NIGHTMARE
Markets assumed that the Fed will rapidly shift toward easing on the back of numbers like these. That may be premature. September is mostly priced for a cut with over 50bps priced by year-end.
For one thing, it’s just one report, and who knows what future revisions, future policies and other data may bring.
For another, it’s not that +73k payrolls in July is terrible. The breakeven rate of nonfarm payrolls has likely dropped to somewhere around 80–120k. We need more data, but if job growth is slowing at the same time people are exiting the workforce then the impact on the unemployment rate could be small.
But the Fed’s dual mandate also has to monitor risks to price stability. Tariffs and tighter immigration policy pose unique risks to full employment and price stability. They could weaken hiring while raising prices. Chair Powell has explained all along that this puts dual mandate goals in conflict with one another and presents a quandary to the Fed.
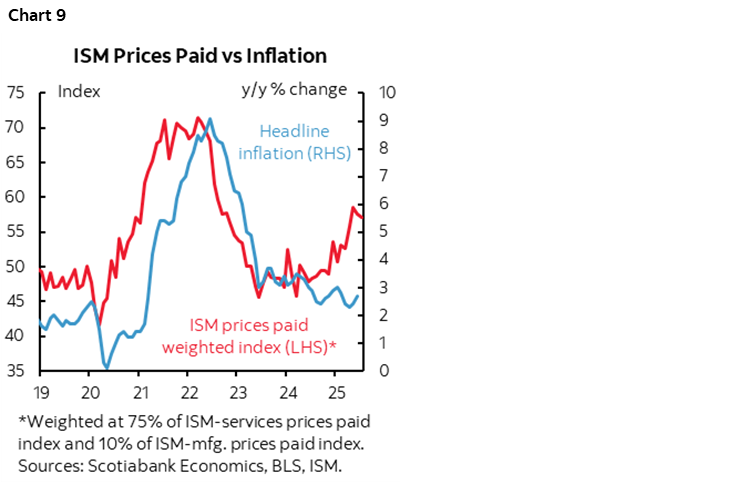
Enter chart 9. ISM-manufacturing fell this morning (48.0, 49.0 prior) as new orders remained in contraction and employment dropped at a more rapid pace. So much for bringing manufacturing home. But prices paid eased a bit (64.8, 69.7 prior) but are still rising rapidly above the 50 threshold, and some drivers might weaken further given what’s happening to oil this morning (-3%) and copper over the past couple of days. And yet, underlying prices for a broad cross-section of goods face risk of tariff pass-through. We need ISM-services-prices next week to update this chart, but the information we have to date shows potentially large lagging upward pressures upon prices based on correlations between ISM-prices and CPI.
This policy quandary is not reflected in strident perspectives offered by Governors Waller and Bowman in their explanations for dissenting votes that were shared before the data (here and here). They may be right. They may also be applying for Powell’s job.
Credit to Cleveland’s Beth Hammack (nonvoting, voting 2026), however, for reminding markets of Powell’s points. She prudently cautioned we need to watch the labour market very carefully, but also argued inflation would move up and the Fed has to balance both mandates. Markets didn’t do that this morning. More data, more developments and more communications may influence this initial market take. Also credit to Atlanta’s Bostic (nonvoting, voting 2027) who struck a similar chord.
What is unspoken among the officials, however, is the important moral hazard issue. Bad policy > bad data > >bad market responses > Fed easing > bad policy, rinse repeat. The biggest risk to Powell’s legacy may lie in enabling damaging protectionism.
DISCLAIMER
This report has been prepared by Scotiabank Economics as a resource for the clients of Scotiabank. Opinions, estimates and projections contained herein are our own as of the date hereof and are subject to change without notice. The information and opinions contained herein have been compiled or arrived at from sources believed reliable but no representation or warranty, express or implied, is made as to their accuracy or completeness. Neither Scotiabank nor any of its officers, directors, partners, employees or affiliates accepts any liability whatsoever for any direct or consequential loss arising from any use of this report or its contents.
These reports are provided to you for informational purposes only. This report is not, and is not constructed as, an offer to sell or solicitation of any offer to buy any financial instrument, nor shall this report be construed as an opinion as to whether you should enter into any swap or trading strategy involving a swap or any other transaction. The information contained in this report is not intended to be, and does not constitute, a recommendation of a swap or trading strategy involving a swap within the meaning of U.S. Commodity Futures Trading Commission Regulation 23.434 and Appendix A thereto. This material is not intended to be individually tailored to your needs or characteristics and should not be viewed as a “call to action” or suggestion that you enter into a swap or trading strategy involving a swap or any other transaction. Scotiabank may engage in transactions in a manner inconsistent with the views discussed this report and may have positions, or be in the process of acquiring or disposing of positions, referred to in this report.
Scotiabank, its affiliates and any of their respective officers, directors and employees may from time to time take positions in currencies, act as managers, co-managers or underwriters of a public offering or act as principals or agents, deal in, own or act as market makers or advisors, brokers or commercial and/or investment bankers in relation to securities or related derivatives. As a result of these actions, Scotiabank may receive remuneration. All Scotiabank products and services are subject to the terms of applicable agreements and local regulations. Officers, directors and employees of Scotiabank and its affiliates may serve as directors of corporations.
Any securities discussed in this report may not be suitable for all investors. Scotiabank recommends that investors independently evaluate any issuer and security discussed in this report, and consult with any advisors they deem necessary prior to making any investment.
This report and all information, opinions and conclusions contained in it are protected by copyright. This information may not be reproduced without the prior express written consent of Scotiabank.
™ Trademark of The Bank of Nova Scotia. Used under license, where applicable.
Scotiabank, together with “Global Banking and Markets”, is a marketing name for the global corporate and investment banking and capital markets businesses of The Bank of Nova Scotia and certain of its affiliates in the countries where they operate, including; Scotiabank Europe plc; Scotiabank (Ireland) Designated Activity Company; Scotiabank Inverlat S.A., Institución de Banca Múltiple, Grupo Financiero Scotiabank Inverlat, Scotia Inverlat Casa de Bolsa, S.A. de C.V., Grupo Financiero Scotiabank Inverlat, Scotia Inverlat Derivados S.A. de C.V. – all members of the Scotiabank group and authorized users of the Scotiabank mark. The Bank of Nova Scotia is incorporated in Canada with limited liability and is authorised and regulated by the Office of the Superintendent of Financial Institutions Canada. The Bank of Nova Scotia is authorized by the UK Prudential Regulation Authority and is subject to regulation by the UK Financial Conduct Authority and limited regulation by the UK Prudential Regulation Authority. Details about the extent of The Bank of Nova Scotia's regulation by the UK Prudential Regulation Authority are available from us on request. Scotiabank Europe plc is authorized by the UK Prudential Regulation Authority and regulated by the UK Financial Conduct Authority and the UK Prudential Regulation Authority.
Scotiabank Inverlat, S.A., Scotia Inverlat Casa de Bolsa, S.A. de C.V, Grupo Financiero Scotiabank Inverlat, and Scotia Inverlat Derivados, S.A. de C.V., are each authorized and regulated by the Mexican financial authorities.
Not all products and services are offered in all jurisdictions. Services described are available in jurisdictions where permitted by law.