Canada is on track for a full jobs recovery by summer…
...well ahead of the US on the ‘inclusive’ recovery angle…
...which supports BoC tightening before the Fed
Broad details were solid
A setback in April is likely, but vaccines and renewed easing of restrictions could drive a powerful rebound
Hours worked point to further resilience in GDP growth
The biggest cities once again played a small role
Canadian jobs m/m 000s // UR %, SA, March:
Actual: 303.1 / 7.5
Scotia: 100 / 7.9
Consensus: 100 / 8.0
Prior: 259.2 / 8.2
Canada is on track for a full recovery in employment by this summer and hence far ahead of the United States. This carries significant implications for relative central bank and fiscal policy actions between the two countries.
Chart 1 vividly illustrates this point for some of the Canada haters out there. Employment now stands at 98.5% of pre-pandemic levels. The US is at roughly 95% in terms of both the nonfarm payrolls measure and the US household survey that is more closely aligned in nature to the Canadian household survey. Chart 2 depicts the jobs trend in Canada in actual numbers. The accompanying table breaks down some of the highlights for March’s job gain. Chart 3 also shows that the labour force participation rate has also almost fully recovered and is just 0.3% shy of February 2020 and up 5.2 points from last April. Chart 4 shows where the modest cumulative jobs shortfall resides by sector.
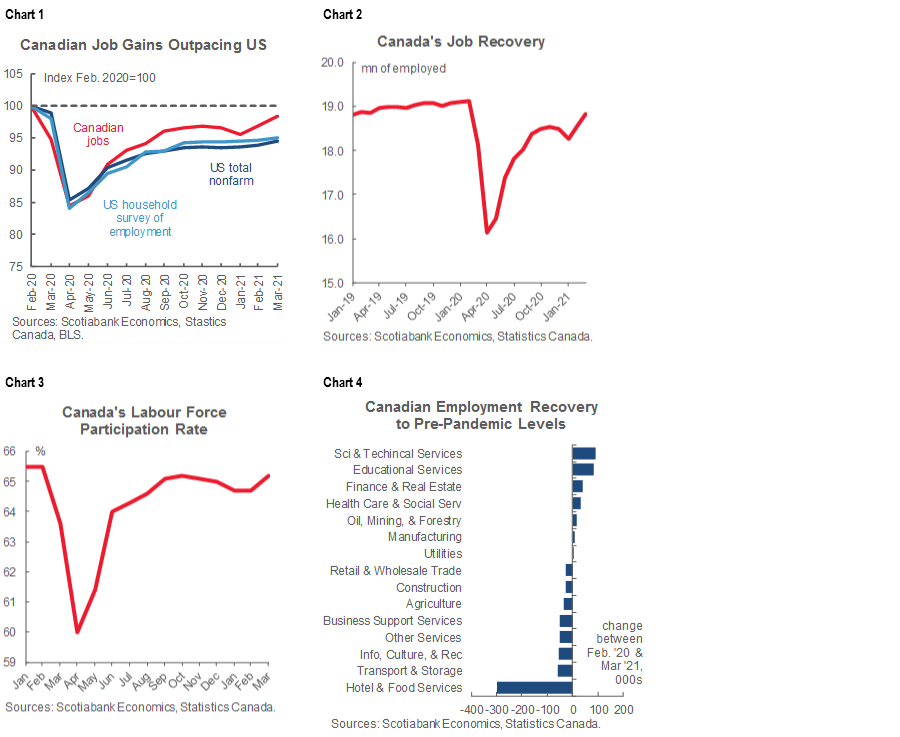

With a consensus-smashing 303k jobs (re)created in March, Canadian employment is now down by ‘only’ 296k compared to pre-pandemic levels which recoups the overwhelming majority of the 3 million jobs that were lost at the worst point last April. By comparison, US nonfarm payrolls are still down by 8.4 million and the US household survey is down by 7.9 million. Given a roughly nine-to-one population difference, the considerably worse US performance relative to Canada doesn’t come close to being explained away by relative market size.
How is this happening? From reading the daily doom feeds in the press and elsewhere one would be forgiven for thinking that Canada must be way behind the US. Not! Let’s let some facts do the talking over the political rants. Canada’s cumulative covid-19 case count sits at about 1 million versus 31 million in the US and the relative population difference would only explain a nine-to-one differential, not 31-to-1. Canada’s public policy mixture in addressing the virus has been different and more oriented toward containment measures for various reasons, like multiple drivers behind lagging vaccine underperformance but also relatively greater conformance to the restrictions in Canada than the US. Further, even with vastly lower cases, Canada applied materially more stimulus relative to GDP than the US did in 2020. Going forward, Canada is likely 3–6 months behind the US vaccine curve and incremental fiscal stimulus while the upswing of a commodity cycle and imported effects of US stimulus offer benefits. Throughout this relative policy mixture of stimulus and containment, Canada’s economy and job market have been proven to be resilient. You and I might be obsessed by tracking the numbers, but mainstreet probably understands this better than anyone which might help to explain things like why so many homes are being purchases.
In terms of the housing connection and the debate over macroprudential policy measures, it’s worth observing that one would worry more about the strength we are seeing in sales and home prices if it wasn’t backed by such strong job gains. Ditto for the credit cycle in terms of the ability to carry debt. In just this past quarter the country gained about 400,000 jobs. The other 18½ million folks with jobs at the end of last year were no doubt driving housing and partly because of stockpiled savings and monthly cash flow that improved with less being spent on pandemic-stricken activities, but job growth also helped.
Hours worked offer three important revelations. First, the 2% m/m rise in March hours worked is a positive sign for GDP growth that month given GDP is an identity defined as hours worked times labour productivity. Second, hours worked were up by over 11% in Q1 compared to Q4 at an annualized rate, so that likely adds additional upside to GDP growth expectations last quarter that could land over 6%. Third, the gain in hours worked during March ‘bakes in’ another annualized gain in hours worked of over 7% in Q2 even before we start to get any Q2 data (chart 5)!

It’s worth expanding on this last point. April’s hours worked will very likely take a step back due to re-imposed restrictions, but the way the first quarter transitioned to the second quarter may combine with a more robust way in which Canada exits Q2 on hours worked and jobs if restrictions ease again before the end of Q2. That could mean that April will be sandwiched between more positive entry and exit dynamics over the quarter that could maintain strong GDP growth and hence resilience.
The overall tone of the report was resoundingly positive across other details:
- Full-time jobs accounted for about 58% of the overall gain with 175k full-time positions and 128k part-time jobs created.
- Most of the rise was in payroll jobs that were up by about 247k with self-employed jobs up 56k. That’s not at all to knock self-employed jobs, but the data quality is often perceived as softer than payroll jobs.
- 82% of the payroll employment gain was in the private sector (+201k) with public sector payroll jobs up by 45.5k.
- by sector (Chart 6), services led the way with 260k jobs created and goods sectors added 43k. Within goods, the gain was skewed toward construction jobs (+25.7k) with manufacturing up 8k. Within services, the gain was spread across five sectors which indicates solid breadth.

- by province, Ontario led the way with a gain of 182k followed by Alberta (+37k), BC (+35k), Quebec (+26k) and Newfoundland and Labrador (+13k).
- Most of the gain was outside of the largest cities. In fact, 205k of the 303k rise in employment last month occurred outside of the three largest census metropolitan areas. Toronto employment was up by just 64k, Montreal was flat (+1.5k) and Vancouver added 32k jobs. I’m surprised by this because I had thought a gain in Toronto as it eased restrictions later than other regions was going to be the main if not only driver of this report. In turn, it’s encouraging to see that there was such widespread strength.
The relative policy influences on Canada compared to the US should be viewed as requiring less overall stimulus from combined monetary and fiscal policy. If Canada is nearing full employment much sooner than the US and faces closure of spare capacity later this year, then monetary policy guidance needs a significant reset into the April MPR meeting compared to guidance to date that has still tended to lean in favour of a multi-year hold. We’re not out of this yet, but the length of time during which overall conditions have proven to be much more resilient than feared on everything from jobs to GDP to housing markets could merit some confidence-building cheerleading while reining in risks attached to a protracted policy overshoot.
DISCLAIMER
This report has been prepared by Scotiabank Economics as a resource for the clients of Scotiabank. Opinions, estimates and projections contained herein are our own as of the date hereof and are subject to change without notice. The information and opinions contained herein have been compiled or arrived at from sources believed reliable but no representation or warranty, express or implied, is made as to their accuracy or completeness. Neither Scotiabank nor any of its officers, directors, partners, employees or affiliates accepts any liability whatsoever for any direct or consequential loss arising from any use of this report or its contents.
These reports are provided to you for informational purposes only. This report is not, and is not constructed as, an offer to sell or solicitation of any offer to buy any financial instrument, nor shall this report be construed as an opinion as to whether you should enter into any swap or trading strategy involving a swap or any other transaction. The information contained in this report is not intended to be, and does not constitute, a recommendation of a swap or trading strategy involving a swap within the meaning of U.S. Commodity Futures Trading Commission Regulation 23.434 and Appendix A thereto. This material is not intended to be individually tailored to your needs or characteristics and should not be viewed as a “call to action” or suggestion that you enter into a swap or trading strategy involving a swap or any other transaction. Scotiabank may engage in transactions in a manner inconsistent with the views discussed this report and may have positions, or be in the process of acquiring or disposing of positions, referred to in this report.
Scotiabank, its affiliates and any of their respective officers, directors and employees may from time to time take positions in currencies, act as managers, co-managers or underwriters of a public offering or act as principals or agents, deal in, own or act as market makers or advisors, brokers or commercial and/or investment bankers in relation to securities or related derivatives. As a result of these actions, Scotiabank may receive remuneration. All Scotiabank products and services are subject to the terms of applicable agreements and local regulations. Officers, directors and employees of Scotiabank and its affiliates may serve as directors of corporations.
Any securities discussed in this report may not be suitable for all investors. Scotiabank recommends that investors independently evaluate any issuer and security discussed in this report, and consult with any advisors they deem necessary prior to making any investment.
This report and all information, opinions and conclusions contained in it are protected by copyright. This information may not be reproduced without the prior express written consent of Scotiabank.
™ Trademark of The Bank of Nova Scotia. Used under license, where applicable.
Scotiabank, together with “Global Banking and Markets”, is a marketing name for the global corporate and investment banking and capital markets businesses of The Bank of Nova Scotia and certain of its affiliates in the countries where they operate, including; Scotiabank Europe plc; Scotiabank (Ireland) Designated Activity Company; Scotiabank Inverlat S.A., Institución de Banca Múltiple, Grupo Financiero Scotiabank Inverlat, Scotia Inverlat Casa de Bolsa, S.A. de C.V., Grupo Financiero Scotiabank Inverlat, Scotia Inverlat Derivados S.A. de C.V. – all members of the Scotiabank group and authorized users of the Scotiabank mark. The Bank of Nova Scotia is incorporated in Canada with limited liability and is authorised and regulated by the Office of the Superintendent of Financial Institutions Canada. The Bank of Nova Scotia is authorized by the UK Prudential Regulation Authority and is subject to regulation by the UK Financial Conduct Authority and limited regulation by the UK Prudential Regulation Authority. Details about the extent of The Bank of Nova Scotia's regulation by the UK Prudential Regulation Authority are available from us on request. Scotiabank Europe plc is authorized by the UK Prudential Regulation Authority and regulated by the UK Financial Conduct Authority and the UK Prudential Regulation Authority.
Scotiabank Inverlat, S.A., Scotia Inverlat Casa de Bolsa, S.A. de C.V, Grupo Financiero Scotiabank Inverlat, and Scotia Inverlat Derivados, S.A. de C.V., are each authorized and regulated by the Mexican financial authorities.
Not all products and services are offered in all jurisdictions. Services described are available in jurisdictions where permitted by law.