- Canada’s economy ended an as-expected Q1 on a softening note…
- ...ahead of deepening downside risks driven by erratic US policy
- The US economy was stronger than GDP indicated for Q1…
- ...given solid growth net of wild tariff-driven import and inventories swings
- US core inflation was hot in Q1 but ended on a soft note ahead of tariffs
- N.A. GDP growth will quickly begin to weaken due to US government policies
- Canadian GDP, m/m % SA, February:
- Actual: -0.2
- Scotia: -0.1
- Consensus: 0.0
- Prior: 0.4
- March ‘flash’ guidance: +0.1
Canada’s economy posted mild growth in Q1 alongside volatile monthly GDP figures that broadly met expectations. The focus is all forward-looking in terms of the risks and so I’ll keep this relatively brief. There were small reactions in markets.
GDP fell –0.2% m/m in February which was weaker than consensus (0.0) and slightly weaker than my estimate (-0.1). My simple regression model was estimating –0.3%.
The preliminary ‘flash’ estimate for March GDP was +0.1% m/m which was also in line with my expectations but that was admittedly based on little information and subject to revision.
It all nets out to tracking Q1 GDP at 1.5% q/q SAAR which was in line with expectations that I wrote about in my weekly (chart 1). Ok, not great.
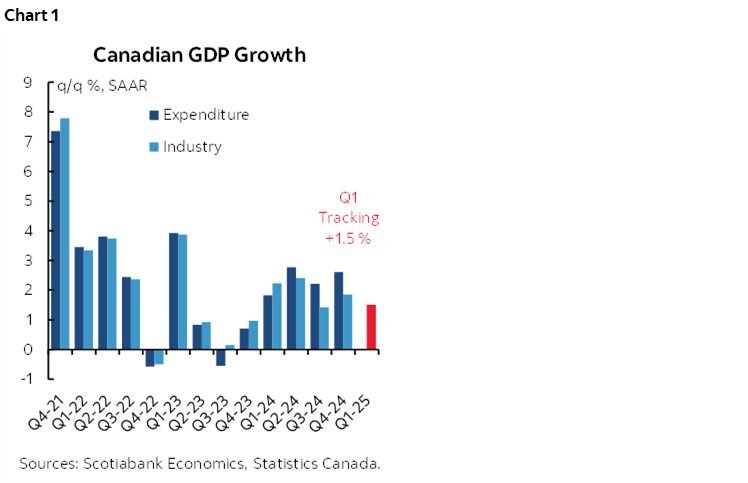
Chart 2 shows the weighted contributions to February GDP growth by sector. Growth was driven by manufacturing likely on front-running, finance and insurance, and with tiny contributions from a few others. The big drag on growth came from mining/oil/gas followed by smaller drags from other sectors.

As for March, recall that we don't get details, just the preliminary estimate of 0.1% with the verbal guidance as follows:
"Increases in mining, quarrying, and oil and gas extraction, retail trade and transportation and warehousing were partially offset by decreases in manufacturing and wholesale trade."
If we land around 1.5% for Q1 then that's in the spit zone for potential GDP which means Canada neither added to nor subtracted from a small amount of slack (ie: negative output gap). That gap hasn't worked so well in terms of explaining persistent underlying core inflation pressures that are dominated by other factors.
In any event, Q1 was probably the peak for Canadian GDP growth this year. Our forecast has less than 1% q/q annualized growth in every remaining quarter of 2025 and there is likely more downside than upside risk to that thanks to Trump’s damaging policies against the US and global economies.
- US Q1 GDP, q/q SAAR, %, Q1:
- Actual: -0.3
- Scotia: -1.1
- Consensus: -0.2
- Prior: 2.4
Sometimes GDP isn’t the greatest gauge of an economy’s strength. This is one of those times as I’ll explain.
First, on the surface, it looks like the economy was weak as it contracted by –0.3% q/q at a seasonally adjusted and annualized rate (SAAR). That looks like consensus was right, but that’s misleading since the median estimate masked the enormous range of estimates that were fairly evenly spread out from about –1% to +1%.
US GDP was stronger than the headline appeared. That’s revealed by chart 3 that breaks down the weighted contributions to GDP growth by component. Imports dragged a whopping 5 ppts off of the q/q SAAR headline growth estimate and that was due to tariff front running. Some of that showed up in inventory stocking as inventories contributed 2.25 ppts to Q1 US GDP growth. Simply put, US businesses ramped up imports and orders to give them some time to adjust to tariffs by having pre-tariff inventory on hand to meet demand.

Across other components, consumption slowed to 1.8% q/q SAAR (chart 4) and added 1.2% to GDP growth in weighted terms. Exports only added 0.2% in weighted contribution terms. Fixed Investment (ie: ex-inventories) added 1.3 ppts mostly through nonresidential investment and in turn mostly due to a 1.06 contribution from equipment purchases (chart 5). Government spending was a drag (chart 6).

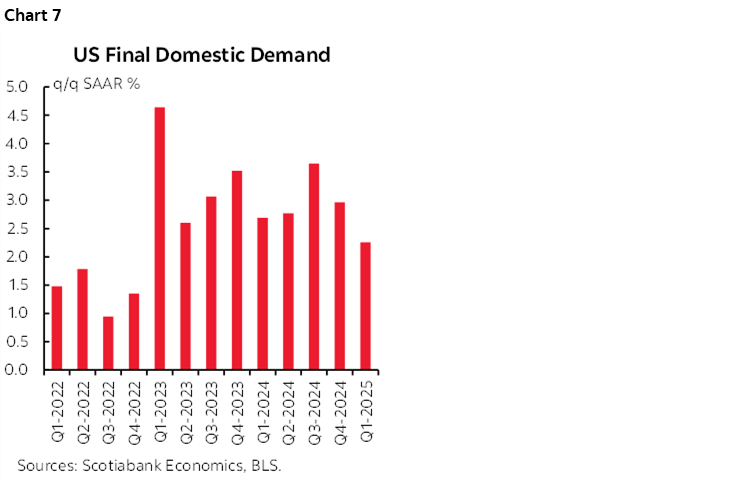
Key, however, is final domestic demand. This measure for the US takes out trade and inventories to focus more directly upon the domestic economy. FDD grew by 2.3% q/q SAAR (chart 7). That continues a slowing pattern of late, but it’s still respectable.
Unfortunately, US growth is likely to begin cratering in short order. Our forecast expects sub 1% q/q SAAR GDP growth in each of the next five quarters with the economy fully stalling out toward the end of the year. If GDP rebounds next quarter then it's likely due to net swings in import and inventory contributions to growth as tariff front-running effects dissipate and give way to emptying store shelves. The trend outlook for the US economy is bleak imo.
The bigger surprise here was that core PCE inflation ripped, landing at 3.5% q/q SAAR which was higher than expectations that were in the low 3% range (chart 8). That was mainly because February core PCE was revised up from 0.37% m/m SA to 0.5%. March core PCE inflation came in a tick softer than consensus as shown in the monthly figures (chart 9).

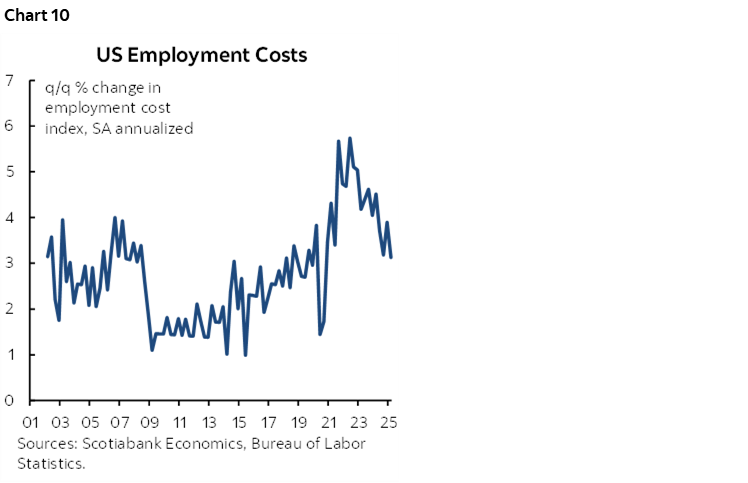
The US Q1 Employment Cost Index was up 0.9% which was on the screws (chart 10).
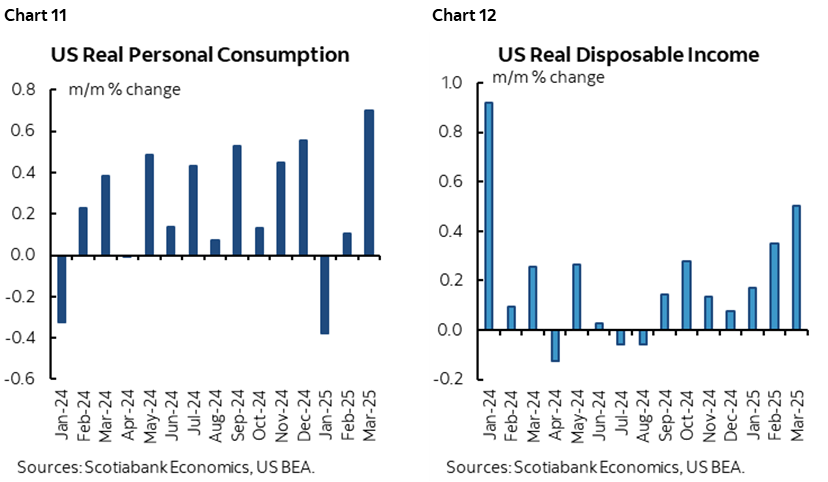
Did US consumption growth peak in March (chart 11)? It might be strong again in April given indicators like industry guidance for a surge in auto sales this month on tariff front-running. Consumption is also buoyed by income gains (chart 12). The issue going forward is to what extent consumption weakens given a combination of a) falling confidence, b) potential job losses, and c) the dissipation of tariff front-running effects. We expect a sharp weakening for consumer spending over the course of 2025.
DISCLAIMER
This report has been prepared by Scotiabank Economics as a resource for the clients of Scotiabank. Opinions, estimates and projections contained herein are our own as of the date hereof and are subject to change without notice. The information and opinions contained herein have been compiled or arrived at from sources believed reliable but no representation or warranty, express or implied, is made as to their accuracy or completeness. Neither Scotiabank nor any of its officers, directors, partners, employees or affiliates accepts any liability whatsoever for any direct or consequential loss arising from any use of this report or its contents.
These reports are provided to you for informational purposes only. This report is not, and is not constructed as, an offer to sell or solicitation of any offer to buy any financial instrument, nor shall this report be construed as an opinion as to whether you should enter into any swap or trading strategy involving a swap or any other transaction. The information contained in this report is not intended to be, and does not constitute, a recommendation of a swap or trading strategy involving a swap within the meaning of U.S. Commodity Futures Trading Commission Regulation 23.434 and Appendix A thereto. This material is not intended to be individually tailored to your needs or characteristics and should not be viewed as a “call to action” or suggestion that you enter into a swap or trading strategy involving a swap or any other transaction. Scotiabank may engage in transactions in a manner inconsistent with the views discussed this report and may have positions, or be in the process of acquiring or disposing of positions, referred to in this report.
Scotiabank, its affiliates and any of their respective officers, directors and employees may from time to time take positions in currencies, act as managers, co-managers or underwriters of a public offering or act as principals or agents, deal in, own or act as market makers or advisors, brokers or commercial and/or investment bankers in relation to securities or related derivatives. As a result of these actions, Scotiabank may receive remuneration. All Scotiabank products and services are subject to the terms of applicable agreements and local regulations. Officers, directors and employees of Scotiabank and its affiliates may serve as directors of corporations.
Any securities discussed in this report may not be suitable for all investors. Scotiabank recommends that investors independently evaluate any issuer and security discussed in this report, and consult with any advisors they deem necessary prior to making any investment.
This report and all information, opinions and conclusions contained in it are protected by copyright. This information may not be reproduced without the prior express written consent of Scotiabank.
™ Trademark of The Bank of Nova Scotia. Used under license, where applicable.
Scotiabank, together with “Global Banking and Markets”, is a marketing name for the global corporate and investment banking and capital markets businesses of The Bank of Nova Scotia and certain of its affiliates in the countries where they operate, including; Scotiabank Europe plc; Scotiabank (Ireland) Designated Activity Company; Scotiabank Inverlat S.A., Institución de Banca Múltiple, Grupo Financiero Scotiabank Inverlat, Scotia Inverlat Casa de Bolsa, S.A. de C.V., Grupo Financiero Scotiabank Inverlat, Scotia Inverlat Derivados S.A. de C.V. – all members of the Scotiabank group and authorized users of the Scotiabank mark. The Bank of Nova Scotia is incorporated in Canada with limited liability and is authorised and regulated by the Office of the Superintendent of Financial Institutions Canada. The Bank of Nova Scotia is authorized by the UK Prudential Regulation Authority and is subject to regulation by the UK Financial Conduct Authority and limited regulation by the UK Prudential Regulation Authority. Details about the extent of The Bank of Nova Scotia's regulation by the UK Prudential Regulation Authority are available from us on request. Scotiabank Europe plc is authorized by the UK Prudential Regulation Authority and regulated by the UK Financial Conduct Authority and the UK Prudential Regulation Authority.
Scotiabank Inverlat, S.A., Scotia Inverlat Casa de Bolsa, S.A. de C.V, Grupo Financiero Scotiabank Inverlat, and Scotia Inverlat Derivados, S.A. de C.V., are each authorized and regulated by the Mexican financial authorities.
Not all products and services are offered in all jurisdictions. Services described are available in jurisdictions where permitted by law.