- Treasuries sell off…
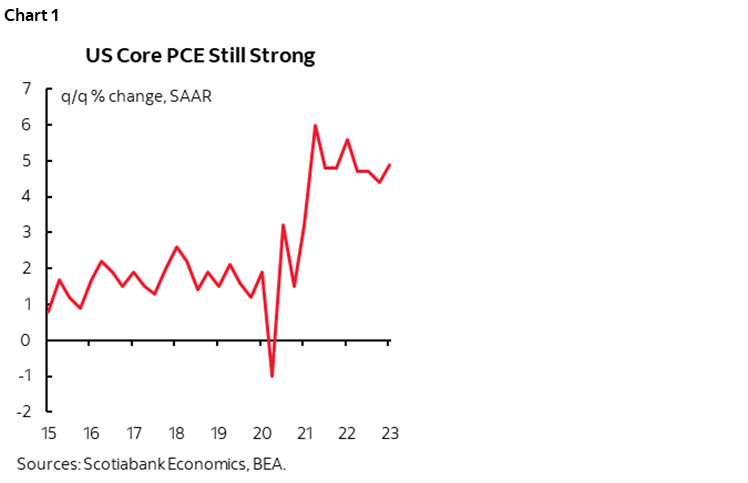
- …in reaction to hotter than expected core PCE inflation
- A 25bps hike next week is a done deal with markets pricing part of another
- US GDP disappointed…
- …but not for the surmised reasons…
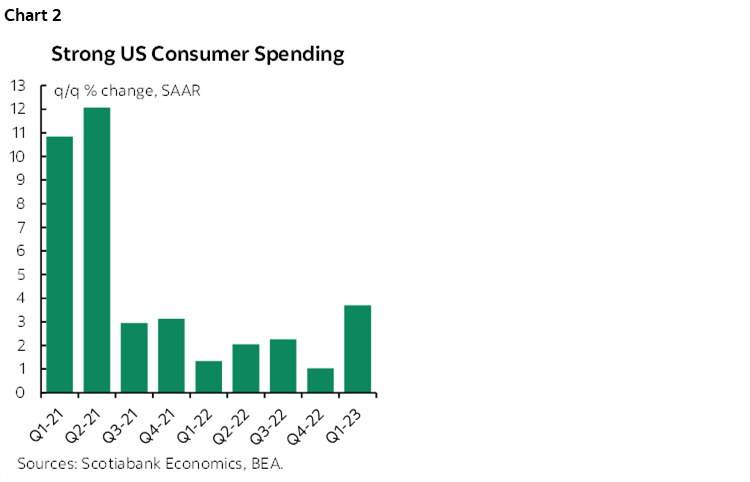
- …as US consumer spending was very strong…
- …with good reasons for continued consumer resilience
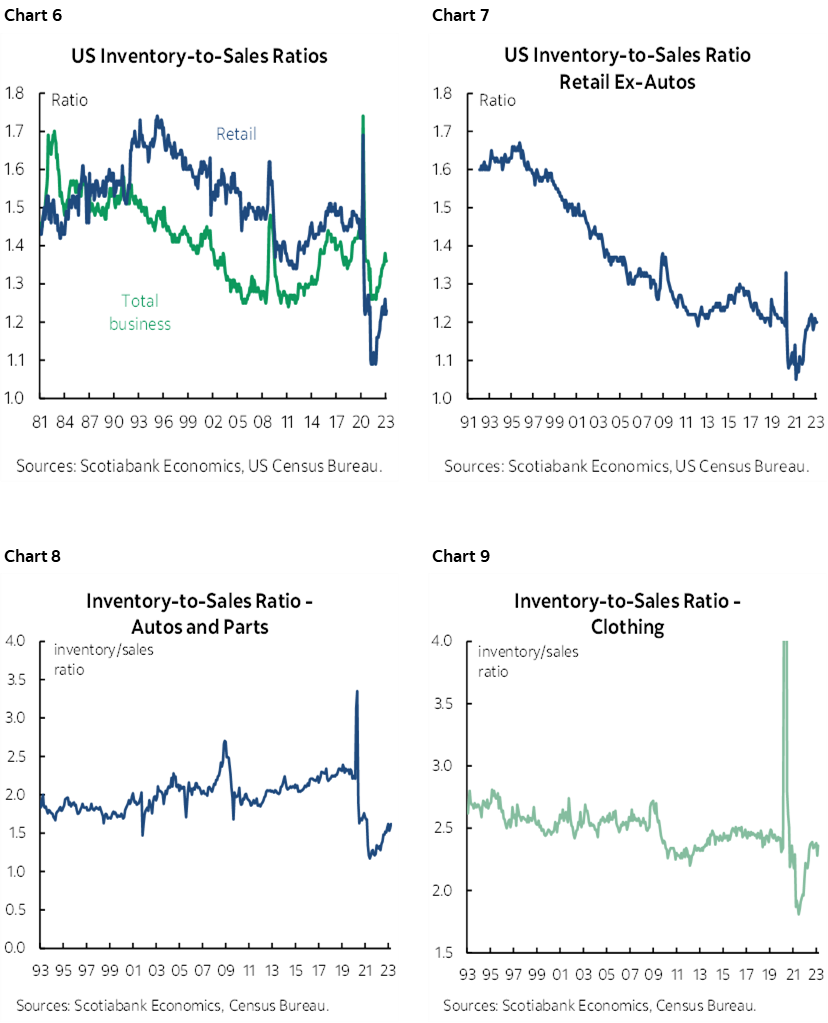
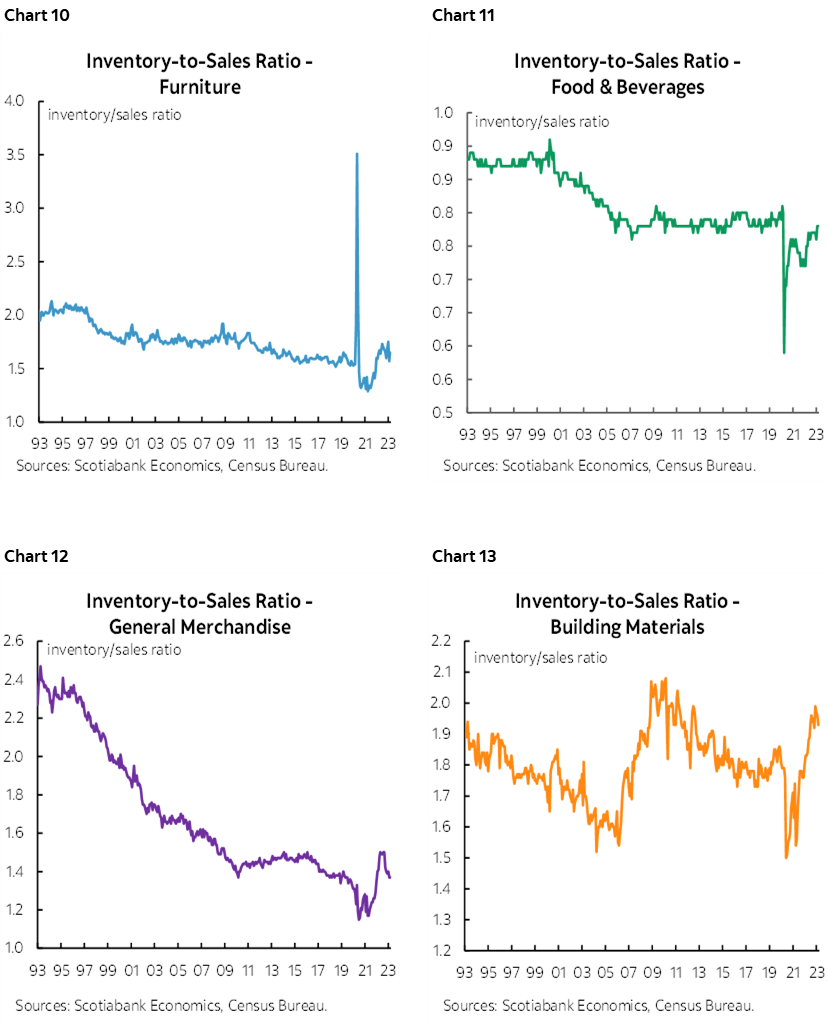
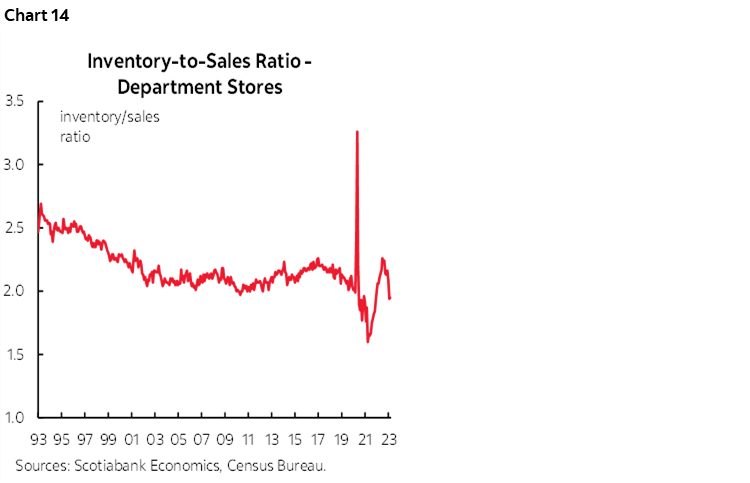
- US inventory positions remain healthy
- US initial jobless claims dip, remain range bound
- US GDP Q1 / core PCE, q/q % SAAR:
- Actual: 1.1 / 4.9
- Scotia: 2.0 / 4.7
- Consensus: 1.9 / 4.7
- Prior: 2.6 / 4.4
Core inflation surprised higher and dominated GDP in terms of market attention as the yield on the 2-year Treasury climbed by 9bps and pricing for next Wednesday’s FOMC meeting inched closer to a full quarter point and terminal rate pricing moved up 3–4bps to price part of another quarter point hike at the June meeting. The S&P is shaking it off with a gain of 0.8% so far this morning as earnings and the consumer’s resilience are mattering more. GDP did indeed surprise lower, but not at all for the reasons that were the subject of much speculation over the last couple of days or so.
Core PCE inflation landed at 4.9% q/q at a seasonally adjusted and annualized pace in Q1. That is the strongest gain since 2022Q1 and maintains persistent pressure at elevated heights (chart 1). That gain exceeded consensus expectations for a 4.7% rise and picked up the pace from 4.4% in Q4. Why this happened is not clear but will be informed by tomorrow’s breakdown of the monthly figures when we’ll get March core PCE and possible revisions to prior months. Either my estimate for March core PCE of 0.3% m/m is too low and/or there were positive revisions to prior months because in the absence of such possibilities we should have gotten 4.7% q/q SAAR.
Headline US GDP growth slipped to 1.1% q/q SAAR but I wouldn’t get all twisted out of shape over it and for two broad reasons.
The first caution always applies to the first estimate for US GDP. I’s a guess in the absence of more complete data. There can be large revisions—up or down—in the second and third swings at the figures that incorporate more complete data sources especially on services.
The second caution is that the details were more constructive than the headline GDP disappointment. The feared disappointment in consumer spending after revisions to retail sales just did not materialize. Indeed, it’s quite the opposite as inflation-adjusted consumer spending grew 3.7% q/q SAAR for the most powerful gain since 2021Q2 (chart 2). That was enough to contribute 2.5 percentage points to the 1.1% rise in GDP on a weighted contributions basis. Goods consumption added 1.5 ppts of that contribution and services added an extra 1%.
Why is the US consumer so strong? I’ll repeat past arguments about how much stronger their finances are in this hike cycle than prior ones such as into the GFC. Debt service payments are hovering around record lows as a share of disposable income; they will rise as higher rates pass through revolving and nonrevolving loans, but still remain comfortably low. Americans locked in generational lows in mortgage rates when the nominal 30-year rate fell to 2.9% and was basically free in real terms. The US household debt-to-income ratio is at its lowest in over two decades and their cash horde remains elevated as consumers squirrelled away stimulus and supports.
The flipside to consumer resilience in this cycle is that they are better able to take rate hikes and perhaps this means a bias toward continued tightening.
Chart 3 shows the trend in quarterly GDP growth.
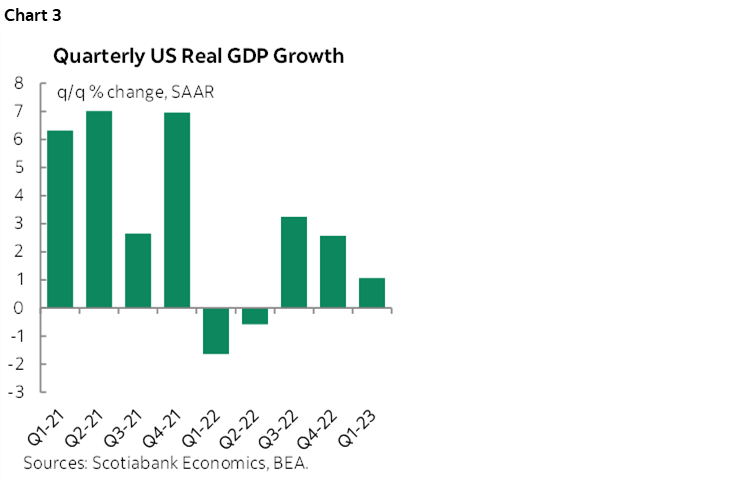
Chart 4 shows the weighted contributions by component to Q1 GDP growth. At the top of the list were the two consumption items.
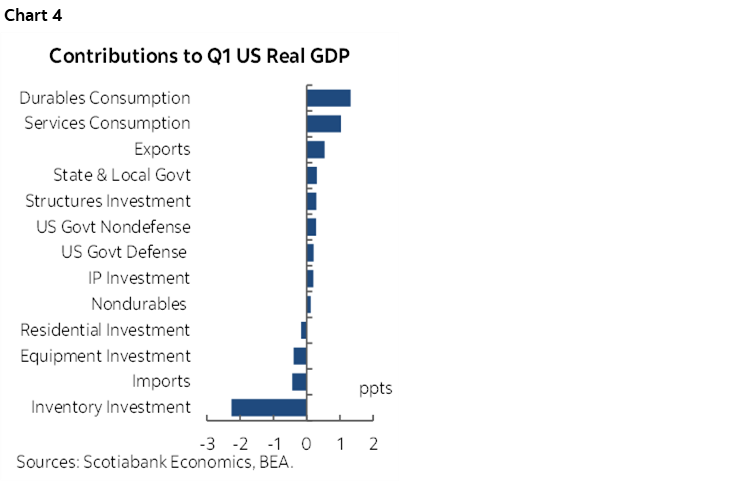
At the bottom of the list is that inventories dragged 2.3 ppts off of headline GDP for the biggest drag effect since 2021Q1. This partly reflects the sheer strength of consumer spending that depleted inventories.
Imports subtracted 0.4 ppts because they increased by 2.9% q/q SAAR in a partial reversal of the prior quarter’s decline. This may reflect efforts to restock inventories with imported content. A rise in imports is a drag on GDP growth given that the accounting treats it as a leakage effect out of the economy.
Exports added 0.5 ppts in weighted terms. Government spending added 0.8 ppts especially federal (0.5) but state/local gov'ts added 0.3.
Investment was a fairly neutral contributor and only subtracted -0.1 ppts with generous rounding. Nonresidential investment added 0.1, residential investment subtracted just 0.2.
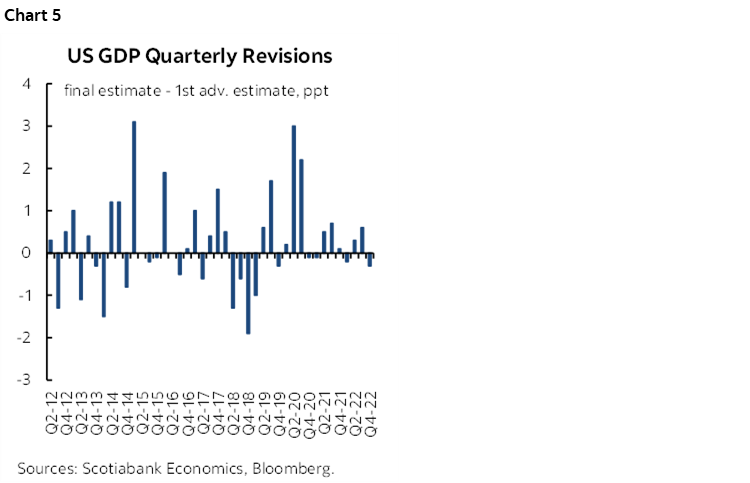
Chart 5 shows the history of revisions to US GDP growth to buttress the earlier point. Sometimes they are small and sometimes the revisions can be multiple percentage point swings.
Charts 6–14 depict the state of US inventories overall (chart 6) and by retail category across the remaining charts. I don’t see reason for alarm across the suite of measures particularly given the greater resilience in household finances during this cycle.
In separate releases, US weekly initial jobless claims dipped a touch to 230k from 246k and seems to be of decent quality with no states estimated (ie: hard submissions). That keeps them range bound at comfortably low levels consistent with ongoing job growth. Pending home sales fell by 5.2% m/m SA in March but was largely ignored by markets in relation to the focus upon inflation.
DISCLAIMER
This report has been prepared by Scotiabank Economics as a resource for the clients of Scotiabank. Opinions, estimates and projections contained herein are our own as of the date hereof and are subject to change without notice. The information and opinions contained herein have been compiled or arrived at from sources believed reliable but no representation or warranty, express or implied, is made as to their accuracy or completeness. Neither Scotiabank nor any of its officers, directors, partners, employees or affiliates accepts any liability whatsoever for any direct or consequential loss arising from any use of this report or its contents.
These reports are provided to you for informational purposes only. This report is not, and is not constructed as, an offer to sell or solicitation of any offer to buy any financial instrument, nor shall this report be construed as an opinion as to whether you should enter into any swap or trading strategy involving a swap or any other transaction. The information contained in this report is not intended to be, and does not constitute, a recommendation of a swap or trading strategy involving a swap within the meaning of U.S. Commodity Futures Trading Commission Regulation 23.434 and Appendix A thereto. This material is not intended to be individually tailored to your needs or characteristics and should not be viewed as a “call to action” or suggestion that you enter into a swap or trading strategy involving a swap or any other transaction. Scotiabank may engage in transactions in a manner inconsistent with the views discussed this report and may have positions, or be in the process of acquiring or disposing of positions, referred to in this report.
Scotiabank, its affiliates and any of their respective officers, directors and employees may from time to time take positions in currencies, act as managers, co-managers or underwriters of a public offering or act as principals or agents, deal in, own or act as market makers or advisors, brokers or commercial and/or investment bankers in relation to securities or related derivatives. As a result of these actions, Scotiabank may receive remuneration. All Scotiabank products and services are subject to the terms of applicable agreements and local regulations. Officers, directors and employees of Scotiabank and its affiliates may serve as directors of corporations.
Any securities discussed in this report may not be suitable for all investors. Scotiabank recommends that investors independently evaluate any issuer and security discussed in this report, and consult with any advisors they deem necessary prior to making any investment.
This report and all information, opinions and conclusions contained in it are protected by copyright. This information may not be reproduced without the prior express written consent of Scotiabank.
™ Trademark of The Bank of Nova Scotia. Used under license, where applicable.
Scotiabank, together with “Global Banking and Markets”, is a marketing name for the global corporate and investment banking and capital markets businesses of The Bank of Nova Scotia and certain of its affiliates in the countries where they operate, including; Scotiabank Europe plc; Scotiabank (Ireland) Designated Activity Company; Scotiabank Inverlat S.A., Institución de Banca Múltiple, Grupo Financiero Scotiabank Inverlat, Scotia Inverlat Casa de Bolsa, S.A. de C.V., Grupo Financiero Scotiabank Inverlat, Scotia Inverlat Derivados S.A. de C.V. – all members of the Scotiabank group and authorized users of the Scotiabank mark. The Bank of Nova Scotia is incorporated in Canada with limited liability and is authorised and regulated by the Office of the Superintendent of Financial Institutions Canada. The Bank of Nova Scotia is authorized by the UK Prudential Regulation Authority and is subject to regulation by the UK Financial Conduct Authority and limited regulation by the UK Prudential Regulation Authority. Details about the extent of The Bank of Nova Scotia's regulation by the UK Prudential Regulation Authority are available from us on request. Scotiabank Europe plc is authorized by the UK Prudential Regulation Authority and regulated by the UK Financial Conduct Authority and the UK Prudential Regulation Authority.
Scotiabank Inverlat, S.A., Scotia Inverlat Casa de Bolsa, S.A. de C.V, Grupo Financiero Scotiabank Inverlat, and Scotia Inverlat Derivados, S.A. de C.V., are each authorized and regulated by the Mexican financial authorities.
Not all products and services are offered in all jurisdictions. Services described are available in jurisdictions where permitted by law.