- Solid US job growth met expectations;
- Wage growth bounced back
- Job market details were generally strong…
- ...as the labour market is very close to a full recovery
- ISM-manufacturing slightly disappointed as prices soared
US nonfarm payrolls, m/m change, 000s // UR (%), March, SA:
Actual: 431 / 3.6
Scotia: 450 / 3.7
Consensus: 490 / 3.7
Prior: 750 / 3.8 (revised from 678 / 3.8)
Avg hourly wages, m/m // y/y, %, March, SA:
Actual: 0.4 / 5.6
Scotia: 0.5 / 5.6
Consensus: 0.4 / 5.5
Prior: 0.1 / 5.2 (revised from 0.0 / 5.1
The US job market is very close to registering a full recovery from the pandemic. This morning’s round of estimates for March furthered the narrative in that regard.
Markets shook it off because the figures were all in the ballpark of expectations especially given the statistical confidence bands around the estimates. The figures also won’t affect the Fed in any material way; they’re already fixed on the price stability over full employment part of the dual mandate and nothing here would affect that. If anything, the pick up in wages would bolster their confidence.
Here’s the rundown of what happened:
- 431k jobs were created in the nonfarm payrolls report. Compared to the consensus estimate of 431k that’s about as close to hitting the post in horseshoes as one could hope for and given the +/-110k 90% confidence band.
- Revisions were positive by adding 95k to the prior two months, mostly in February (+72k).
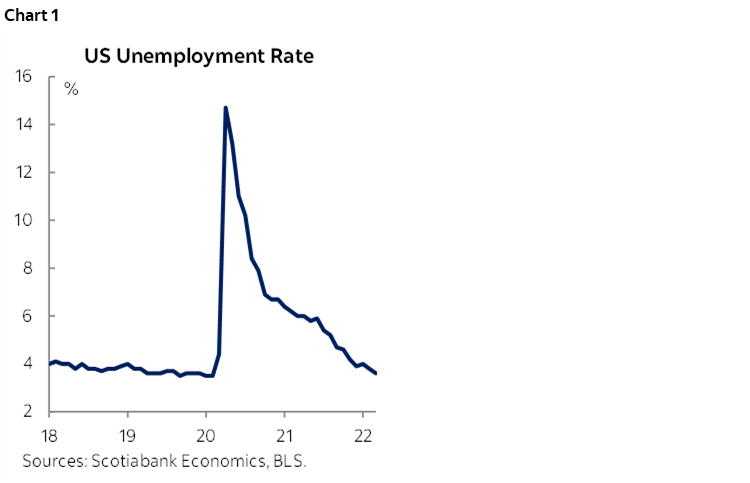
- The unemployment rate dipped a little more than expected to 3.6% from 3.8% (chart 1).
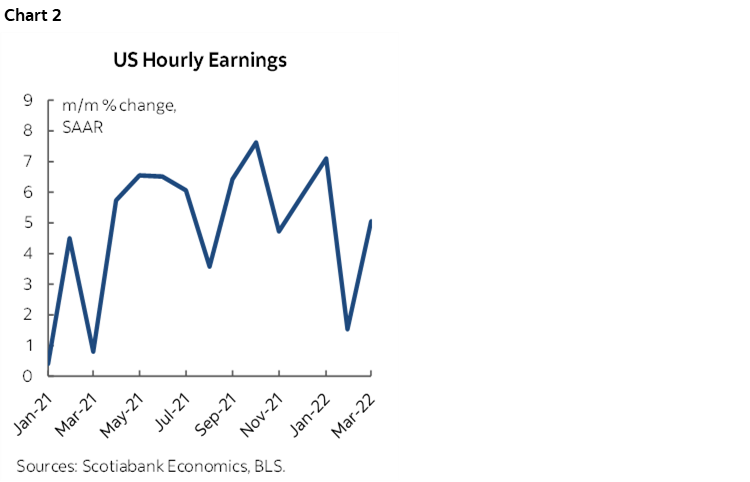
- wage growth was restored in line with consensus. The prior month’s flat wage reading of 0% m/m was revised up a tick and March landed at 0.4% which was on consensus. At an annualized pace month-over-month nominal wage growth returned to about 5% (chart 2). That’s roughly matching the 5.6% y/y pace. Since it’s below the pace of inflation, real wages are slightly falling. If as we suspect inflation will remain high but off present peaks as we go through the rest of the year while tight labour markets maintain pressure upon nominal wages then we could see real wage gains being restored. In the meantime, consumers are likely smoothing their purchasing power by backing into high liquidity and enormous gains in wealth including home equity.
- The breakdown by sector was marked by considerable breadth (chart 3). The goods sector added 60k and services added 366k. Government payroll jobs were flat (+5k).
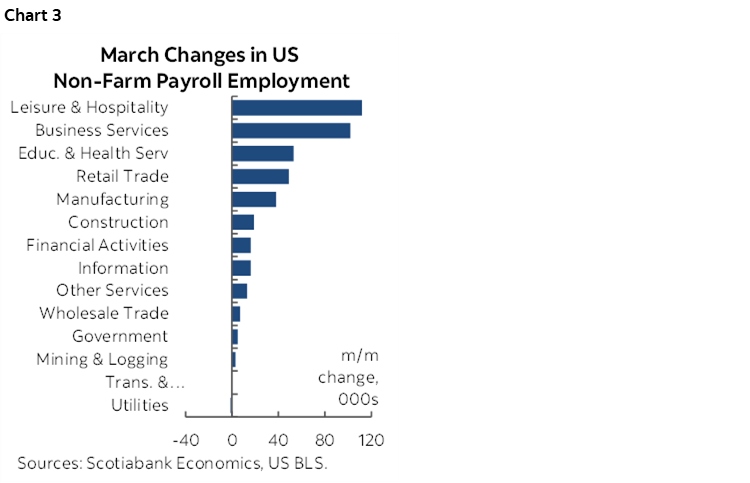
- Within services the gain was fairly dispersed. The beleaguered leisure/hospitality sector was up 112k, professional/business services gained 102k jobs and all outside of temp help, retail trade added 49k, health/social was up 33k, and there were small diversified gains elsewhere.
- one dent is that hours worked were flat in March after a gain of +0.9% in February and the dip in January. March was therefore about more bodies being hired against a cooler growth trend in hours worked. This may indicate that the scope for getting all of you hard working folks to work longer hours is reaching a pinnacle with the need shifting toward adding more bodies. That’s not terribly unusual as a recovery progresses.
The trend continues to favour bigger job gains in the household survey than the establishment (payroll) survey. The household survey registered 736k more jobs in March versus nonfarm’s 431k. This may be continuing to signal an ongoing greater lift to non-payroll and hence mostly small business employment. Then again, there is greater care needed around the household survey estimates given a much bigger confidence interval than the payrolls report
So let's take stock on the cumulative recovery since February 2020 across a suite of labour market readings:
- payrolls are just 1.58 million below February 2020 (chart 4). The composition by sector is shown in chart 5.
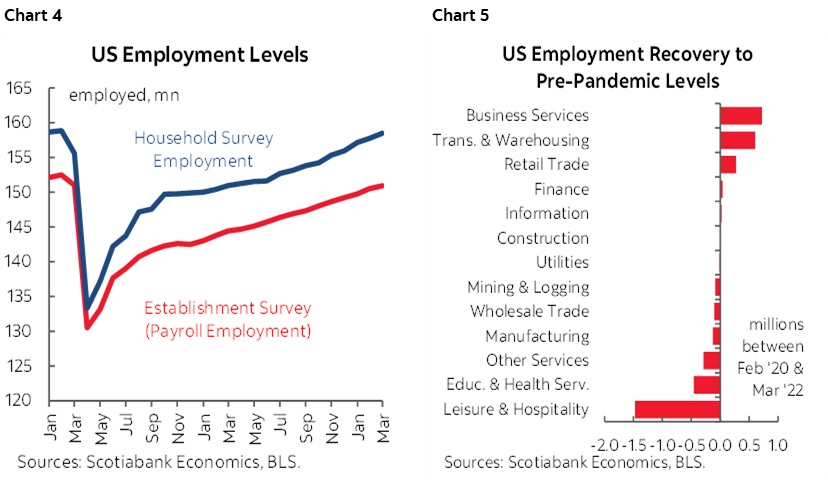
- the household survey is now only 1.51 million jobs below February 2020 (chart 4 again);
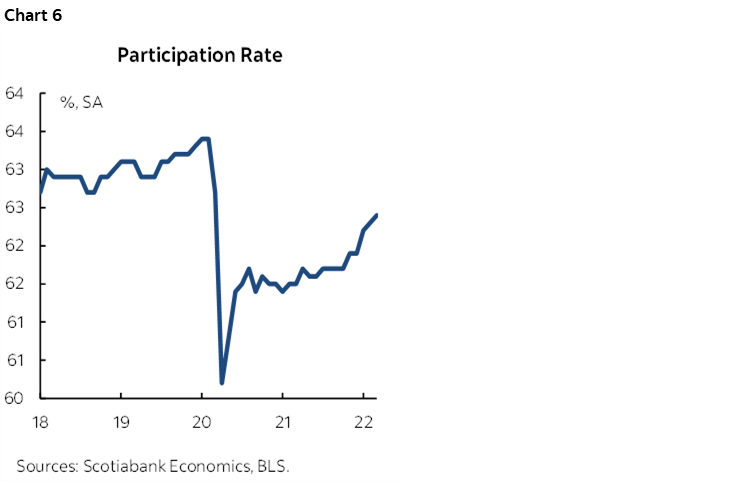
- the labour force participation rate is 62.4% and is therefore just 1.0 point lower (chart 6);
- the UR is just 0.1 above Feb 2020 at 3.6% (chart 7);
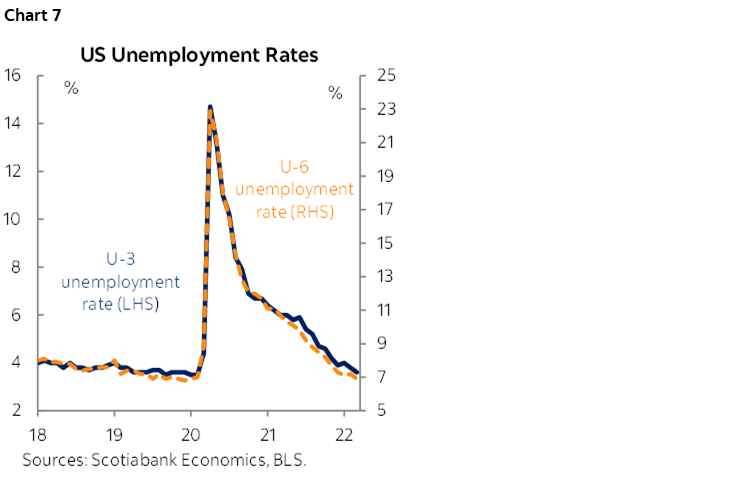
- the U6 unemployment rate measure is 0.1 below the 7% pre-pandemic level (captures discouraged workers, pt who would prefer ft etc). Chart 7 again.
- aggregate hours have fully recovered to Feb 2020.
The overall picture is one of a nearly a full recovery in US employment. That’s especially true upon consideration of the point on how the labour market may be tighter than indicated by such numbers with retirees and other withdrawals that might not ever fully return the participation rate to pre-pandemic levels, though that’s no longer impossible.
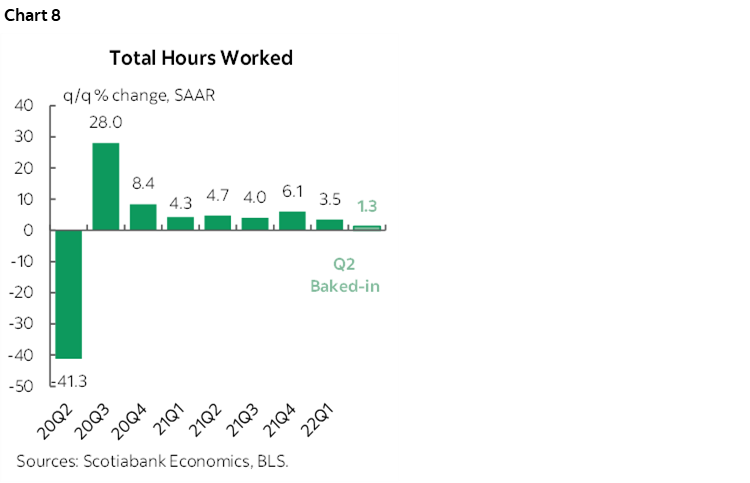
Hours worked were up by 3.5% q/q SAAR in Q1 (chart 8). That means that if we are on the mark with soft Q1 GDP growth after the strong ~7% annualized gain in Q4 then it's because productivity tanked in Q1. GDP is an identity expressed as hours times labour productivity. Productivity likely fell given activity based readings. That might swing the other way in Q2 as hours presently only have a gain of 1.3% q/q SAAR baked in, but we only have the Q1 avg and the way the quarter ended to work off of as obviously we don't have any Q2 data yet.
US MANUFACTURING PRICES SOAR
US ISM-mfrg, March, SA:
Actual: 57.1
Scotia: 57.0
Consensus: 59.0
Prior: 58.6
US ISM-manufacturing decelerated a touch in March by dropping 1.5 points below the prior month’s reading. That still signals impressive growth but at a slightly cooler pace. Chart 9. Details are shown in chart 10.
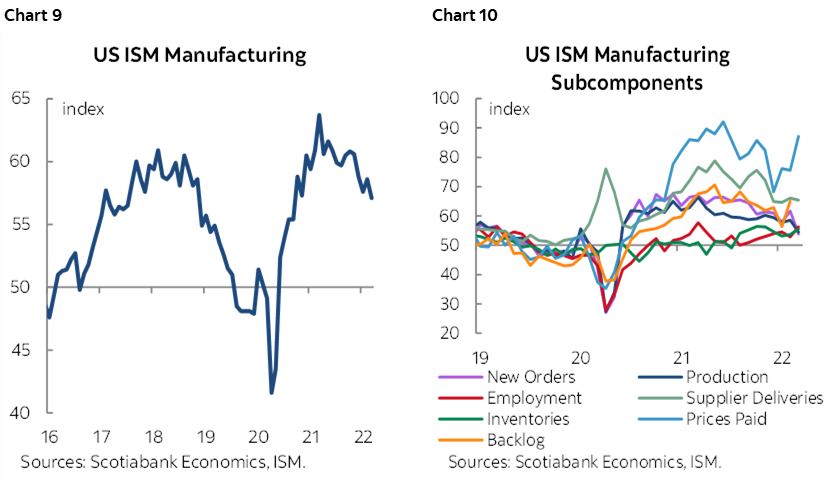
The sharp deceleration in the new orders book suggests further cooling ahead unless it’s a transitory hit. New orders fell nearly 8 points to 53.8 to signal moderate growth in the order book.
Prices paid jumped, but not by as much as I had feared. The prices subindex climbed 11.5 points to 87.1. That’s shy of the 92.1 peak set last June which had been the highest reading since July 1979. Given what we’ve observed happen to commodity prices, the rise in March’s ISM-prices paid subindex should probably not surprise many. Still, the magnitude of the market price movements help out the prospect of a new record high here. It’s possible we’ll see further pressure in coming months and quarters as higher market prices get passed through a greater portion of the basket.
DISCLAIMER
This report has been prepared by Scotiabank Economics as a resource for the clients of Scotiabank. Opinions, estimates and projections contained herein are our own as of the date hereof and are subject to change without notice. The information and opinions contained herein have been compiled or arrived at from sources believed reliable but no representation or warranty, express or implied, is made as to their accuracy or completeness. Neither Scotiabank nor any of its officers, directors, partners, employees or affiliates accepts any liability whatsoever for any direct or consequential loss arising from any use of this report or its contents.
These reports are provided to you for informational purposes only. This report is not, and is not constructed as, an offer to sell or solicitation of any offer to buy any financial instrument, nor shall this report be construed as an opinion as to whether you should enter into any swap or trading strategy involving a swap or any other transaction. The information contained in this report is not intended to be, and does not constitute, a recommendation of a swap or trading strategy involving a swap within the meaning of U.S. Commodity Futures Trading Commission Regulation 23.434 and Appendix A thereto. This material is not intended to be individually tailored to your needs or characteristics and should not be viewed as a “call to action” or suggestion that you enter into a swap or trading strategy involving a swap or any other transaction. Scotiabank may engage in transactions in a manner inconsistent with the views discussed this report and may have positions, or be in the process of acquiring or disposing of positions, referred to in this report.
Scotiabank, its affiliates and any of their respective officers, directors and employees may from time to time take positions in currencies, act as managers, co-managers or underwriters of a public offering or act as principals or agents, deal in, own or act as market makers or advisors, brokers or commercial and/or investment bankers in relation to securities or related derivatives. As a result of these actions, Scotiabank may receive remuneration. All Scotiabank products and services are subject to the terms of applicable agreements and local regulations. Officers, directors and employees of Scotiabank and its affiliates may serve as directors of corporations.
Any securities discussed in this report may not be suitable for all investors. Scotiabank recommends that investors independently evaluate any issuer and security discussed in this report, and consult with any advisors they deem necessary prior to making any investment.
This report and all information, opinions and conclusions contained in it are protected by copyright. This information may not be reproduced without the prior express written consent of Scotiabank.
™ Trademark of The Bank of Nova Scotia. Used under license, where applicable.
Scotiabank, together with “Global Banking and Markets”, is a marketing name for the global corporate and investment banking and capital markets businesses of The Bank of Nova Scotia and certain of its affiliates in the countries where they operate, including; Scotiabank Europe plc; Scotiabank (Ireland) Designated Activity Company; Scotiabank Inverlat S.A., Institución de Banca Múltiple, Grupo Financiero Scotiabank Inverlat, Scotia Inverlat Casa de Bolsa, S.A. de C.V., Grupo Financiero Scotiabank Inverlat, Scotia Inverlat Derivados S.A. de C.V. – all members of the Scotiabank group and authorized users of the Scotiabank mark. The Bank of Nova Scotia is incorporated in Canada with limited liability and is authorised and regulated by the Office of the Superintendent of Financial Institutions Canada. The Bank of Nova Scotia is authorized by the UK Prudential Regulation Authority and is subject to regulation by the UK Financial Conduct Authority and limited regulation by the UK Prudential Regulation Authority. Details about the extent of The Bank of Nova Scotia's regulation by the UK Prudential Regulation Authority are available from us on request. Scotiabank Europe plc is authorized by the UK Prudential Regulation Authority and regulated by the UK Financial Conduct Authority and the UK Prudential Regulation Authority.
Scotiabank Inverlat, S.A., Scotia Inverlat Casa de Bolsa, S.A. de C.V, Grupo Financiero Scotiabank Inverlat, and Scotia Inverlat Derivados, S.A. de C.V., are each authorized and regulated by the Mexican financial authorities.
Not all products and services are offered in all jurisdictions. Services described are available in jurisdictions where permitted by law.