

By Patrick Bryden, Ben de Wit, Zeeshan Nayani and Mitch Villeneuve
This Scotia Growth Institute report explores the Alberta Referendum results, how the province is integral to Building Canada initiatives, what its future path looks like, and the advantages it enjoys in major project execution capabilities.
Alberta has delivered a clear message to remain within Canada at a time of material geoeconomic and geopolitical uncertainty. The marketplace has responded with stability in the S&P/TSX Composite and the Canadian dollar. We expect the country to get on with enhancement of economic strength, which is needed most. We evaluate the path ahead, how Alberta is the single most important province in Canada’s current development inventory, and how its attributes and experiences favour major project execution. One-quarter of voters still supported separation but the existential-like risk for Canada has subsided. The results of additional referendum questions indicate provincial-federal challenges will persist but also align Canada’s growth agenda with an Alberta that is integral to its future.
• Economic and capital market uncertainties are now alleviated. In almost all scenarios, separation would have wrought adverse economic and capital market consequences; Alberta-commissioned downside analysis indicated a -16% permanent impairment to GDP and a 1%-2% increase in risk premiums on borrowing costs. Investors and businesses may now draw confidence that economic terms and risk premiums remain status quo and attractive. • Alberta is integral to Building Canada initiatives. The landmass and population of Alberta comprise 7% and 12% of Canada but the province is a positive outlier for capital deployment opportunities. For every dollar of Canada’s $1.1-trillion major project inventory, Alberta represents 21 cents of opportunity and if supporting investments in upstream oil and gas are included, this increases to 28 cents. Alberta is positioned as the single largest jurisdictional driver of Canada’s growth agenda. • Alberta has multiple attributes necessary to develop major projects. Alberta possesses qualities such as abundant natural resources, an attractive tax system, a well-educated and skilled workforce, low-cost business inputs, and major project execution experience that we believe help position potential investment returns as globally competitive. • Canada’s project inventory offers meaningful economic and strategic benefits. Our view is that it is imperative for the country to foster the conditions necessary to attract global capital and trade relationships to buttress both prosperity and security. The foundations of such pursuits are stability, opportunity, and competitiveness and Alberta has affirmed its part in Canada, which, notwithstanding the country’s typical federal-provincial back-and-forths, is expected to bode well for all. |
What will be our future in Canada? Nobody can say for sure. It is evident that due to events, it has fallen upon the shoulders of Albertans to play an important role in the outcome, and at times to lead the struggle for a true federation in Canada and a free, open and uniquely Canadian way of life. Are we strong enough? Are we determined enough? Have we the resolve to meet the challenge? I am confident we are.1
- Former Alberta Premier Peter Lougheed
A long history. Canada was formed in 1867 and Alberta joined confederation in 1905. When it signed on it was the poorest province, a position many have long forgotten but one that the late Premier Lougheed liked to remind people of, particularly as it found its way into greater levels of prosperity in the modern era. Premier Lougheed delivered the above words 45 years ago at the Palliser Hotel in Calgary and his questions (and confidence) have persisted. Balancing the rights, needs, and powers of the regions and the country has always been delicate, subject to great economic and political debate, and recent years have proved to be no exception.
A consequential referendum with important implications for the country. On October 19, the Government of Alberta put one question to its voting public to seek input on whether a binding referendum on separation from Canada should be held, as well as nine questions to gauge views on constitutional, immigration, and citizenship related issues – see the questions here. Ballots in Alberta are now hand counted and, given there are 10 questions, the unofficial count requires a 48-hour completion window from close of voting. As of the time of writing (13:00 MDT on October 21) there were 16,897,472 votes counted across 10 questions with 94.9% of Voting Areas/Locations reporting.
Question 10. The biggest question of the Alberta Referendum, if the province should consider a binding referendum on separation from Canada, was prioritized to be hand counted first. The result tabulated so far is 75.2% “No” (i.e., remain part of Canada and have no binding referendum) and 24.8% for the “Yes” side. The result compares favourably to polls in the lead up to the vote.
Questions 1 through 9. Seven of these ongoing ballot counts were a “yes”, while Question 6 for provincial selection of justices to King’s Bench and Appeal courts was a “no”, and Question 8 on opting out of federal programs (but keeping federal dollars) was a “no”, for an average approval of 52.7% across all nine votes.
Perspectives. With the result of Question 10 settled, our view is the broader existential-like risk for Canada has subsided. One might be forgiven if the words “for now” were to be added to the prior sentence, as regional concerns do not often tend to go quietly in the night and this was not Canada’s first-ever referendum on matters of sovereignty. A case in point is the outcome of Questions 1-9, which could yet play a role beyond Alberta in future provincial-federal dynamics. Clearly the voices of Questions 1-5, 7 and 9, plus those of nearly a quarter for Question 10 matter. Prime Minister Mark Carney has indicated he is open to constitutional amendments, though to what ultimate degree remains to be seen. Regardless, with the biggest uncertainty now resolved in Question 10, TSX futures and the CAD have treated the result as indicative of a business-as-usual situation – even though it is decidedly not, which this report will endeavour to illuminate in regard to the economic potential that Alberta offers Building Canada initiatives and the country’s renewed growth agenda.
High-stakes economics. Economic considerations are inherent to provincial-federal dynamics for Alberta but economic uncertainties over separation were of far greater concern. The Government of Alberta commissioned the School of Public Policy at the University of Calgary to independently complete The Economic and Fiscal Implications of Alberta Separation, which includes an overview report and four technical documents. The evaluation includes Smooth, Mid-Range, and Difficult Scenarios, for which the bookends are as follows in terms of assumptions that drive the analysis:
· Smooth Scenario: resource productivity is high with average pricing and trade costs.
· Difficult Scenario: average resource productivity, weak pricing, and Brexit-based trade costs
| Exhibit 1 – Economic and Capital Market Implications of Alberta Separation |
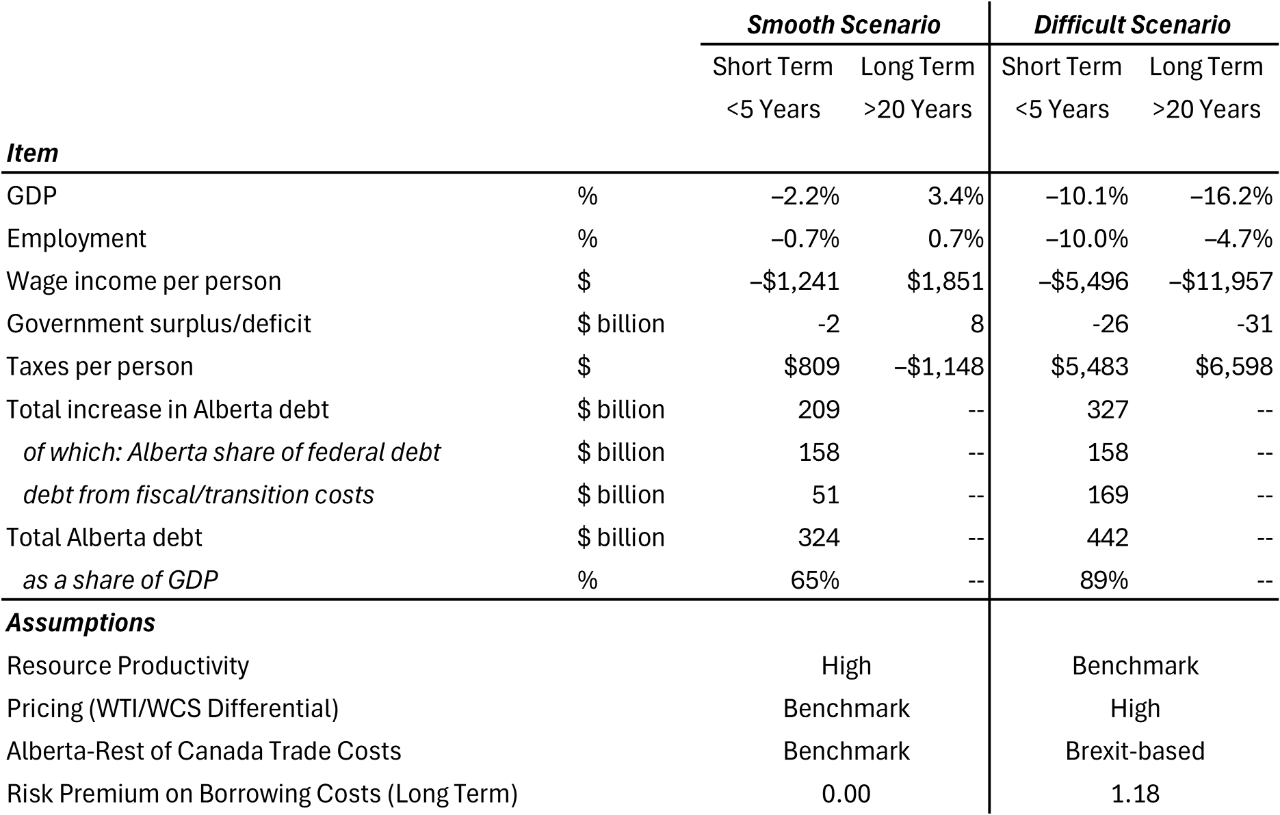
Note: Both scenarios are based on the analysis in the technical paper entitled The Economic Implications of Alberta Separation (Tables 23 and 24 and Section 8.3), and the technical paper The Fiscal Implications of Separation: Revenues and Fiscal Balance (Tables 3 and 5). Wage income is calculated using the percentages in the technical paper on economic impacts applied to data from Statistics Canada Table 11-10-0240-01. Wages and taxes are in 2026 dollars. GDP estimates are taken from the Alberta government’s First Quarter Fiscal Update. Smooth Scenario assumes only a temporary increase in the risk premium, greater resource productivity, no increase in trade costs, higher government efficiency and more scope for reducing duplication and federal debt allocated to Alberta based on past contributions. Difficult Scenario assumes a large and permanent increase in the risk premium; Alberta oil trading at a much greater discount to world prices; increases in trade costs comparable to Brexit; and lower government efficiency owing to higher fixed costs per capita, plus per capita division of the federal debt.
Source: Dade, Carlo, G. Kent Fellows, Robert Johnston, John Lester, Timothy Sargent, Anthony M. Sayers, Trevor Tombe, and Jennifer Winter. “Overview Report” in The Economic and Fiscal Implications of Alberta Separation, edited by Alem Cherinet, Martha Hall Findlay, Siu Ming Kwok, Myles Leslie, Antonio Quiñones and Timothy Sargent. Calgary, AB: School of Public Policy, University of Calgary, 2026; Scotia Growth Institute.
There were other studies advanced by separatist interests but, in our estimation, we believe the analyses advanced by the University of Calgary’s School of Public Policy were viewed as the authoritative economic and fiscal dataset by the marketplace. In the short term, defined as less than five years, the report notes “no reasonable expectation for economic improvements” in a separation case with an expectation range for real GDP of a “moderate recession” of -2.2% to a “much more devastating contraction” of -10.1%. In the long term, defined as greater than 20 years, a positive permanent impact of +3.4% to the economy would be theoretically possible but the report notes it is based on the “most optimistic outcome we can credibly produce when reviewing the existing literature and feeding reasonable shocks into our model” to arrive at the result. The other end of the range is a permanent -16.2% reduction to the economy versus the counterfactual case of an Alberta intact within Canada. The modelled outputs associated with these scenarios are featured in Exhibit 1 and provide ranges for employment, personal wages and taxes, and government finances that likely forced the bulk of Alberta’s voters to think long and hard about the basic economics of pocketbook issues.
High-stakes capital markets. In Exhibit 1, we have further included the underlying assumptions for resource productivity, pricing of crude oil, trade costs between Alberta and the Rest of Canada, and changes to the risk premium on borrowing costs. Per the School of Public Policy at the University of Calgary’s The Economic and Fiscal Implications of Alberta Separation – Technical Paper, Moody’s currently maintains a credit rating of Canada of Aaa, which is one of only 11 other countries with this highest rating (the U.S. is rated Aa1). The credit rating for Alberta is Aa2, as is British Columbia’s, while Ontario is rated Aa3. The credit rating for Alberta is lower than Canada’s, in part given greater volatility in its economy due to a relatively high reliance on its natural resources-based industries. The Smooth Scenario reflects no difference in risk premium for borrowing costs, arguably a generous assumption, while the Difficult Scenario represents an observed spread between Alberta and Canada of 0.46 and a further incremental risk premium of 0.72 percentage points due to separation, for a total of 1.18 percentage points. These figures that the School of Public Policy cites for separation premiums are based on a study from the U.K. National Institute of Economic and Social Research on Scotland’s independence, with the 0.72 the low end of its range and a high end of 1.65. The more conservative implied total borrowing cost premium could therefore also arguably be as high as 2.11 percentage points.2
Perspectives. When it comes to contemplation of what implications could have ensued from the risk of a binding vote on separation, and indeed if such a vote were to have proved affirmative, the pressure on market discount rates for investment in Alberta would have been expected to influence investor and corporate confidence in Alberta. This point was debated politically but from practical and probabilistic perspectives we believe economic uncertainties and adverse risks for provincial finances could have caused less than optimal capital market conditions for the province in the short and long term. It is not a leap for one to surmise that such a situation would have likely slowed, and not accelerated, development and economic progress for Alberta. In our view, the avoidance of a binding vote on separation helps broadly alleviate the concerns presented in the School of Public Policy’s economic implications for Alberta Separation. With economic stability affirmed, the capital markets should be similarly comforted. The caveat to these observations is that following the results of Questions 1 through 9, the outlook and positioning of future provincial-federal dynamics remains to be seen. On balance, we expect major projects to now see a green light for development, which is good news for the country amid geoeconomic and geopolitical uncertainties that are best met by economic strength rather than uncertainty.
The bigger-picture numbers for Canada’s inventory of projects approximate $1.1 trillion of opportunity over the next decade and are as follows:
· $637 billion in active projects over the next decade, per the NRCan Major Energy and Natural Resources Projects Inventory.
· Capital investment into natural resources does not provide 100% of capital spending in Canada but it likely gives a very good idea about the bulk of what is going on, excluding basic infrastructure and defence initiatives.
· Other infrastructure not accounted for in the NRCan data via ReNew Canada Top100 Infrastructure Projects 2026 report amount to $341 billion.
· Our estimate of the definable costs for the MPO’s Major Projects and Transformative Strategies is $342 billion. Some of these figures also overlap with the NRCan and ReNew datasets.
· With overlaps accounted for, projects in the NRCan, ReNew, and MPO datasets are $1,148 billion. We believe this figure could potentially accelerate with investment interest in Canada on the rise.
· We further note future defence expenditures incremental to the NRCan, ReNew, and MPO datasets currently on the books for Canada are in a stated range of $25 to $62 billion, and may rise further.
Exhibit 2 features the breakdown of projects by provinces and territories. These figures do not include capital expenditures for upstream oil sands and natural gas production expansions required to fill increased egress to tidewater through the Pacific Link oil pipeline project and LNG export facility buildouts.
Note that some projects are multijurisdictional, for which we have made cost assumptions as follows: Labrador Trough Corridor is split 50/50 between Québec and Newfoundland and Labrador, Pacific Link is split 55/45 between British Columbia and Alberta, and Alto High-Speed Rail is split 50/50 between Ontario and Québec. Major Projects and Transformative Strategies without a clear costing breakdown are also not shown.
Exhibit 2 – Canada’s Project Inventory: Jurisdictional Analysis
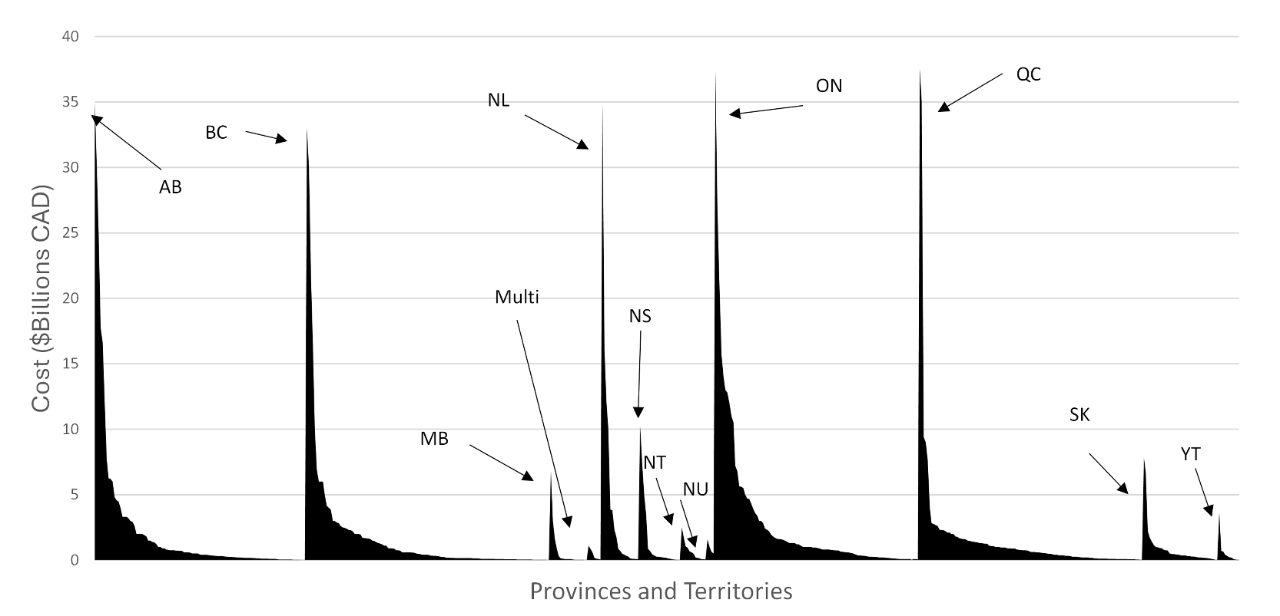
Exhibit 3 shows the breakdown of the $1.1 trillion of project inventory by each province, with Ontario being the largest at $301 billion followed by Alberta at $245 billion and British Columbia closely behind at $228 billion. Of the $1.1 trillion in inventory, 21% is within Alberta. These figures exclude the impact of upstream oil and gas that would be required to meet new egress capacity via construction of the Pacific Link Pipeline, as well as optimizations and expansions to the existing crude oil pipeline network, plus increased natural gas production, transportation and handling capacity necessary to supply feedstock for LNG buildouts. The Building Canada initiative has the ability to spur economic growth and development within Alberta that can disproportionately benefit the province and the country, particularly in times of geoeconomic and geopolitical uncertainties that have featured significant interplay with global energy markets.
Exhibit 3 – Major Projects by Province and Territory
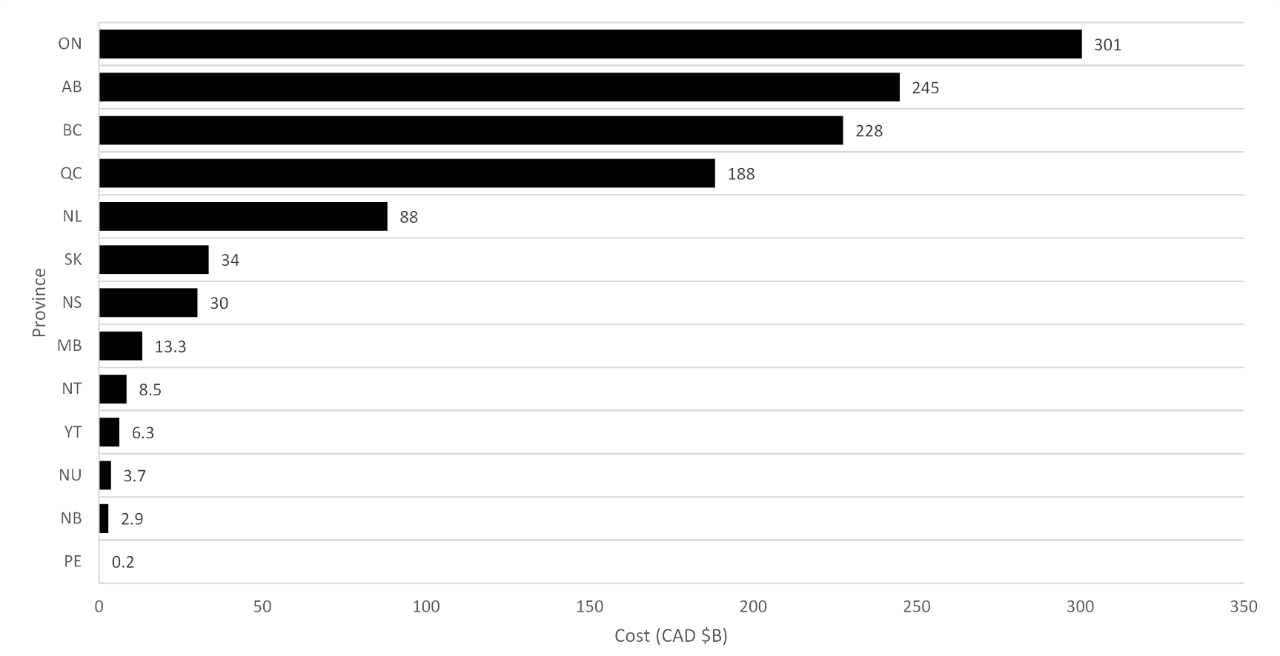
Exhibit 4 shows the same investment impacts as Exhibit 3 but with the added impact of upstream oil and gas development that would be required to fulfill the egress capacity that would be created upon the development and completion of pipelines and LNG expansion. These sums would likely be material, with development expenditures for the oil sands estimated to be approximately $100 billion or more and likely $50 billion-plus for natural gas split 60/40 between British Columbia and Alberta. Once completed, Alberta stands to become the biggest beneficiary of the Building Canada initiative with 28 cents of every dollar of investment being directed toward it. When considering the impact of the populace and land availability, Alberta has the ability to punch well above its weight as the province contains roughly 12% of the country’s population and 6.6% of the country’s land area. We note that alongside the $150 billion in additional upstream benefits, $30 billion in real GDP can be added every year over the next decade to the Canadian economy, not to mention the diversification and nationally strategic benefits achieved via additional egress that can serve an international customer base beyond its traditional export market in the U.S.
Exhibit 4 – Major Projects by Province and Territory Including Upstream Oil & Gas Investment
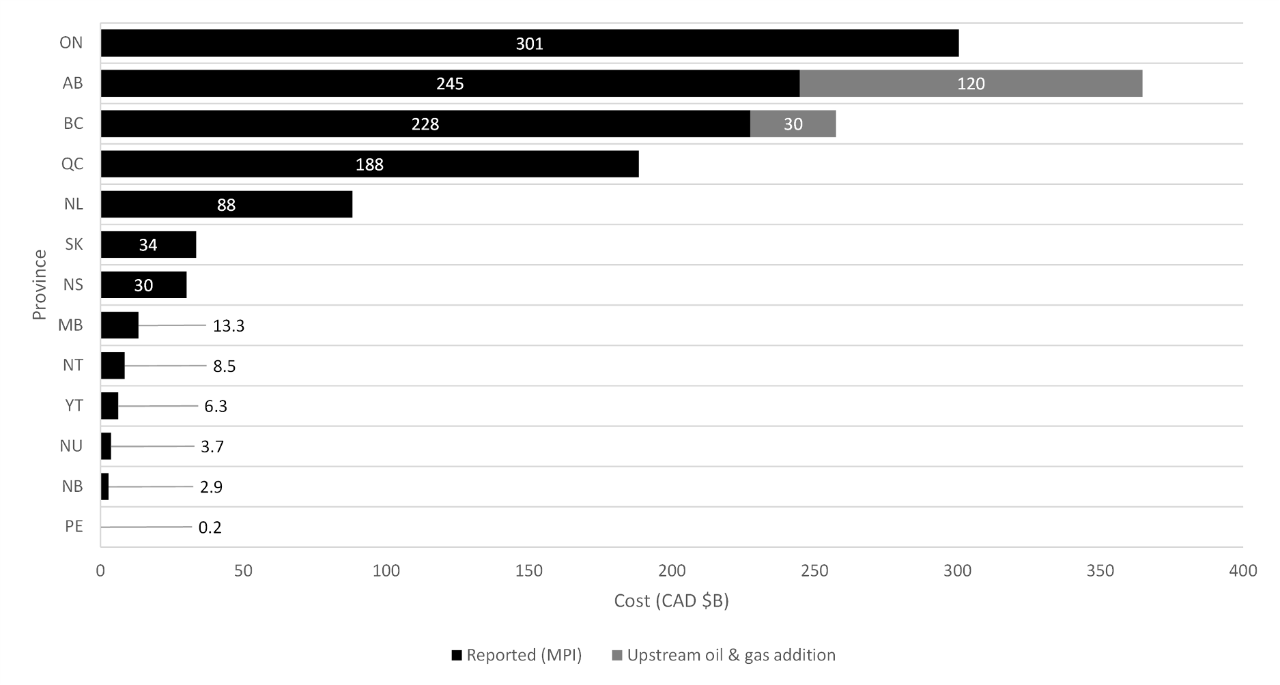
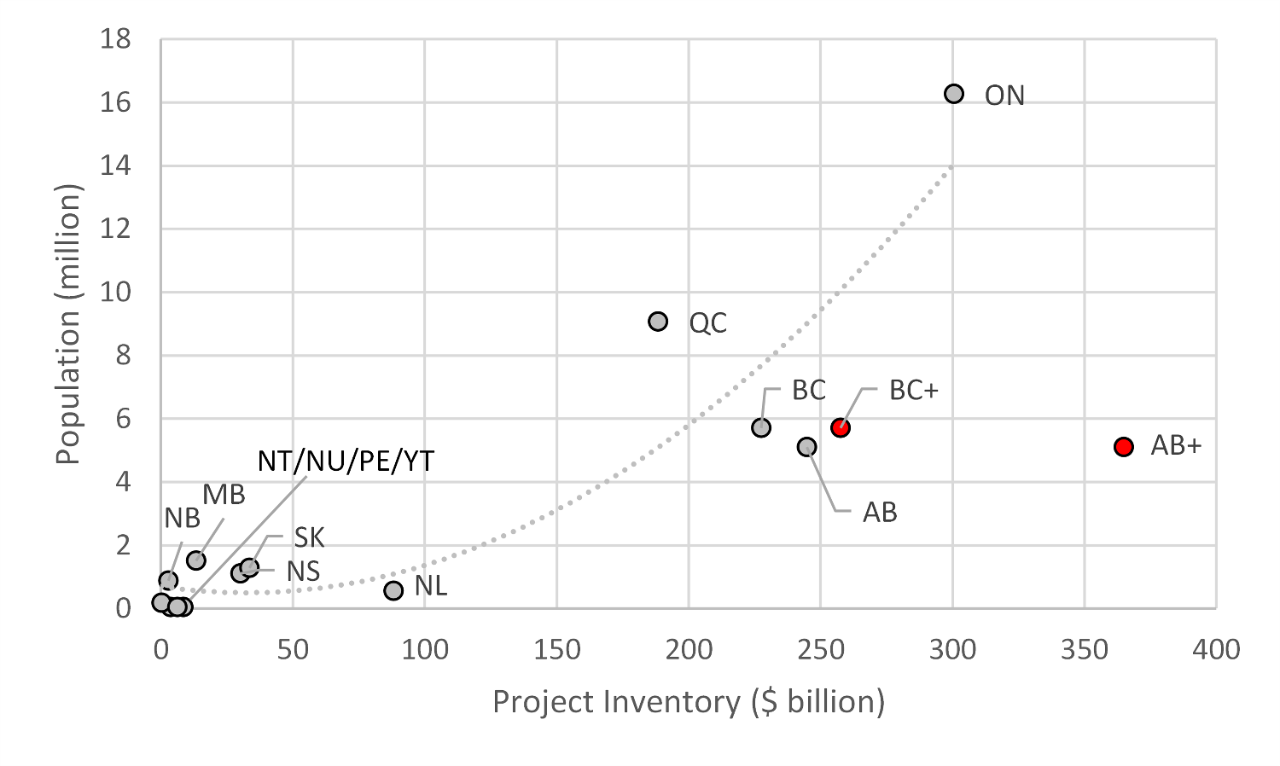
Exhibit 5 shows the relationship between project inventories and provincial populations, with the base dataset featured in the grey dots and trendline in the chart. The province of Alberta has approximately 12% of Canada's population (5.1 million) but 21.3% of the major-project inventory ($245 billion of $1,148 billion). This proportion puts it favourably to the right of the trendline where its population alone would place it, relative to the other provinces and territories. The upstream investment needed to support new Pacific Link pipeline capacity would widen the gap versus the trendline materially and, in our view, will ultimately count should the underlying pipeline and LNG projects proceed as expected. The comprehensive number of $120 billion in incremental investment into Alberta is represented by the red AB+ point and a further $30 billion for British Columbia is denoted by the red BC+ point. Such investment would raise Canada’s total to $1,298 billion. Alberta would then pass Ontario as the largest jurisdiction at $365 billion, or 28.1% of the national total, compared to Ontario’s 23.1%, and its inventory would reach $71,500 of development opportunity per person, nearly four times that of Ontario. British Columbia would rise to $258 billion (19.8%), or about $45,000 per person. Taken together, Western Canada would hold close to half of all planned major-project investment with one-third of the population. We note that these are planned capital costs, not actual expenditures, and the upstream addition is an anticipated scenario to highlight projected benefits the Pacific Link pipeline and other egress-creating projects would be expected to bring the Alberta economy.
Exhibit 5 – Major Projects Inventory Versus Population by Province and Territory
Note: red markers include upstream oil and gas investment.
Source: Natural Resources Canada, Open Government Licence – Canada; Major Projects Planned or Under Construction 2025 to 2035; © His Majesty the King in Right of Canada, as represented by the Minister of Energy and Natural Resources, 2026; Government of Canada, Major Projects Office (MPO) website and project information, accessed on 08/2026. Contains information licensed under the Open Government Licence – Canada; ReNew Canada's Top100 Projects; Statistics Canada. Table 17-10-0009-01 Population estimates, quarterly, https://www150.statcan.gc.ca/t1/tbl1/en/tv.action?pid=1710000901; Scotia Growth Institute.
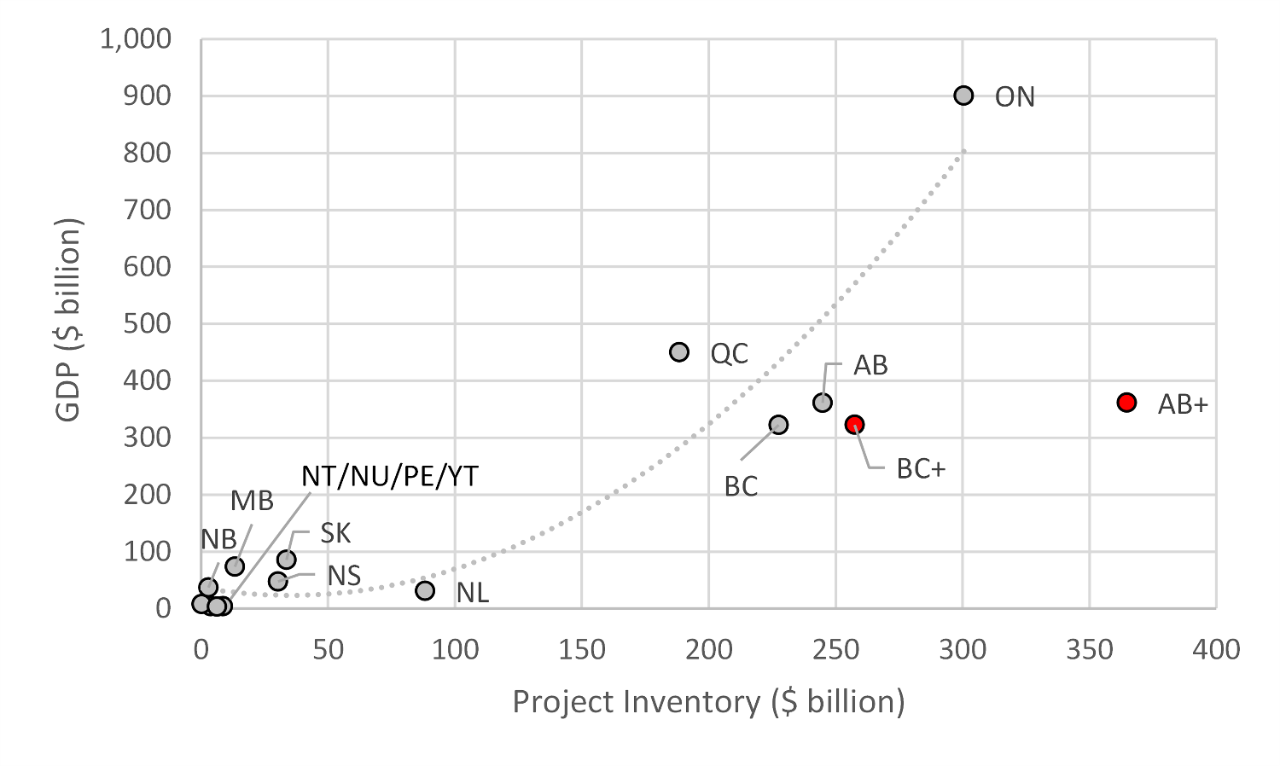
Instead of population, Exhibit 6 plots each jurisdiction’s major-project inventory against the size of its economy. Given that people drive economic activities, the datasets relate similarly. Ontario leads in GDP in Canada ($901 billion, about 39% of the national total), followed by Quebec ($450 billion, 19%), Alberta ($362 billion, 16%) and British Columbia ($323 billion, 14%). Alberta's project inventory of $245 billion is about 80% of Ontario’s $301 billion inventory, even though Alberta’s economy is only 40% the size, and with upstream considered for Alberta it becomes approximately 120% the size of Ontario’s project slate. Together, Alberta and British Columbia make up about 29% of Canada’s GDP and hold 41% of planned major-project investment. Adding the Pacific Link investment moves Alberta (AB+) to $365 billion. British Columbia (BC+) rises to $258 billion. Western Canada’s share of the national inventory would then approach half (48%), with 26% of the country’s population (AB+ share rises to 28% and BC+ share gains to 20%).
Exhibit 6 – Major Projects Inventory Versus GDP by Province and Territory
Note: red markers include upstream oil and gas investment.
Source: Natural Resources Canada, Open Government Licence – Canada; Major Projects Planned or Under Construction 2025 to 2035; © His Majesty the King in Right of Canada, as represented by the Minister of Energy and Natural Resources, 2026; Government of Canada, Major Projects Office (MPO) website and project information, accessed on 08/2026. Contains information licensed under the Open Government Licence – Canada; ReNew Canada's Top100 Projects; Statistics Canada. Table 36-10-0711-02 Gross domestic product (GDP) at basic prices, by industry, provinces and territories, growth rates (x 1,000,000), https://www150.statcan.gc.ca/t1/tbl1/en/tv.action?pid=3610071102; Scotia Growth Institute.
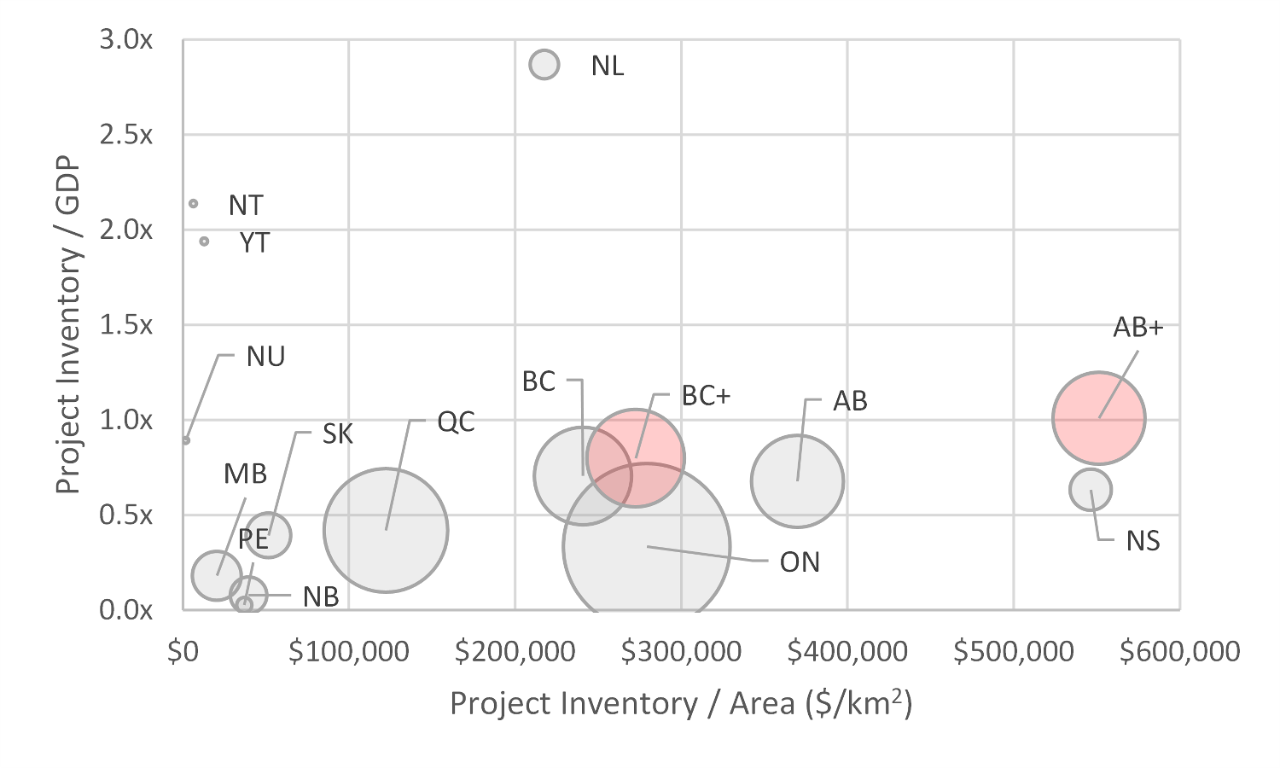
Exhibit 7 attempts to capture capital intensities, i.e.: how much planned investment there is for each resident and for each dollar of economic output. Alberta stands out among the large provinces at about $48,000 per person and 0.68 times GDP. Ontario has about $18,500 per person and 0.33 times, Quebec about $20,800 and 0.42 times, and British Columbia is about $39,800 and 0.71 times. With the Pacific Link addition, Alberta (AB+) moves to about $71,500 per person and more than a full year of GDP (1.01 times). British Columbia (BC+) moves from $39,800 to about $45,000 per person and from 0.71 to 0.80 times. Only Newfoundland and Labrador and the territories rank higher. Smaller populations and economies make these ratios large even when the dollar amounts are modest. Governments and the marketplace alike need to consider how much investment to permit and commit, where, and when, so as to ensure communities and all involved can accommodate and execute projects. While every province and territory gets capital investment allocated to it and regionally all are therefore involved, there are crucial considerations of workforce, real estate, taxation, skilled labour, education and the like, in order to properly manage large undertakings.
Exhibit 7 – Major Projects Inventory per Person Versus Major Project Inventory-to-GDP

Note: marker sizes represent population and red markers include upstream oil and gas investment.
Source: Natural Resources Canada, Open Government Licence – Canada; Major Projects Planned or Under Construction 2025 to 2035; © His Majesty the King in Right of Canada, as represented by the Minister of Energy and Natural Resources, 2026; Government of Canada, Major Projects Office (MPO) website and project information, accessed on 08/2026. Contains information licensed under the Open Government Licence – Canada; ReNew Canada's Top100 Projects; Statistics Canada. Table 17-10-0009-01 Population estimates, quarterly, https://www150.statcan.gc.ca/t1/tbl1/en/tv.action?pid=1710000901; Statistics Canada. Table 36-10-0711-02 Gross domestic product (GDP) at basic prices, by industry, provinces and territories, growth rates (x 1,000,000), https://www150.statcan.gc.ca/t1/tbl1/en/tv.action?pid=3610071102; Scotia Growth Institute.
Exhibit 8 compares planned investment with land area. Alberta already has about $370,000 per square kilometre, well above Ontario ($279,000), BC ($241,000) and Quebec ($122,000). Among the provinces, only Nova Scotia is higher ($546,000), largely due to smaller land area. With upstream oil and gas for Pacific Link and LNG considered, Alberta rises to about $551,000 per square kilometre, the highest in the country, which highlights the size of investment opportunities that are inherent to Alberta. The province has built the bulk of Canada’s single largest export business through oil and gas development, and it is the jurisdiction that has the most experience with major projects century-to-date. With renewed acceptance of the strategic importance of resource development to the country, we expect Alberta to help lead the way to enhanced growth prospects and prosperity for Canada.
Exhibit 8 – Major Projects Inventory per km2 Versus Major Projects Inventory-to-GDP
Note: marker sizes represent population and red markers include upstream oil and gas investment.
Source: Natural Resources Canada, Open Government Licence – Canada; Major Projects Planned or Under Construction 2025 to 2035; © His Majesty the King in Right of Canada, as represented by the Minister of Energy and Natural Resources, 2026; Government of Canada, Major Projects Office (MPO) website and project information, accessed on 08/2026. Contains information licensed under the Open Government Licence – Canada; ReNew Canada's Top100 Projects; Statistics Canada. Table 17-10-0009-01 Population estimates, quarterly, https://www150.statcan.gc.ca/t1/tbl1/en/tv.action?pid=1710000901; Statistics Canada. Table 36-10-0711-02 Gross domestic product (GDP) at basic prices, by industry, provinces and territories, growth rates (x 1,000,000), https://www150.statcan.gc.ca/t1/tbl1/en/tv.action?pid=3610071102; Scotia Growth Institute.
Economic momentum. Exhibit 9 shows how GDP, employment, and population drivers have performed well versus Canada in recent years. Alberta’s economy has become more diversified over the years and is more than just natural resource extraction and processing, but it is certainly anchored by these activities. Such a foundation can prove volatile through business and commodity cycles but, in the near future, the economy is projected to see further gains in GDP and employment.
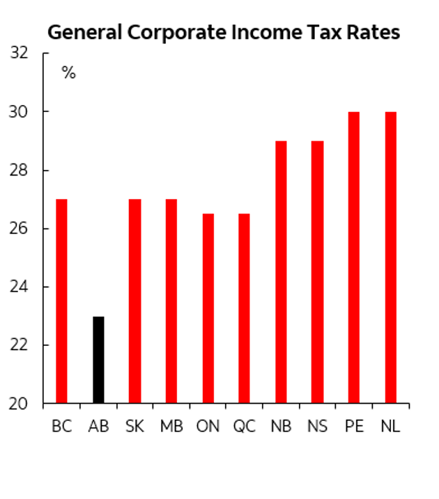
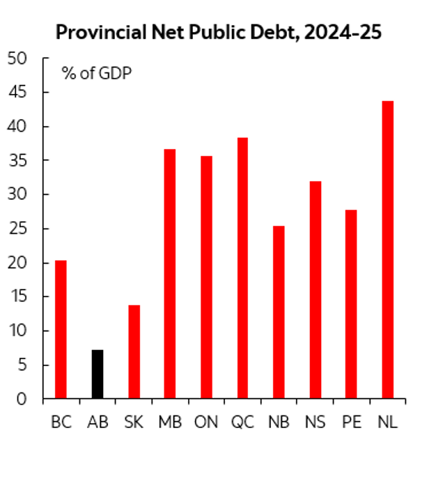
Tax competitiveness and debt conservatism. Exhibit 10 also shows Alberta has low net debt and one of the lowest corporate tax rates in the world at a combined total of 23% (15% federal and 8% provincial) and is among the lowest jurisdictions in North America with no provincial sales tax, no payroll tax, and no health-care premiums. The province has a lower combined federal-provincial corporate income tax rate compared to the federal-state rates applicable in 44 U.S. jurisdictions, only being exceeded by places like Texas, Nevada, and Washington, which implement combined 21% tax rates. Additionally, the tax advantages in Alberta are even more notable for small businesses, specifically those with active business income below $500,000, as Alberta offers a reduced rate of 11% for these qualifying businesses (9% federal and 2% provincial). Contrasting Alberta’s tax system with those utilized in other provinces shows that Albertan companies would collectively be burdened with additional taxes of at least $15 billion if they relocated to BC, to more than $30 billion if they relocated to either New Brunswick, Quebec, Nova Scotia, Newfoundland and Labrador, or Prince Edward Island.
Real estate tax and affordability attributes. Alberta is distinguished by competitive commercial property tax rates within Canada, with effective property tax rates in Calgary (2.2%) and Edmonton (2.9%) notably lower than other major Canadian cities. These municipalities offer both property tax exemptions and property tax relief incentives for up to 15 years, a policy aimed at attracting and retaining businesses. Residential real estate is also notably more affordable in Albertan cities, with single detached home prices in Calgary being around $680,000, while single detached home sales in Edmonton have shown recent average prices around $515,000.
Workforce capacity and capabilities. Alberta has the youngest workforce across the Canadian provinces with the highest proportion of workers under the age of 45, and 73.8% of Albertans have completed a post-secondary certificate, diploma, or degree program. Employment has started to outperform the national benchmark and population growth has also affirmed the attractiveness of the province’s economy, per Exhibit 9. The top four industries of employment in Alberta are Health Care (13% of workers), Retail Trade (11%), Construction (9%), and Professional, Scientific, and Technical Services (8%), out of the total active workforce of approximately 2.2 million, and the province has roughly 100,000 tech sector workers, with the City of Calgary having among the highest concentration of high-tech workers in Canada.
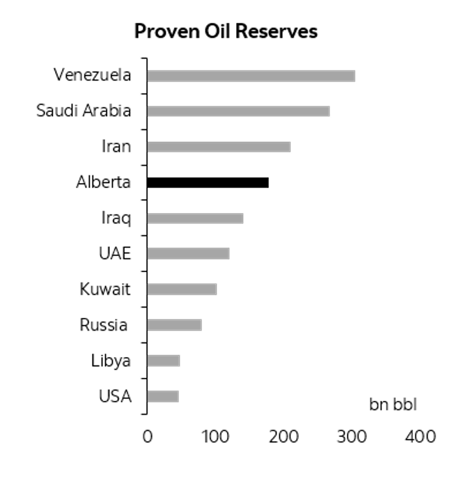
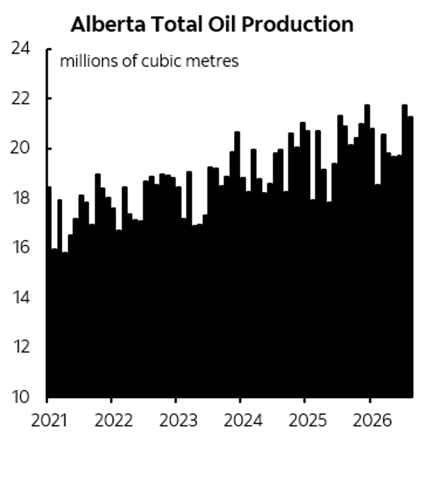
Resource abundance. Canada is the fourth-largest oil producer globally and Alberta is the bulk of that result. Canada's production rank is backed by Alberta’s oil sands, which contain the fourth largest accumulation of proved oil reserves in the world at 177 billion barrels, per Exhibit 11. The resource in place is much greater than this figure, in excess of 1.8 trillion barrels of bitumen. Canada is similarly well positioned in natural gas as the fifth-largest producer globally, of which Alberta is also the largest component for the country.
Exhibit 9 – GDP, Employment, and Population
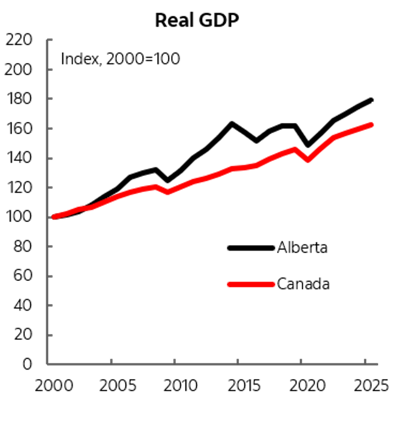
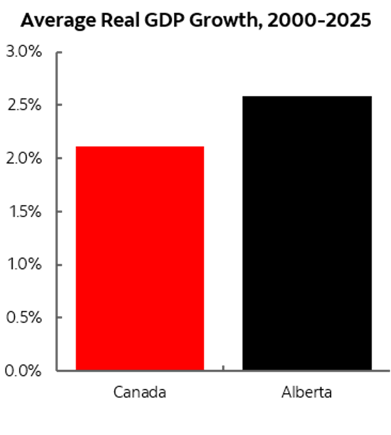
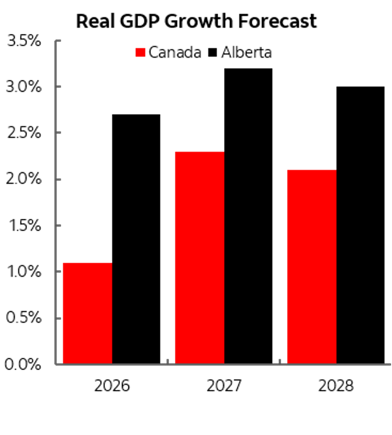
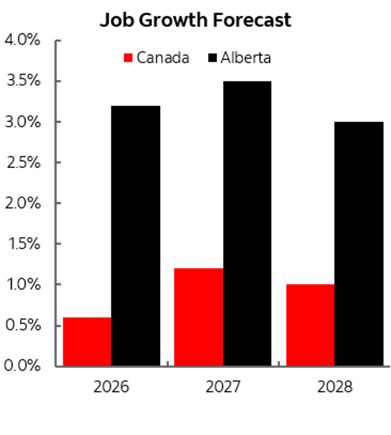
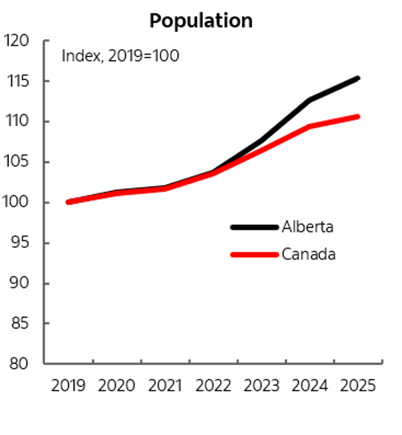
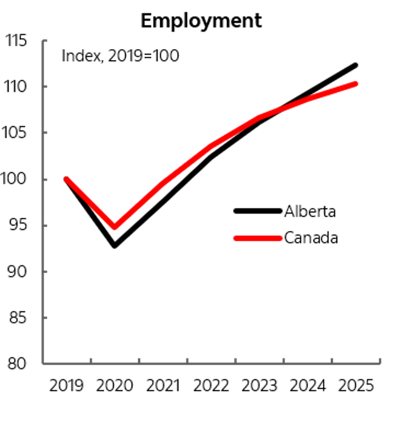
Exhibit 10 – Taxation and Fiscal Competitiveness
Note: Combined federal and provincial rates.
Source: Scotiabank Economics; KPMG.
Exhibit 11 – Natural Resource Considerations: Oil
[1] David G. Wood, The Lougheed Legacy (Key Porter Books, 1985), p. 243.
[2] Cited in The Economic and Fiscal Implications of Alberta Separation as: Armstrong A, Ebell M. Scotland’s currency options. Discussion paper series CFM-DP2013-2. Centre For Macroeconomics (CFM) London School of Economics and Political Science; 2013.
This communication is provided for informational and discussion purposes only and does not constitute investment advice, investment research, or a personal recommendation to invest in any financial instrument. It should not be relied upon as a recommendation to buy or sell any security or other financial instrument, nor as a guarantee, prediction, or forecast of future results or performance. An investment decision should not be made solely on the basis of the contents of this communication. This communication does not take into account the specific investment objectives, financial situation, tax circumstances, or particular needs of any recipient and should not be construed as a solicitation or offer to buy or sell any financial instrument. The information contained in this communication, including information relating to interest rates, market conditions, tax rules, forecasts, and other investment factors, is based on publicly available information and sources believed to be reliable as of the date of publication. However, such information has not been independently verified and The Bank of Nova Scotia makes no representation, warranty, or guarantee, express or implied, as to its accuracy, completeness, correctness, reliability, or timeliness. Information is subject to change without notice, and The Bank of Nova Scotia undertakes no obligation to update it. Past performance, simulated past performance, and forecasts are not reliable indicators of future results or future performance. Readers should consult their own professional advisors for investment, financial, legal, accounting, and tax advice tailored to their individual circumstances before making any investment or financial decisions. Please refer to our legal disclosures on our website.
This communication has not been prepared in accordance with legal requirements designed to promote the independence of investment research, it is not subject to any prohibition on dealing ahead of the dissemination of investment research and any views expressed in the communication may differ from the views offered in The Bank of Nova Scotia’s independent research reports prepared for investors including retail investors or from views that may be expressed by other financial institutions or market participants on the same subject matter as the Information. It is not independent investment research for the purposes of applicable regulatory rules in the United Kingdom or European Economic Area (“EEA”).
This communication should not be construed as an opinion as to whether you should enter into any swap or trading strategy involving a swap or any other transaction. The information contained in this report is not intended to be, and does not constitute, a recommendation of a swap or trading strategy involving a swap within the meaning of U.S. Commodity Futures Trading Commission Regulation 23.434 and Appendix A thereto. This material is not intended to be individually tailored to your needs or characteristics and should not be viewed as a “call to action” or suggestion that you enter into a swap or trading strategy involving a swap or any other transaction. Scotiabank may engage in transactions in a manner inconsistent with the views discussed this report and may have positions, or be in the process of acquiring or disposing of positions, referred to in this communication.
This communication and all the information, opinions, and conclusions contained in it are protected by copyright. This communication may not be reproduced in whole or in part, or referred to in any manner whatsoever, nor may the information, opinions, and conclusions contained in it be referred to without the prior, express consent of Scotiabank. All rights reserved.
Scotiabank specifically prohibits the redistribution of this communication in whole or in part without Scotiabank’s prior written permission, and Scotiabank accepts no liability whatsoever for the actions of third parties in this respect. Images may depict objects or elements that are protected by third-party copyright, trademarks, and other intellectual property rights.
Except as otherwise specified herein, this material, when distributed in the United Kingdom or European Union, is distributed by The Bank of Nova Scotia, London branch (“BNS London”), or Scotiabank (Ireland) Designated Activity Company to persons who are eligible counterparties or professional clients.
™ Trademark of The Bank of Nova Scotia, used under license (where applicable). Scotiabank is a marketing name for The Bank of Nova Scotia and certain of its affiliates in the countries where they operate. The Bank of Nova Scotia is authorized and regulated by the Office of the Superintendent of Financial Institutions Canada. The Bank of Nova Scotia is authorized by the UK Prudential Regulation Authority and is subject to regulation by the UK Financial Conduct Authority and limited regulation by the UK Prudential Regulation Authority. Details about the extent of The Bank of Nova Scotia’s regulation by the UK Prudential Regulation Authority are available from us on request. Scotiabank (Ireland) Designated Activity Company is authorized and regulated by the Central Bank of Ireland. The Bank of Nova Scotia and certain of its affiliates are subject to regulation by regulators in Singapore, Hong Kong, The People’s Republic of China, Japan, including by the Monetary Authority of Singapore. Scotiabank Inverlat, S.A., Institución de Banca Múltiple, Grupo Financiero Scotiabank Inverlat, Scotia Inverlat Casa de Bolsa, S.A. de C.V., Grupo Financiero Scotiabank Inverlat, and Scotia Inverlat Derivados, S.A. de C.V. are each authorized and regulated by the Mexican financial authorities. Scotiabank Chile, Scotia Corredora de Bolsa Chile Limitada, and Scotia Administradora General de Fondos Chile S.A. are each regulated by the Chilean Financial Markets Commission (Comisión para el Mercado Financiero). Scotiabank Peru S.A.A. is authorized and regulated by the Peruvian Superintendencia de Banca, Seguros y AFP, and Scotia Bolsa Sociedad Agente de Bolsa S.A. is authorized and regulated by the Superintendencia del Mercado de Valores. Scotiabank Brasil S.A. Banco Múltiplo and Scotiabank Brasil S.A. Corretora de Títulos e Valores Mobiliários are each authorized and regulated by Central Bank of Brazil and the Securities and Exchange Commission of Brazil.
© The Bank of Nova Scotia 2026
