SUMMARY
Following Ottawa’s increase to its 2021–23 immigration targets, we assess newcomers’ economic contributions in Quebec and Ontario.
By 2023, we expect the recent incremental increase to national immigration targets to add up to CAD 2.9 bn to Ontario real GDP and up to CAD 0.9 bn to Quebec real GDP. Those gains come even after accounting for the challenging job market conditions often experienced by newcomers in economic downturns. Immigration will add 0.8 ppts to growth per year over the medium-term in Ontario (chart 1) and 0.5 ppts in Quebec (chart 2).
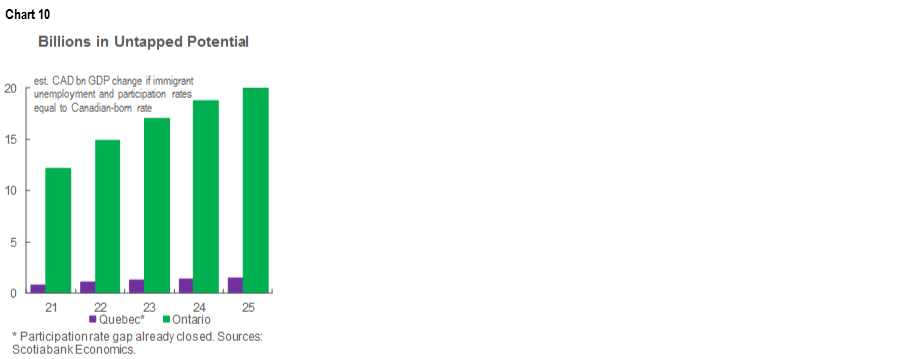
Closing immigrant unemployment and participation rate gaps presents scope for further economic growth: Ontario would see the greatest gains with CAD 12–20 bn more in real GDP in each of the next five years.
Historical immigration has unquestionably boosted economic activity. In Quebec, immigrants made up 17% of the working age population last year; in Ontario, the figure was 34%. Absent those individuals, we estimate that Ontario’s real GDP would be CAD 157 bn (20%) lower in 2021 alone. By the same token, Quebec output would be CAD 36 bn (9%) below our base case forecast level.
Our results highlight the importance of safely resuming immigration for the provinces’ recoveries from COVID-19, as a buffer against population aging, and as a driver of long-run economic prosperity.

NEWCOMERS PROVIDE HUMAN STIMULUS...
Immigration is a key element of economic growth in any economy, but that is especially true in Canada. Fundamentally, it impacts the size, age structure, and skill set of the pool of individuals available to work and produce goods and services. In Canada, governments have steadily ramped up their annual intake since 2015, and as a result, the country was the only G7 member whose headcount was accelerating before COVID-19. In Quebec, immigrants accounted for 17% of the working age population last year; in Ontario, they made up 34%. Newcomers to the Great White North are overwhelmingly economic immigrants admitted on the basis of their ability to contribute to the domestic economy.
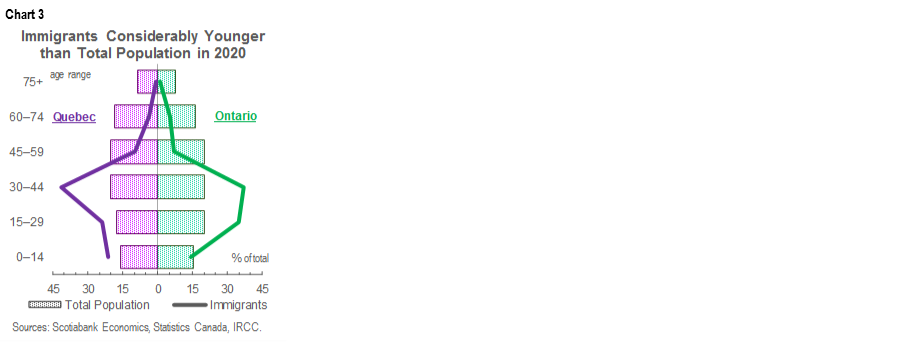
Immigration’s role in Central Canada’s pre-pandemic expansion is clear. Ontario admitted 154k newcomers in the year to Jan.1, 2020—the most in any 12 months since 1957—to drive the strongest population gains in nearly 20 years. Quebec scaled back permanent resident intake to fill labour shortages with temporary foreign workers, but pre-COVID-19 immigration to the province was high relative to recent history. In both jurisdictions, 2019 completed the strongest five-year gain in full-time jobs since the early 2000’s—immigrants accounted for 52% of those gains in Quebec and 68% in Ontario. Newcomers to Central Canada are also younger than the population as a whole (chart 3), which helps offset losses from an aging of the Canadian-born population.
Immigration’s economic benefits extend beyond its sheer numbers. As of 2017—the last year for which data were available—the newcomer workforce was more oriented towards high-wage sectors such as professional, scientific, and technical services than Canadian employees. Strong job creation in that and other high-wage sectors, uptake of government immigration programs that prioritize highly skilled workers, and outsized hiring of university-educated newcomers imply continuation of the trend since 2017. Alongside the human capital impact, immigrants’ participation in the Canadian housing market—reflected in their elevated homeownership rates relative to those who settle in other countries—has buoyed home sales and construction activity in Quebec and Ontario.
… WHICH HAS WANED DURING THE PANDEMIC
The last few years’ “human stimulus” has fallen off considerably amid pandemic-related border closures and travel restrictions. Despite a solid rebound since the peak first wave lockdown period, newcomer admissions were down 20–55% y/y towards the end of last year across Central Canada (chart 4). The declines to date are far worse than even the pessimistic headcount projections released by the provinces themselves in the summer and fall of last year. Quebec admitted just over 25k immigrant admissions in calendar year 2020 versus a baseline estimate of 48.5k for 2020–21. Ontario penciled in an annual mean of about 125k newcomers for the two years to July 1, 2021, but fewer than 85k settled in the province in 2020.

Following Ottawa’s decision to increase its 2021–23 immigration targets, we assess newcomers’ economic contribution to Canada’s two largest provinces. The new targets are: 401k in 2021 (previous: 341k), 411k in 2022 (351k), and 421k in 2023 (361k). Proponents of the move frame it as a much-needed form of economic stimulus that tackles long-run demographic challenges. Skeptics question its efficacy given: a) our position in the economic cycle, and b) newcomers’ historical labour market underperformance versus native-born Canadians. We analyze these impacts using our econometric model of the Quebec and Ontario economies*.
NEWCOMERS’ HISTORICAL LABOUR MARKET PERFORMANCE
Newcomers to Quebec and Ontario have traditionally not fared as well on the labour market as Canadian-born workers, but integration was clearly improving before the pandemic. Data dating back to 2006 reveal consistently higher unemployment rates for immigrants than for Canadian-born workers across Canada (chart 5); Quebec in particular is known for the largest such discrepancy of any province. Gaps also exist in employment rates and labour force participation, though Quebec stands out for its higher job market participation among immigrants (chart 6, p.3). Gaps tend to narrow as newcomers’ tenures increase, and have compressed over the past few years even as admissions reached new heights (chart 7, p.3).
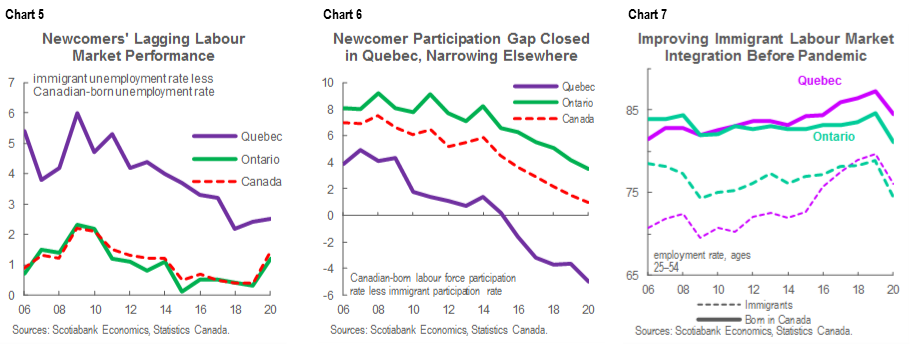
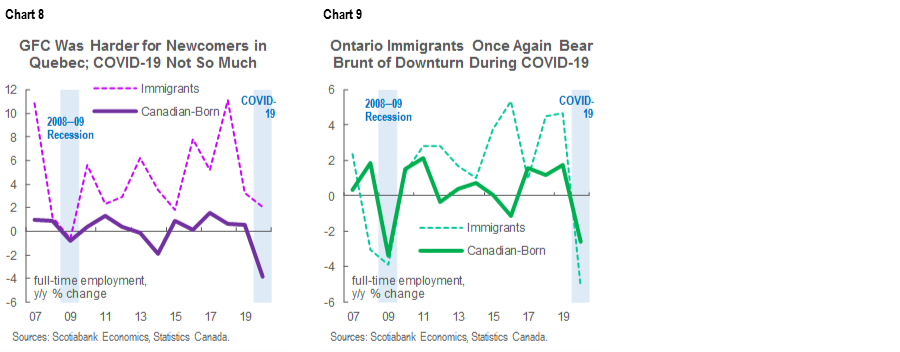
There is some evidence that newcomers face more challenging employment conditions than Canadian-born workers in economic downturns, though a closer look reveals mixed results. During the GFC, newcomer unemployment rates in Quebec rose by about 3 ppts versus just over 1 ppt for Canadian-born workers, but full-time hiring was relatively unscathed for immigrants in 2009 and in 2020 (chart 8). In Ontario, labour market outcomes deteriorated more for newcomers at the height of the GFC and amid the first wave of COVID-19 (chart 9, p.4). However, recoveries from the 2009 nadir proceeded at roughly the same pace for immigrants and Canadian-born workers in Quebec and Ontario. In both provinces, newcomer employment is more oriented towards full-time positions than the general population.
ASSESSING IMPACTS OF POTENTIAL IMMIGRATION SCENARIOS
We estimate three distinct economic impacts associated with immigration to Canada’s two largest provinces using our Quebec-Ontario econometric forecasting model. Model and assumption details are provided in the appendices.
To evaluate immigrants’ total contribution to each province’s economy, we simply set the immigrant population to zero on a forward basis and compared the results to those in our base case forecast. This is not a feasible outcome, but it nevertheless illustrates the important role played by immigrants in supporting the Quebec and Ontario economies.
To assess the target increase, we ran another set of shock-control exercises for each province, wherein baseline immigration levels were raised in line with national targets. To incorporate uncertainty with respect to lockdown-time target completion, we applied the same methodology to each province’s reference, low, and high immigration scenarios, illustrating the range of potential economic impacts.
We also estimate the potential benefits of improving immigrant labour market integration. To do so, we set Quebec and Ontario long-run equilibrium unemployment rates for immigrants equal to those of Canadian-born workers. For Ontario, we did the same with the participation rate, but kept Quebec’s long-run immigrant participation rate—which we noted is higher than for individuals born in Canada—in line with our base case.
IMMIGRANTS’ HEFTY ECONOMIC CONTRIBUTION IS CLEAR
Our modelling indicates that immigrants will contribute to a significant and rising share of output in Canada’s two largest provinces over the next five years. In Ontario, we estimate that absent the newcomer population, real GDP would be approximately CAD 157 bn (20%) lower this year, a figure that we expect to ramp up to CAD 252 bn (29%) by 2025; for Quebec, the corresponding figures are CAD 36 bn (9%) in 2021 and CAD 66 bn (15%) in 2025. Differences across the provinces reflect differences in the newcomer unemployment and participation rates and population shares. Importantly, we also estimate that beyond 2022—once the boost related to reopening from lockdowns is behind us—new immigrants will make up about half of the growth generated in both Ontario and Quebec (charts 1 & 2, p.1).
Relative to assumed pre-pandemic immigration levels, we estimate an incremental, but important increase to Quebec and Ontario growth from the target boost. We expect it to add CAD 2–2.9 bn to Ontario’s real GDP and CAD 0.6–0.9 bn in Quebec. Those impacts are incremental in the context of stop-and-start economies where we anticipate that annual growth in the -6% to +6% range, but over time would generate increases to productive capacity. They also come even after we account for the more challenging employment conditions often experienced by newcomers during recessions, leading to permanent growth rate boosts of about 0.1 ppts per year in both Quebec and Ontario.
Efforts to increase newcomer labour market integration over the medium-term offer scope for further economic growth. We estimate that if long-run participation and unemployment rates for the immigrant population were brought in line with the mean for Canadian-born workers, Ontario’s real GDP would rise by CAD 12–20 bn in each of the next five years. Closing the unemployment rate gap alone could lift Quebec’s output by CAD 0.8–1.4 bn per year over 2021–25 (chart 10).
FINAL THOUGHTS
Immigration is not a panacea, but we find clear and significant economic benefit to greater newcomer admissions in Canada’s two largest provinces—even after accounting for historical labour market gaps. Closing those gaps offers scope for even more growth.
A robust immigration policy framework is part and parcel of Canadian economic recovery objectives, but the business community has a role to play in closing historical immigrant labour market gaps as well. We have argued that this could include: resources to advance financial literacy among newcomers, assistance building personal and support networks, and workforce diversification initiatives.
To complement stepped-up newcomer intake and private-sector integration support, policy makers also must foster an environment conducive to business investment. Generally, this will ensure sufficient demand to make productive use of a pool of skilled new job market participants. More specific to Canada, weak investment and productivity have long held back economic potential, and firms will inevitably grapple with new uncertainty as they consider how to ramp up capacity when vaccinations proceed and the economy reopens. We have argued for a temporary 25%-matching grant for investment in machinery, equipment and intellectual property to spur capital outlays in the recovery phase of the pandemic. Such a measure would reinforce the stimulative medium-term injection of skilled workers.
The pandemic’s uneven sectoral impact should inform immigration policy as well. Certain industries such as tech, finance, and professional, scientific, & technical services have been most resilient to lockdowns and appear poised for the most medium-term growth and employment opportunities. Others—like accommodation and food services, arts and entertainment, and retail—which are most dependent on in-person gathering—continue to struggle under the weight of physical distancing restrictions. However, these sectors could see a burst of activity in the short-run as reopening occurs and pent-up demand is released. Others still—like health care and social assistance—are increasingly reporting labour shortages. Ultimately, immigration policy should seek to both mitigate and incorporate any industrial shifts prompted by COVID-19.
Canada’s immigration success story is by now well-documented; we contend that just as it supported the country’s pre-pandemic expansion, under the right conditions, it can help chart a course to recovery from COVID-19.
* The author thanks Scotiabank Economics’ René Lalonde for his invaluable guidance with the modelling work.
APPENDIX A: SCOTIABANK’S QUEBEC-ONTARIO FORECASTING MODEL
To better characterize and project levels of regional economic activity in Canada, we use a Quebec-Ontario forecasting model based on each province’s quarterly economic accounts data. Like the Scotiabank Global Macroeconomic Model, it is a general equilibrium model similar to semi-structural models used at the Bank of Canada.
Our Quebec-Ontario model decomposes GDP into domestic demand, exports, imports, and government consumption and investment. Each of those blocks features forward-looking behaviour, whereby agents seek to optimally set the level of the variables above subject to adjustment costs, which in turn depend on the expected trajectory of the economic drivers of those variables.
For example, drivers of provincial exports include (sign of the effect in parenthesis):
- Real Canada-US exchange rate (-, where negative reflects appreciation)
- Trade-weighted average of real GDP among major trading partners (+)
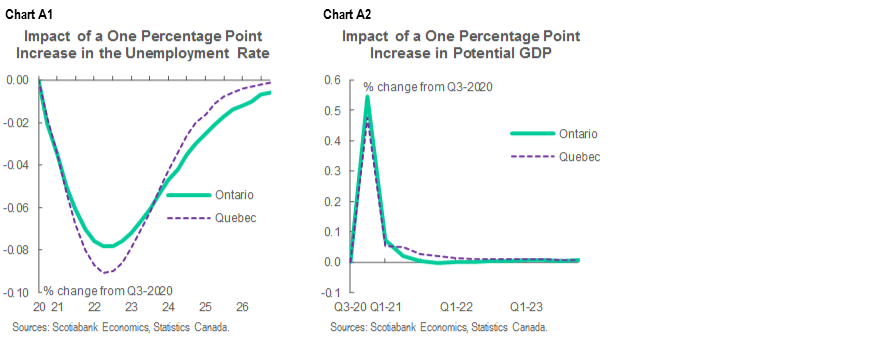
Our model estimates potential GDP via a standard Cobb-Douglas production function, in which long-run equilibrium output is a combination of productivity, capital, and labour. For this report, we expanded the population block that determines the labour component of potential GDP. Typically, that labour component is determined by applying equilibrium unemployment and participation rate assumptions to the estimated working-age population. In this paper, we calculated equilibrium unemployment and participation rates for both immigrants and non-immigrants. The sum of the immigrant and non-immigrant labour pools determines the economy-wide labour component.
Charts A1 and A2 illustrate our model’s estimated response of Quebec and Ontario real GDP to changes in a few select variables.
APPENDIX B: KEY MODELLING ASSUMPTIONS
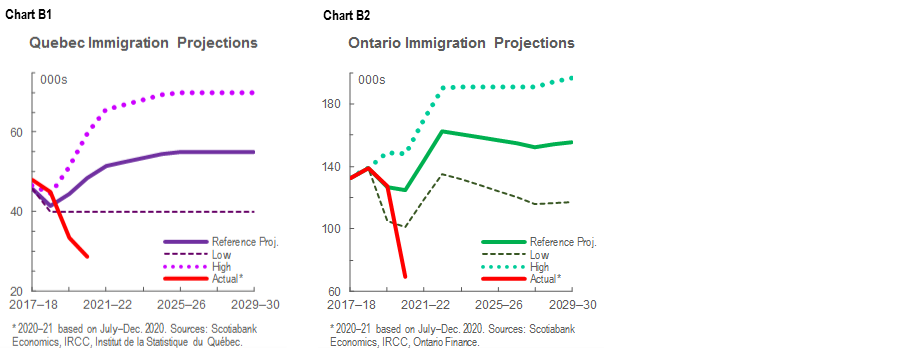
National-level target increases notwithstanding, there remains considerable uncertainty about provincial immigration’s trajectory given the ongoing second pandemic wave and imposition of new containment measures. We use Quebec’s and Ontario’s reference immigration projections as our baseline forecast, with the low and high scenarios employed to estimate the range of potential economic impacts under different possible newcomer intake scenarios. The drop in immigration witnessed during COVID-19 puts both provinces below their more pessimistic projections (charts B1 & B2). However, a stout bounce-back could well materialize in Q2-2021 should restrictions ease, and we felt it more defensible to use existing government projections than to speculate on national target completion rates.
To determine the impact of the national immigration target increase, we completed a shock-minus-control exercise in which we raised the reference, low-, and high-immigration scenarios by 17%—the factor by which Ottawa raised its 2021–23 admissions goals. Because the age structure of immigrants is assumed to be much younger than the current populations of both provinces, each immigrant adds to the province’s level of potential GDP, and the most significant gains came in the high-immigration scenarios.
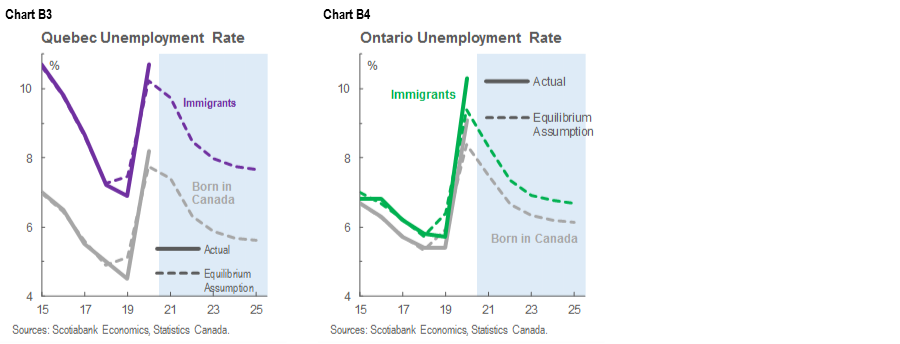
To capture differences between newcomer and Canadian-born job market outcomes, we assumed higher long-run equilibrium unemployment rates (charts B3 & B4) for the two groups. In Ontario, we also assumed lower long-run labour force participation, consistent with the data. This is meant to incorporate historical patterns into our baseline projection and address questions about Canada’s ability to successfully settle skilled workers during the pandemic. We hold that these assumptions may well prove pessimistic. If newcomer unemployment rates were brought closer to those of Canadian-born workers—as we assessed in our estimate of the impact of increased integration—there would be significant additional economic benefits.
Differences in the government projections and the labour market assumptions underlie differences in immigration’s estimated impacts in Quebec and Ontario. For instance, Quebec’s relatively high immigrant unemployment rate contributes to a more modest economic boost than in Ontario. Meanwhile, the easing newcomer admissions penciled in for 2023–28 in Ontario contribute to the boost to the province’s growth rate moderating somewhat over that period.
DISCLAIMER
This report has been prepared by Scotiabank Economics as a resource for the clients of Scotiabank. Opinions, estimates and projections contained herein are our own as of the date hereof and are subject to change without notice. The information and opinions contained herein have been compiled or arrived at from sources believed reliable but no representation or warranty, express or implied, is made as to their accuracy or completeness. Neither Scotiabank nor any of its officers, directors, partners, employees or affiliates accepts any liability whatsoever for any direct or consequential loss arising from any use of this report or its contents.
These reports are provided to you for informational purposes only. This report is not, and is not constructed as, an offer to sell or solicitation of any offer to buy any financial instrument, nor shall this report be construed as an opinion as to whether you should enter into any swap or trading strategy involving a swap or any other transaction. The information contained in this report is not intended to be, and does not constitute, a recommendation of a swap or trading strategy involving a swap within the meaning of U.S. Commodity Futures Trading Commission Regulation 23.434 and Appendix A thereto. This material is not intended to be individually tailored to your needs or characteristics and should not be viewed as a “call to action” or suggestion that you enter into a swap or trading strategy involving a swap or any other transaction. Scotiabank may engage in transactions in a manner inconsistent with the views discussed this report and may have positions, or be in the process of acquiring or disposing of positions, referred to in this report.
Scotiabank, its affiliates and any of their respective officers, directors and employees may from time to time take positions in currencies, act as managers, co-managers or underwriters of a public offering or act as principals or agents, deal in, own or act as market makers or advisors, brokers or commercial and/or investment bankers in relation to securities or related derivatives. As a result of these actions, Scotiabank may receive remuneration. All Scotiabank products and services are subject to the terms of applicable agreements and local regulations. Officers, directors and employees of Scotiabank and its affiliates may serve as directors of corporations.
Any securities discussed in this report may not be suitable for all investors. Scotiabank recommends that investors independently evaluate any issuer and security discussed in this report, and consult with any advisors they deem necessary prior to making any investment.
This report and all information, opinions and conclusions contained in it are protected by copyright. This information may not be reproduced without the prior express written consent of Scotiabank.
™ Trademark of The Bank of Nova Scotia. Used under license, where applicable.
Scotiabank, together with “Global Banking and Markets”, is a marketing name for the global corporate and investment banking and capital markets businesses of The Bank of Nova Scotia and certain of its affiliates in the countries where they operate, including; Scotiabank Europe plc; Scotiabank (Ireland) Designated Activity Company; Scotiabank Inverlat S.A., Institución de Banca Múltiple, Grupo Financiero Scotiabank Inverlat, Scotia Inverlat Casa de Bolsa, S.A. de C.V., Grupo Financiero Scotiabank Inverlat, Scotia Inverlat Derivados S.A. de C.V. – all members of the Scotiabank group and authorized users of the Scotiabank mark. The Bank of Nova Scotia is incorporated in Canada with limited liability and is authorised and regulated by the Office of the Superintendent of Financial Institutions Canada. The Bank of Nova Scotia is authorized by the UK Prudential Regulation Authority and is subject to regulation by the UK Financial Conduct Authority and limited regulation by the UK Prudential Regulation Authority. Details about the extent of The Bank of Nova Scotia's regulation by the UK Prudential Regulation Authority are available from us on request. Scotiabank Europe plc is authorized by the UK Prudential Regulation Authority and regulated by the UK Financial Conduct Authority and the UK Prudential Regulation Authority.
Scotiabank Inverlat, S.A., Scotia Inverlat Casa de Bolsa, S.A. de C.V, Grupo Financiero Scotiabank Inverlat, and Scotia Inverlat Derivados, S.A. de C.V., are each authorized and regulated by the Mexican financial authorities.
Not all products and services are offered in all jurisdictions. Services described are available in jurisdictions where permitted by law.