HIGHLIGHTS
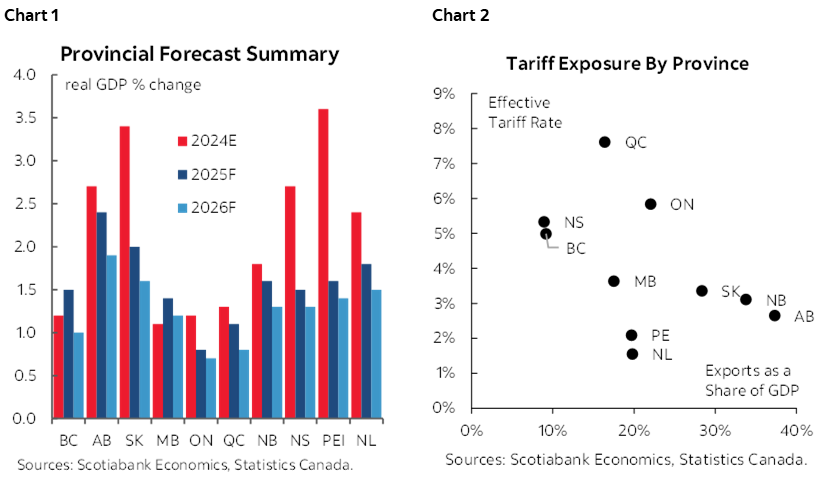
Nearly all Canadian provinces are poised for slowdowns in 2025 (chart 1). While the Canadian economy started the year with solid momentum, growth is expected to decelerate over the course of the year in the wake of the U.S. trade war and changes to Canadian immigration policy. Rising unemployment and lower population growth will weigh on consumption growth, and housing market activity has slowed as households delay major purchases. Exports are likely to decline due to the tariffs and spillovers from slower U.S. growth. We expect growth in central Canada to underperform the national average, given these provinces’ higher exposure to trade risks (chart 2). While we continue to think a recession will be avoided, there is a high degree of uncertainty as to how the tariffs will ultimately impact the economy—in addition to the possibility of new tariffs. Policy measures from the federal and provincial governments could provide a boost to economic activity, especially over the medium-term. That said, the tariffs and impact of elevated uncertainty are likely to weigh on growth in all regions of the country in the near-term, and compound the effects of sharply reduced population growth.
HOUSEHOLD CONSUMPTION SOFTENING
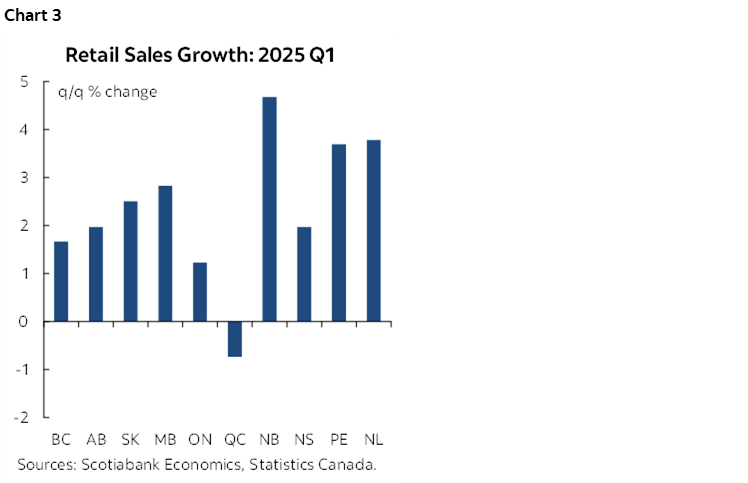
Household spending growth is likely to slow. Household consumption started the year with strong momentum, aided by 225 basis points of interest rate cuts by the Bank of Canada between June 2024 and March 2025. Despite the tariffs and uncertainty that emerged early this year, retail sales in Q1 were solid again in aggregate, though this was to some extent driven by vehicle sales being pulled forward to March to avoid tariffs coming into effect in April, and indicated weakness in the most tariff-exposed economies of Ontario and Quebec (chart 3). April and May data indicate that vehicle sales are slowing in Q2 and we expect this to continue throughout the year. In addition, drag from mortgage resets at higher interest rates is likely to continue, as we expect the Bank of Canada to hold off on further rate cuts until next year.
Softening labour market conditions point to weak consumption growth. The economy has been running below potential since mid-2023, and employment gains have consistently lagged behind the rapid expansion of the labour force, leading to rising unemployment rates nationwide. The tariff war has weakened the labour market further, with five provinces having fewer people working in May compared to February (chart 4). Ontario shed roughly 30,000 jobs in both March and April, and employment in PEI is down more than 2% over the last three months. However, employment in some provinces has been more resilient, with some even seeing robust jobs gains since the beginning of the tariff war, including Newfoundland & Labrador and Saskatchewan. We expect weakness in the labour market to continue, though job growth could start to outstrip population growth due to the slowdown in immigration, leading unemployment rates to fall in 2026.

INVESTMENT CONTRIBUTING POSITIVELY TO GROWTH
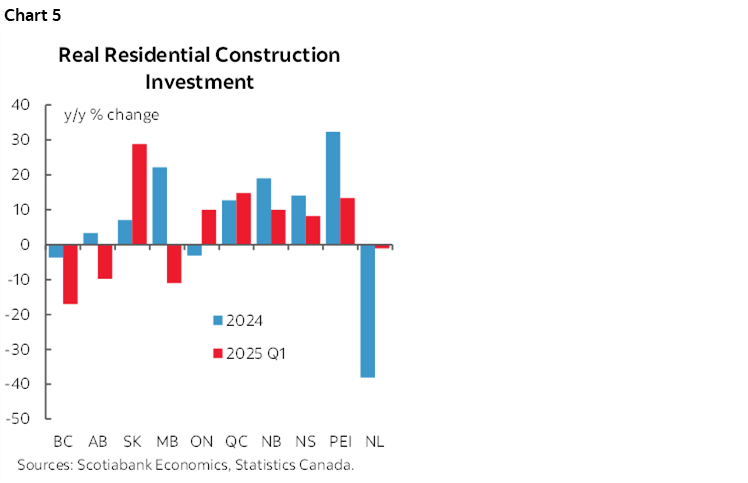
The housing market has softened. Sales of existing homes slowed after the onset of the trade war in some provinces—especially the most expensive markets of B.C. and Ontario. However, housing market activity in the provinces east of Ontario has been remarkably resilient. New housing starts in B.C. and Ontario continue to trend lower, but residential construction contributed positively to growth in Q1 in most provinces, especially Saskatchewan (chart 5). Abating economic uncertainty would release pent-up demand, especially in Ontario and B.C., where current sales rates remain below fundamental levels and new housing starts have been trending lower for some time. Falling interest rates would provide a further tailwind to residential activity, as will new government initiatives to support housing construction. That said, lower immigration will reduce some demand for housing, especially in the largest cities, which have long seen more than their fair share of newcomers to Canada. Additionally, the federal government has removed the GST first-time home buyers of new homes valued up to $1 mn, and reduced the GST on new homes between $1–1.5 mn for first-time home buyers. This policy will add to housing demand, however other factors such as tariff uncertainty and softer labour markets are likely to dominate in the near-term.
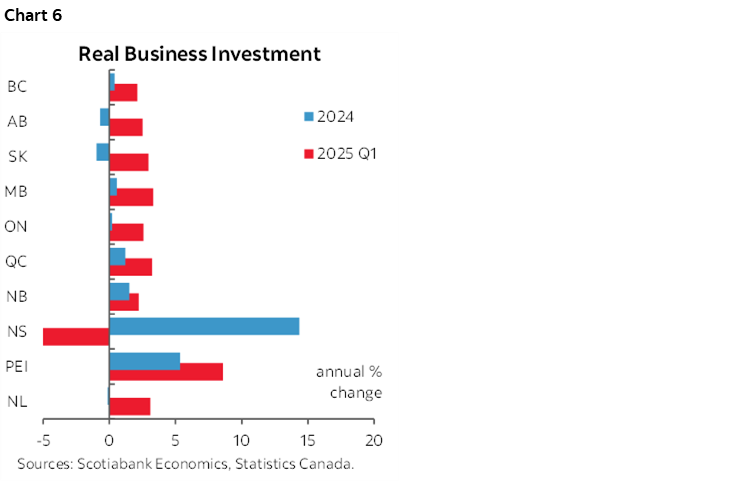
Business investment is picking up from sluggish levels. Canada’s track record of weak business investment continued in 2024, with most provinces recording modest (or negative) growth in business investment, with the exception of Nova Scotia and PEI, which registered increases of roughly 15% and 5%, respectively. 2025 has gotten off to a better start, with all provinces so far on track to beat their 2024 numbers—aside from Nova Scotia, which saw a bit of a pullback after a very strong 2024 (chart 6). While the tariff war and related uncertainty is clearly negative for business investment, the medium-term outlook is promising with numerous major projects in the pipeline. The federal government’s intentions to significantly shorten major project approvals, and to identify and implement projects of ‘national interest’, should result in additional significant projects being added to the pipeline.
EXPORTS LIKELY TO FALL DUE TO TRADE WAR
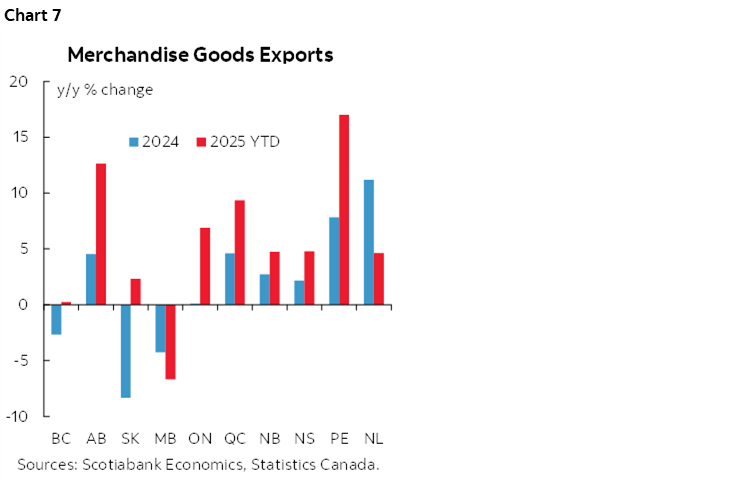
Strong Q1 export growth will unwind. Canadian exports were elevated in Q1 (chart 7), as American firms brought in extra products ahead of tariffs coming into effect, which boosted Canadian growth to start the year. The start of the unwinding of this impact was evident in the export data for April, which showed the lowest monthly reading for Canadian merchandise goods exports since 2021. Canadian exports are likely to remain weak through the rest of the year, due to the continued (and recently increasing) tariffs, as well as the spillovers from slower U.S. growth brought about by its trade war. While the Canadian outlook could be boosted by the elimination of the U.S. tariffs on Canada, as long as significant tariffs remain many of the U.S.’s trading partners (especially China), U.S. growth is likely to remain lower, which will continue to depress on Canadian exports.
Chinese tariffs are also having impacts. While the most of the focus in Canada has (rightly) been on the U.S. trade war, China’s 25% tariffs on seafood and 100% tariffs on some canola products are having impacts in some parts of Canada, especially Atlantic Canada and the Prairies. Nova Scotia is most negatively impacted, as roughly 9% of its total exports are affected by these tariffs, mainly lobster. Newfoundland & Labrador and Saskatchewan will see impacts on their shrimp and canola meal exports, respectively.
DEMOGRAPHIC HEADWINDS
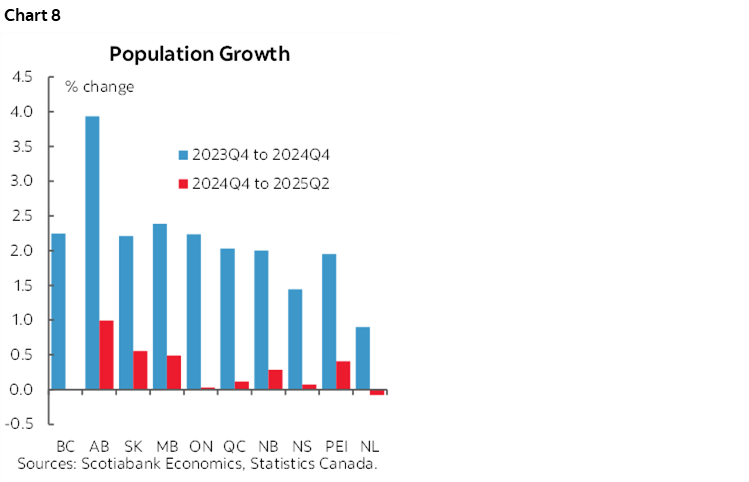
The provinces’ longer-term growth prospects are strongly influenced by demographic factors. A pullback in permanent resident admissions, along with a sizeable contraction in non-permanent residents is materially slowing population and labour force growth across Canada (chart 8). Federal government policies are focused on significantly reducing the number of non-permanent residents (NPRs), especially though lower issuance of study permits and International Mobility Program permits. As a result of the changes in immigration policy, there has been very limited population growth so far in 2025 (with the population in NL estimated to be lower than it was six months ago). This is expected to continue, as the federal government intends to reduce the proportion of NPRs from 7.3% of the total population to the targeted 5% by end-2027. Our baseline scenario predicts population growth will slow to 1.0% in 2025 and 0.5% in 2026.
The drop in non-permanent residents will be a key factor in shaping the differing outlooks of the provinces. We expect that Ontario and British Columbia (B.C.) will feel the most pronounced effects of the changed federal government immigration policies, due to their high numbers of international students, and they have indeed seen among the largest slowdowns in population growth so far this year. However, the Maritime provinces have experienced the largest slowdowns, as they are also facing a sharp decline in net interprovincial migration. Quebec is less affected due to its lower number of international students, but the tightened Labour Market Impact Assessment (LMIA) rules will eventually weigh on the province, given its reliance on this stream.
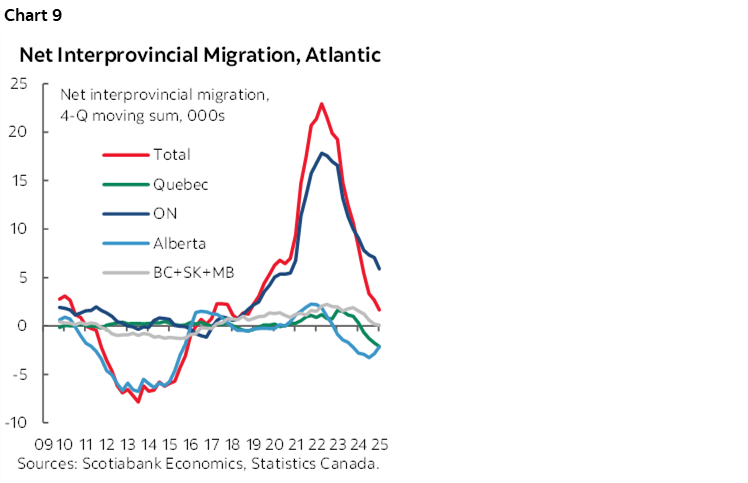
Interprovincial migration remains a challenge for the Atlantic provinces. While the flow of Ontarians moving East—a trend that began before the pandemic—continues, it is slowing quickly. In addition, these provinces are now experiencing a net loss of residents to Alberta and Quebec, and small (and slowing) net inflows from other provinces (chart 9). These trends are expected to persist, and as the movement of Ontarians to the Atlantic provinces continues to slow, this region may face stagnant or even negative net interprovincial migration. This, alongside the slowdown in international migration, will weigh on growth prospects in Atlantic Canada.
BRITISH COLUMBIA
British Columbia’s economy grew by slightly below the national average in 2024. Growth was primarily driven by the services industry as the goods industry continued to face headwinds, with a contraction in construction activity. Retail sales growth was subdued for most of 2024, but consumer spending picked up in late 2024 and early 2025 in response to declining interest rates. This momentum has since moderated amid rising uncertainty and tariff-related headwinds. Likewise, B.C.’s housing sales had begun to increase in Q4 of 2024 but pulled back in early 2025 to the lowest seasonally adjusted rate since mid-2023.
While B.C.’s unemployment rate remains below the national average, since the end of 2024 it has risen to slightly above its pre-pandemic average—despite job gains through the first five months. This is primarily owing to a rebound in the labour market participation rate that declined through much of the second half of 2024 when the province’s job growth was soft.
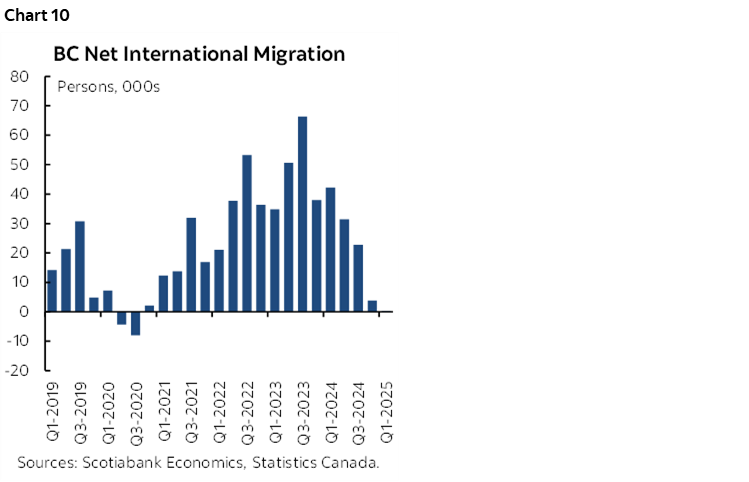
While B.C. diversified export base helps mitigate to some extent the impacts of the U.S. trade war, it is facing perhaps the strongest demographic headwinds of any provinces. The province has the highest share of non-permanent residents, and is already seeing sharp declines in immigration inflows (chart 10). These demographic headwinds will weigh on growth, including through limiting demand for new housing. Housing starts in B.C. have been trending lower since mid-2023, and so residential construction could drag on overall growth again in 2025, especially if interest rates remain higher-for-longer. However, the provincial government is increasing public capital spending, which will mitigate continued weakness in housing construction.
ALBERTA
Alberta had the third-highest rate of growth among the provinces in 2024, as the province continued to benefit from its natural resources as well as population gains—which were driven by both international and interprovincial migration. Retail sales were solid, surging in the fourth quarter last year as consumer spending responded to declining interest rates. Activity in the housing sector remained relatively steady in 2024 amid robust population growth, but pulled back in early 2025 following trade tensions with the U.S. to the lowest seasonally-adjusted rate since the first half of 2023. However, Alberta’s unemployment rate remains slightly above the national average and is up from end-2024 rate as employment levels have marginally declined through the first five months of the year amid tariff and uncertainty headwinds.
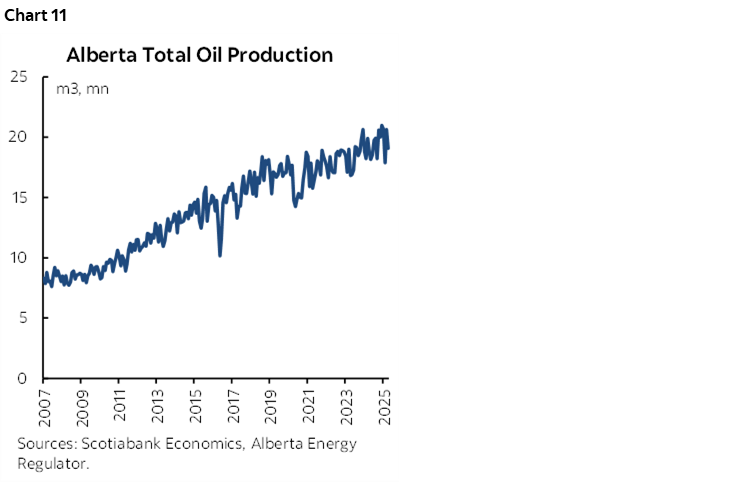
We expect the province to top the provincial growth ranking in 2025. While population growth is lower, the province remains an attractive destination for both international and interprovincial migrants, which continues to reinforce its demographic advantage. In addition, while exports to the U.S. represents a large share of Alberta’s GDP, much of this is energy products, which have a lower tariff rate and are not easily substituted in the near-term. As a result, oil production has remained steady through the early months of the tariff war (chart 11), and should continue to support solid growth in the province. In addition, investment in the oil and gas sector is expected to remain solid, and could be boosted further by the federal government’s efforts to see new major projects, including in the energy sector.
SASKATCHEWAN
Saskatchewan’s economy grew at the second-fastest rate among the provinces, behind only PEI, in 2024. Retail sales growth was solid through much of the year, and picked up at the turn of the year. While sales slowed in March as tariffs clouded the outlook, future prospects are supported by a resilient labour market. The unemployment rate declined through the first five months of this year, amid solid job gains and a marginally lower participation rate.
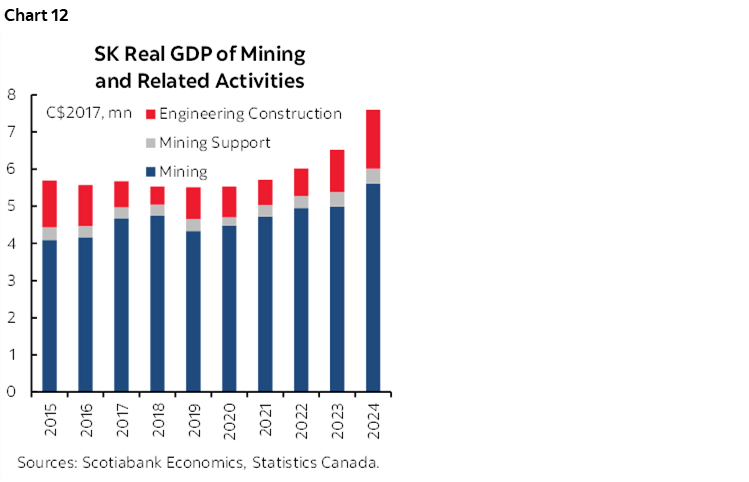
The mining sector had the largest contribution to growth in 2024, both directly through a large increase in the sector’s output as well as through boosting engineering construction (chart 12). Strong growth in this sector is likely to continue, due to the ongoing construction of BHP’s $14 billion Jansen potash mine—the world’s biggest—through 2029.
We see Saskatchewan overperforming the national average again in 2025, with continued strong growth in the mining sector and housing construction, and positive (though lower) population growth. While the Chinese tariffs on some canola products affects the province, the impact is limited as the tariffs do not cover its main canola export: canola seed.
MANITOBA
Manitoba’s economy grew slightly below the national average in 2024, with growth driven entirely by services industries as elevated interest rates weighed on the goods-component of the economy. Declining interest rates through last year helped support an uptick in consumer spending. Strength in retail sales was building in the fourth quarter of last year and early this year. Housing sales activity continued to pick up in 2024 but have since levelled off earlier in 2025 as tariff headwinds and uncertainty weighed on the outlook.
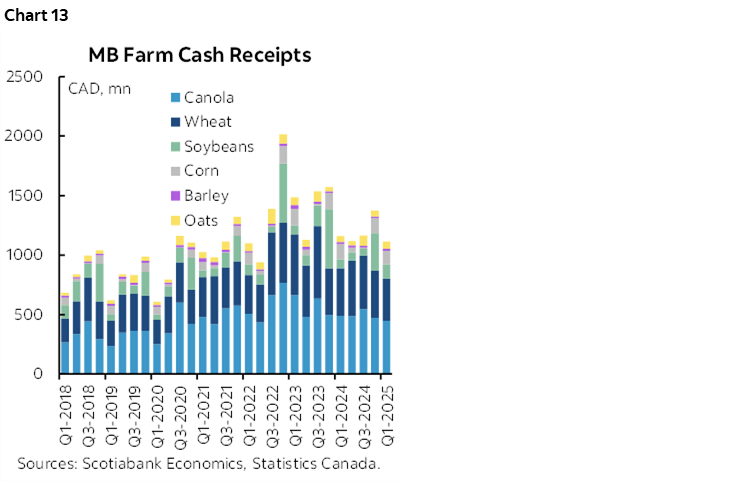
The agriculture sector, the province’s largest export category, has been steady (chart 13). Like Saskatchewan, Manitoba is affected by the Chinese tariffs on some canola products, but the impact has been limited by their narrow scope. Exports of consumer goods, which more than doubled between 2017 and 2022, remain solid but have retreated somewhat since 2023.
We expect growth in the Manitoba economy roughly in line with the national average for this year and next. Population growth is lower but remains positive, and the province’s diversified export base should help mitigate some of the impacts of the tariffs. Exports in April were down sharply compared to the previous April, but there were significant distortions in international trade in the first months of 2025, as U.S. firms pulled forward some imports to avoid the tariffs. The trade numbers should normalize somewhat over the rest of the year, though Manitoba does have significant amounts of economic activity in the sectors most targeted by the U.S. tariffs, including steel and aluminum and auto manufacturing, as well as sectors that could face sector-specific tariffs in the future, including pharmaceuticals. As a result, the impacts of U.S. trade war on the Manitoba economy could increase over the course of the year.
ONTARIO
Ontario’s economy grew slightly below the national average in 2024, as growth in services industries was partially offset by weakness in goods industries. Manufacturing and construction activity both contracted last year, weighed down by previously elevated interest rates. While retail sales grew below the national average in 2024, sales activity picked up in the fourth quarter. This momentum carried into the first quarter of 2025 as consumer spending responded to declining interest rates before growth slowed amid tariff and uncertainty headwinds. Activity in the province’s housing sector had also begun to increase in the fourth quarter last year but pulled back in recent months, slowing to the lowest seasonally adjusted rate since late-2023.
The province’s labour market appears to be bearing the brunt of the U.S. tariff effects, with 60,000 jobs lost over March and April. The unemployment rate has risen nearly a full percentage point above its pre-pandemic average. While U.S. tariffs imposed on goods-imports currently allow for exemption of most CUSMA-compliant products, the slowdown in trade and ensuing economic activity continue to weigh on Ontario’s growth outlook.
The automotive industry is a key sector in Ontario’s economy and highly integrated across the North American corridor. In 2024, Ontario’s motor vehicles and parts exports to the world totaled $68.2 bn, with exports to the U.S. totaled $65 bn, of which roughly two-thirds are subject to tariffs. While the U.S. tariffs on automotive parts have not yet come into effect, tariffs on automotive imports continue to disrupt and pose headwinds to the automotive sector which will drag on Ontario’s outlook.
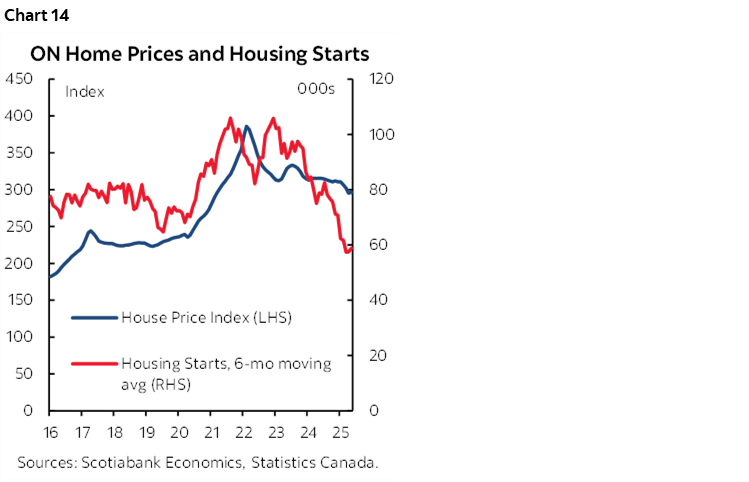
In addition to the population and tariff headwinds, Ontario is likely also to face drag again this year from residential investment. Despite a continued need for accelerating the pace of homebuilding, housing starts in Ontario have trended lower since 2022 (chart 14). As a result, residential investment has dragged on the province’s growth for the past three years. Despite falling interest rates, this slowdown accelerated in 2024, and the onset of the U.S. trade war contributed to housing starts in March 2025 falling to their lowest level since August 2009: the tail-end of the Great Recession. Starts rebounded somewhat in April and May, but remain significantly lower than the level needed to meet the province’s goal of building 1.3 million new homes by 2031. Absent a significant pick-up in housing construction, residential investment is likely to be weak or negative again in 2025, weighing on Ontario’s overall growth rate and desired improvements in housing affordability. Despite the pent-up demand for housing, sharply lower immigration and higher-for-longer interest rates are headwinds to unleashing housing construction. We expect Ontario to underperform the national average in both 2025 and 2026.
QUEBEC
Quebec’s economy grew slightly below the national average in 2024. This growth was driven by expansion in the services sector, which was partially offset by weakness in the goods sector. Previously elevated interest rates contributed to contractions in manufacturing and utilities, which were partially offset by improvements in construction, crop production, and metal mining activity.
Declining interest rates were supporting a recovery in consumer spending. Retail sales grew above the national average as declining interest rates supported consumer spending growth in 2024-Q4, with momentum carrying into 2025-Q1 before growth slowed amid tariff and uncertainty headwinds. Meanwhile, housing sales activity in the province through the fourth quarter was recovering but has since pulled back somewhat. Quebec’s labour market has been fairly resilient in the face of tariff headwinds so far in 2025, with the unemployment rate up only marginally from December. However, job growth through the first five months of 2025 has slowed significantly.
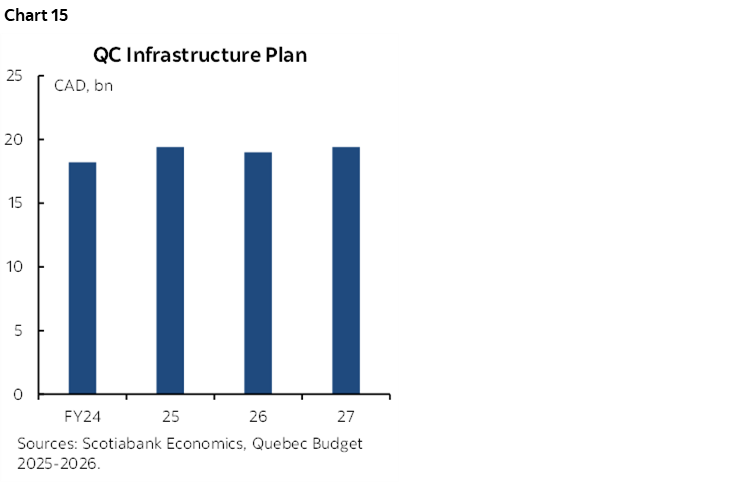
Although Quebec will be less affected by the changes to federal immigration policy, the U.S. tariffs will increasingly weigh on its economy, especially the steel and aluminum sector. In 2024, Quebec’s U.S.-destined exports of aluminum and steel now subject to tariffs were $10.8 bn and $2.8 bn respectively, accounting for more than 90% of the same exports to the world. The U.S.-imposed 50% tariffs on steel and aluminum imports will drag on Quebec’s exports of these metals. However, growing public investment will help to mitigate some of these impacts (chart 15). We see Quebec underperforming the national average this year and next.
MARITIME PROVINCES
Growth in the Maritime provinces of New Brunswick, Nova Scotia, and Prince Edward Island in 2024 was led by PEI, which grew at the fastest rate of all ten provinces. The economies of both Nova Scotia and New Brunswick also grew above the national average in 2024. The services sector was the primary driver of growth across the three provinces, aided by strength in the construction and manufacturing sectors.
Retail sales growth across the Maritimes was in line with, or above, the national average in 2024 as consumer spending growth persisted into the first quarter of 2025. And while job gains have slowed in the first five months of 2025, labour markets across the Maritime provinces remain steady with the May unemployment rate closely in line with end-2024 in PEI and Nova Scotia, and even declining in New Brunswick.
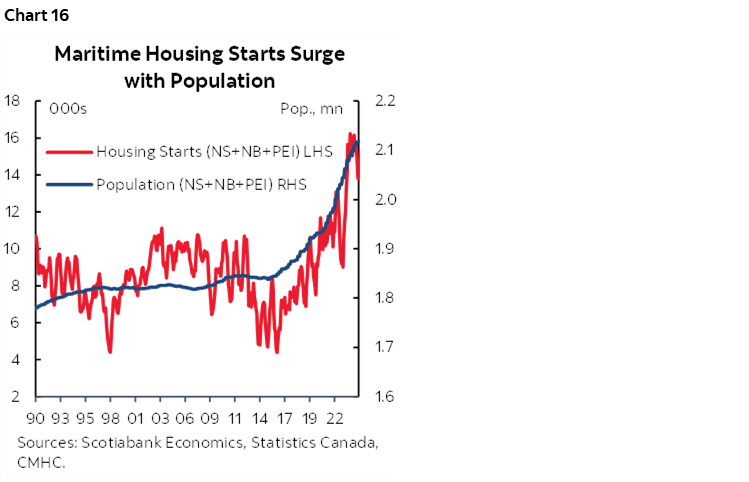
The Maritime’s unit housing sales in 24Q4 increased to the highest rate since 2022H1 but have pulled back somewhat in early 2025 as tariff and uncertainty headwinds grew, with the retreat more pronounced in Nova Scotia which also experienced the largest uptick in late-2024. The region’s strength in economic activity is reflective of the population growth that, while although expected to slow as a result of the federal governments reduced international migration targets, should support further growth in the region. In particular, residential housing construction is likely to continue to contribute positively to growth, given the continued boom in new housing starts (chart 16).
The Maritimes are less exposed to trade risk than some other provinces, due to their lower export shares. Early data in 2025 show that these economies have been fairly resilient to the U.S. tariff war, though PEI has seen some considerable job losses. In addition, population growth has remained positive. We expect growth in the Maritimes to slow, but overperform the national average in 2025 and 2026.
NEWFOUNDLAND AND LABRADOR
Newfoundland and Labrador’s economy rebounded strong in 2024 after having contracted the prior two years. Growth was supported by the province’s natural resources, notably through increased oil & gas as well as mining activity. Population growth and job gains, along with declining interest rates, fueled a rise in consumer spending. Retail sales growth was strong through much of last year, likewise was housing market activity picking up. Momentum was carrying into the first quarter of 2025 before pulling back in March amid tariff and uncertainty headwinds.
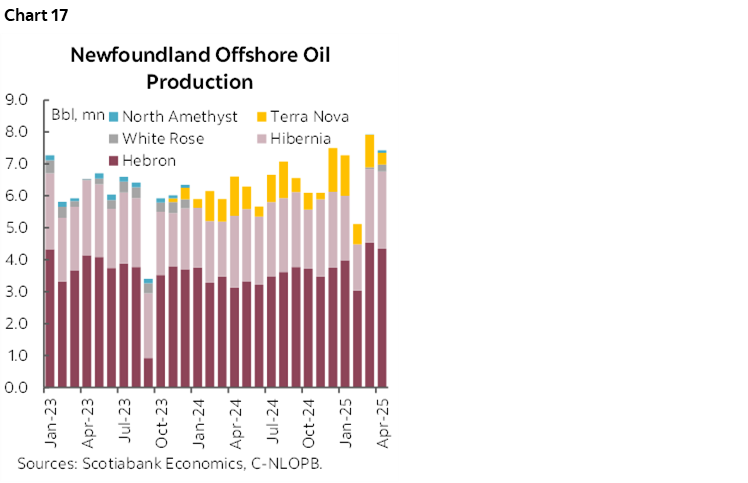
Oil production has continued to trend higher through the early months of the U.S. trade war (chart 17). While oil production is expected to eventually taper off as fields reach the end of their lifespans, the planned hydroelectricity capital projects at Churchill Falls and other sites will help to mitigate a slowdown in oil and gas and provide an important new source of growth in the provincial economy.
While population growth has been negative in the first half of 2025, economic data shows that the economy has been quite resilient through the first months of the U.S. trade war. We expect the provinces to overperform the national average in both this year and next.
DISCLAIMER
This report has been prepared by Scotiabank Economics as a resource for the clients of Scotiabank. Opinions, estimates and projections contained herein are our own as of the date hereof and are subject to change without notice. The information and opinions contained herein have been compiled or arrived at from sources believed reliable but no representation or warranty, express or implied, is made as to their accuracy or completeness. Neither Scotiabank nor any of its officers, directors, partners, employees or affiliates accepts any liability whatsoever for any direct or consequential loss arising from any use of this report or its contents.
These reports are provided to you for informational purposes only. This report is not, and is not constructed as, an offer to sell or solicitation of any offer to buy any financial instrument, nor shall this report be construed as an opinion as to whether you should enter into any swap or trading strategy involving a swap or any other transaction. The information contained in this report is not intended to be, and does not constitute, a recommendation of a swap or trading strategy involving a swap within the meaning of U.S. Commodity Futures Trading Commission Regulation 23.434 and Appendix A thereto. This material is not intended to be individually tailored to your needs or characteristics and should not be viewed as a “call to action” or suggestion that you enter into a swap or trading strategy involving a swap or any other transaction. Scotiabank may engage in transactions in a manner inconsistent with the views discussed this report and may have positions, or be in the process of acquiring or disposing of positions, referred to in this report.
Scotiabank, its affiliates and any of their respective officers, directors and employees may from time to time take positions in currencies, act as managers, co-managers or underwriters of a public offering or act as principals or agents, deal in, own or act as market makers or advisors, brokers or commercial and/or investment bankers in relation to securities or related derivatives. As a result of these actions, Scotiabank may receive remuneration. All Scotiabank products and services are subject to the terms of applicable agreements and local regulations. Officers, directors and employees of Scotiabank and its affiliates may serve as directors of corporations.
Any securities discussed in this report may not be suitable for all investors. Scotiabank recommends that investors independently evaluate any issuer and security discussed in this report, and consult with any advisors they deem necessary prior to making any investment.
This report and all information, opinions and conclusions contained in it are protected by copyright. This information may not be reproduced without the prior express written consent of Scotiabank.
™ Trademark of The Bank of Nova Scotia. Used under license, where applicable.
Scotiabank, together with “Global Banking and Markets”, is a marketing name for the global corporate and investment banking and capital markets businesses of The Bank of Nova Scotia and certain of its affiliates in the countries where they operate, including; Scotiabank Europe plc; Scotiabank (Ireland) Designated Activity Company; Scotiabank Inverlat S.A., Institución de Banca Múltiple, Grupo Financiero Scotiabank Inverlat, Scotia Inverlat Casa de Bolsa, S.A. de C.V., Grupo Financiero Scotiabank Inverlat, Scotia Inverlat Derivados S.A. de C.V. – all members of the Scotiabank group and authorized users of the Scotiabank mark. The Bank of Nova Scotia is incorporated in Canada with limited liability and is authorised and regulated by the Office of the Superintendent of Financial Institutions Canada. The Bank of Nova Scotia is authorized by the UK Prudential Regulation Authority and is subject to regulation by the UK Financial Conduct Authority and limited regulation by the UK Prudential Regulation Authority. Details about the extent of The Bank of Nova Scotia's regulation by the UK Prudential Regulation Authority are available from us on request. Scotiabank Europe plc is authorized by the UK Prudential Regulation Authority and regulated by the UK Financial Conduct Authority and the UK Prudential Regulation Authority.
Scotiabank Inverlat, S.A., Scotia Inverlat Casa de Bolsa, S.A. de C.V, Grupo Financiero Scotiabank Inverlat, and Scotia Inverlat Derivados, S.A. de C.V., are each authorized and regulated by the Mexican financial authorities.
Not all products and services are offered in all jurisdictions. Services described are available in jurisdictions where permitted by law.