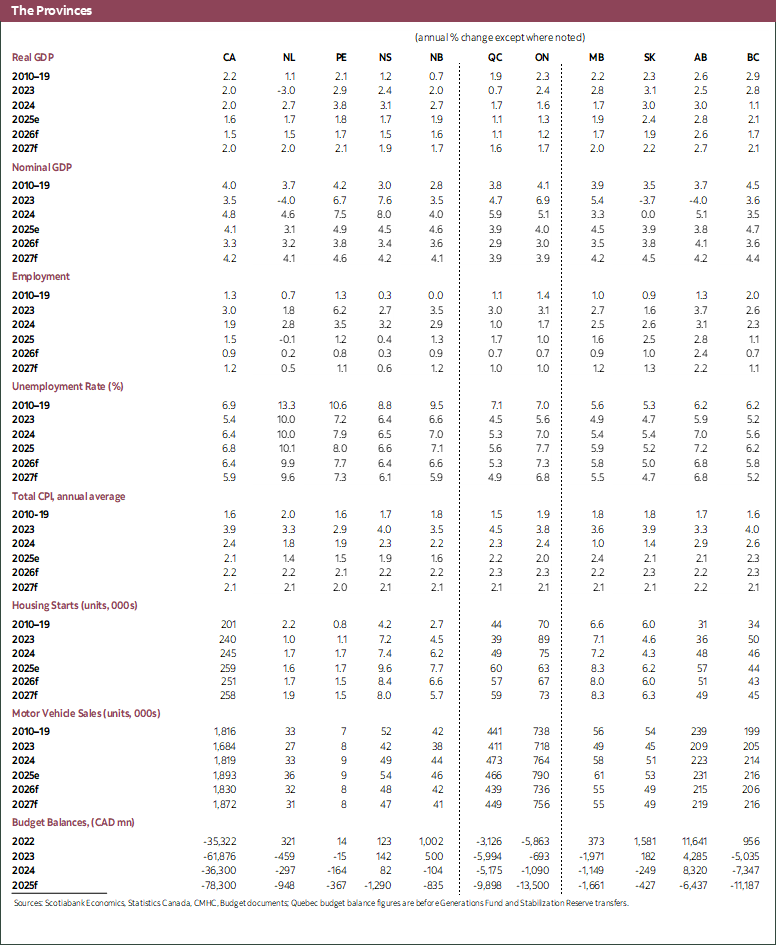
HIGHLIGHTS
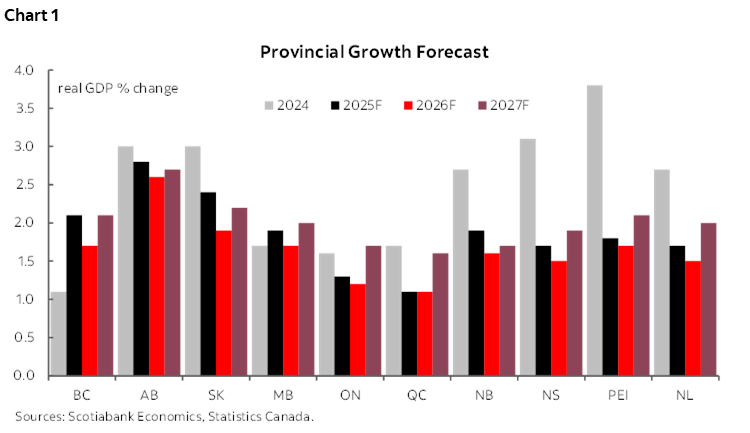
Growth in most Canadian provinces has slowed somewhat (chart 1). After building up economic momentum over the course of 2024, the Canadian economy slowed in 2025 due to the significant and dynamic trade shocks, as well as reduced immigration inflows. Although the U.S. and Chinese tariffs have eased somewhat from initial levels, and most sectors continue to operate on a free-trade basis, the U.S. Section 232 tariffs are a significant headwind on impacted sectors (steel and aluminum, autos, etc.). The burden of these tariffs differs greatly from province to province, with Ontario and Quebec seeing average tariffs of more than 5% on their exports to the U.S., and some other provinces seeing nearly none (chart 2). Economic uncertainty is somewhat lower than earlier this year, but continues to weigh on business investment. In particular, the country is bracing for the review of CUSMA, which to date has significantly limited the impact of tariffs in most sectors and provinces. In response to softer economic and labour market data, the Bank of Canada made two 25 basis point cuts in the Fall of 2025, and the federal and provincial governments have increased capital spending intentions—in addition to efforts to remove barriers to major new projects. These policy measures will provide some support to provincial economies, especially starting in 2027. However, slowing population growth is simultaneously lowering underlying potential growth, especially in the provinces that in recent years saw the highest numbers of international students and other non-permanent resident inflows. For the Canadian economy as a whole, we expect growth to have slowed from 2% in 2024 to around 1.6% last year, and to slow slightly further to 1.5% in 2026, before rebounding to around 2% in 2027. Canada’s western provinces are positioned to grow faster than the national average, due to lower effective tariff rates on their export baskets, and more resilient population growth in the Prairies. In contrast, we expect Ontario and Quebec to experience the slowest growth, driven by their deeper higher exposures to tariff and immigration impacts. Meanwhile, we expect Canada’s eastern provinces to grow roughly in line with or slightly above the national average, as their lower exposure to tariffs is offset by lower potential growth.

HOUSEHOLD CONSUMPTION SOFTENING
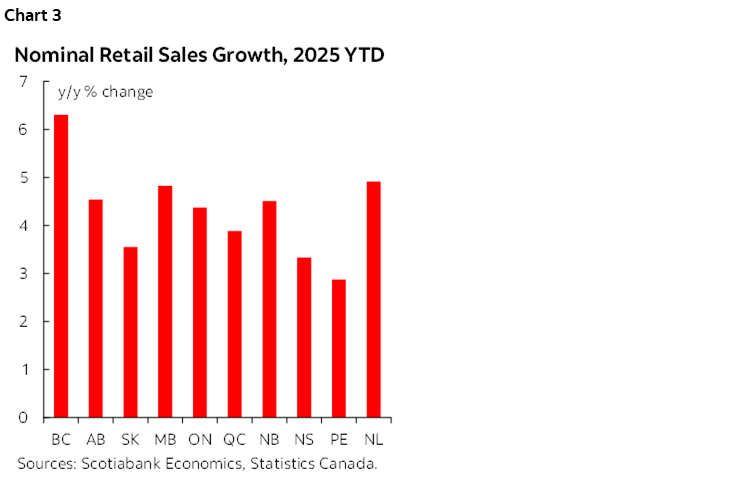
Household spending growth has been resilient but is slowing. Consumer spending in Canada was strong in the first half of 2025 despite the tariff shock, but has been moderating in many provinces since then. Through the first ten months of the year, retail sales in most provinces were running at about 4% higher (chart 3), with B.C. the outlier on the high side and PEI the weakest. We expect somewhat weaker household spending growth in 2026 than 2025 due to the slowing population growth and the ongoing trade uncertainty. The interest rate cuts late last year will provide some support, especially in the provinces with the highest household debt levels, including Ontario and B.C. We expect the Bank of Canada to keep interest rate unchanged for most of 2026, and our current forecast tentatively pencils in hikes starting toward the end of 2026 that return the overnight rate to 3% in early 2027—predicated on inflation continuing to diminish and the economy getting on a stronger footing.
Trade‑related pressures continue to affect the consumption outlook. Tariffs remain a significant contributor to elevated input costs across supply chains, indirectly affecting consumer prices. Despite these pressures, inflation is projected to return close to 2% by the second half of 2026, providing welcome relief to household purchasing power and supporting a rebound in consumption growth later in the outlook period.
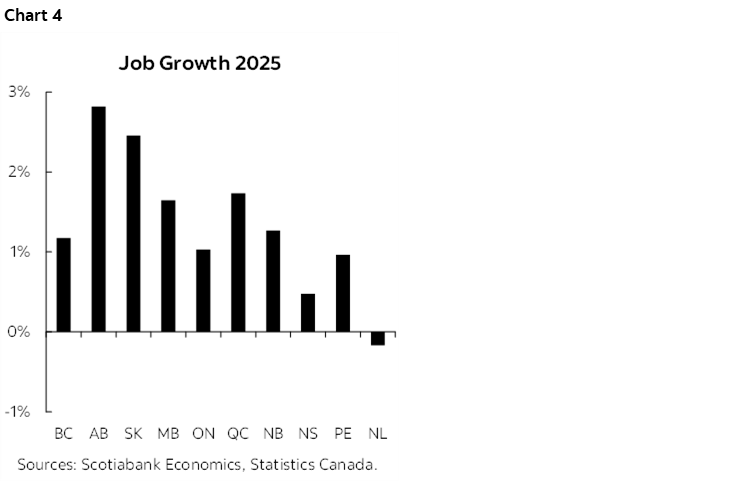
A strengthening labour market provides some upside risk to household spending. Canada’s labour market regained momentum near the end of 2025 after a period of weakness in the Summer. Following job losses in July and August and several months of stagnation, hiring rebounded in the fourth quarter, with employment gains averaging 42.8k per month. This improvement pushed full‑year employment growth to 1.4%, highlighting the resilience of labour demand amid broader economic headwinds. Labour market performance, however, varied significantly across provinces in 2025 (chart 4). Alberta and Saskatchewan recorded the strongest job growth, rising 2.8% and 2.5% in 2025, respectively. At the other end of the spectrum, Newfoundland and Labrador (-0.2%) and Nova Scotia (+0.5%) posted the weakest employment gains in 2025. The other provinces experienced moderate growth of 1–1.7%, reflecting varied exposure to trade disruptions, sector‑specific constraints, and demographic transitions.
INVESTMENT GROWTH LOWER BUT EXPECTED TO PICK UP
Home sales have been resilient in most provinces. Despite the significant economic uncertainty that emerged in 2025, the value of existing home sales continued to grow steadily in most provinces, with Quebec and Newfoundland and Labrador leading the way with over 15% growth. The most expensive markets of British Columbia and Ontario saw declines in the Spring, though activity in these markets recovered somewhat by the Summer, when the initial shock of the tariff war had diminished. However, the number of recently completed and unabsorbed dwellings has increased, which may portend further price adjustments in weaker markets.
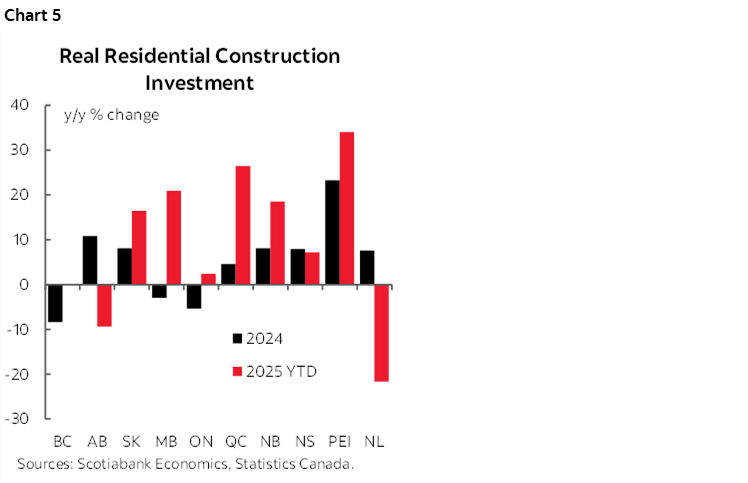
Residential investment has also accelerated in most provinces. Residential construction contributed positively to growth through the first ten months of the year in most provinces, but has dragged in Alberta, and Newfoundland and Labrador (chart 5). In addition, housing starts in 2025 were higher in all provinces except British Columbia, Ontario and Newfoundland and Labrador, indicating that residential investment should contribute to growth again in most provinces this year. The Bank of Canada’s interest rate cuts in the Fall, federal housing measures, as well as the lower uncertainty could help unlock some pent-up demand for housing, though lower immigration flows will reduce some demand for housing—especially in the largest cities.
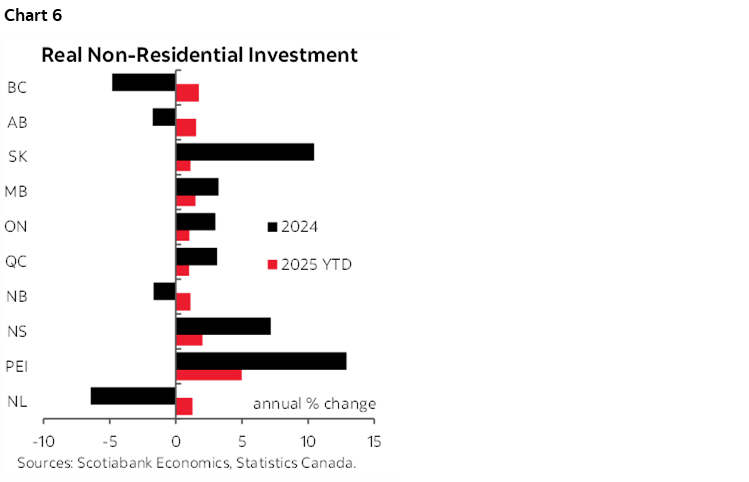
Non-residential investment is subdued but should rebound. Business investment growth in Canada has been very limited for a number of years, and this has continued since the tariff shock—though at least does not appear to have worsened significantly. Higher government capital investment has helped to keep overall non-residential investment growth modestly positive in all provinces (chart 6). The ongoing tariffs and persistent uncertainty continue to weigh on new business investment but a modest abatement of uncertainty and the efforts to remove barriers to investment—especially for major projects—should result in a pick-up in business investment starting in 2027. In addition, public investment should continue to grow, given stated intentions by the federal and provincial governments. Western Canada may see a particularly strong pick-up in investment, given the number and size of projects in that region already referred to the Major Projects Office—in addition to the recent Canada-Alberta MOU on energy issues. That said, there is still significant implementation risk that warrants caution in fully incorporating these into our baseline just yet.
EXPORTS VOLATILE BUT SOME IMPROVEMENTS SEEN
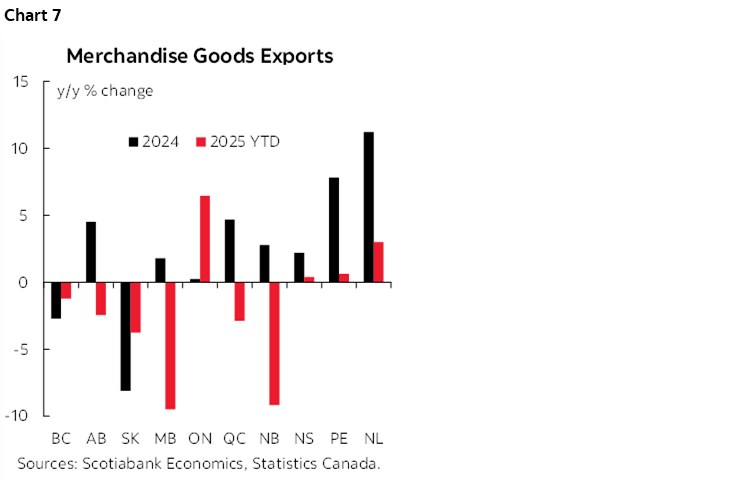
Exports have shown some rebounding after a turbulent start to the year. After a banner January for Canadian exports, driven by American firms importing extra products ahead of tariffs coming into effect, most of the rest of the year saw weak exports, especially in the sectors most targeted by the U.S. tariffs, including steel and aluminum, autos, and forestry. As a result, most provinces appear to have exported less in 2025 (chart 7), with the largest declines in Manitoba and New Brunswick (both around 10% lower through October). However, figures for September and October showed a clear rebound. This was to a large degree driven by gold, but it also included an improvement in exports of motor vehicles and parts—reflecting the continued integration of the Canada and U.S. auto manufacturing sectors, which cannot be undone overnight. We expect net exports to continue to drag on growth in 2026 and 2027, though less so than in 2025. Central Canada is likely to continue to face the largest burdens from the U.S. tariffs, given its higher integration with the U.S. economy and concentrations of targeted sectors. Some type of relief from the sectoral tariffs would boost prospects, though this seems like a remote possibility at this point—at least in the near-term. More likely is greater turbulence as we get closer to the scheduled discussions around renewing CUSMA—including potential U.S. threats to withdraw from the agreement entirely.
Lower Chinese tariffs should provide a small boost to export growth. The news in mid-January that China will be removing or reducing the tariffs on canola products and seafood in March was welcome news, especially to the farmers in the Prairies and seafood producers in Atlantic Canada. The impacts of the tariffs have not seemed very significant, with prices and trade volumes in those sectors remaining fairly stable throughout 2025. However, the de-escalation in at least one of Canada’s trade wars is promising and positions these sectors for stronger growth in 2026.
DEMOGRAPHIC HEADWINDS CONTINUE
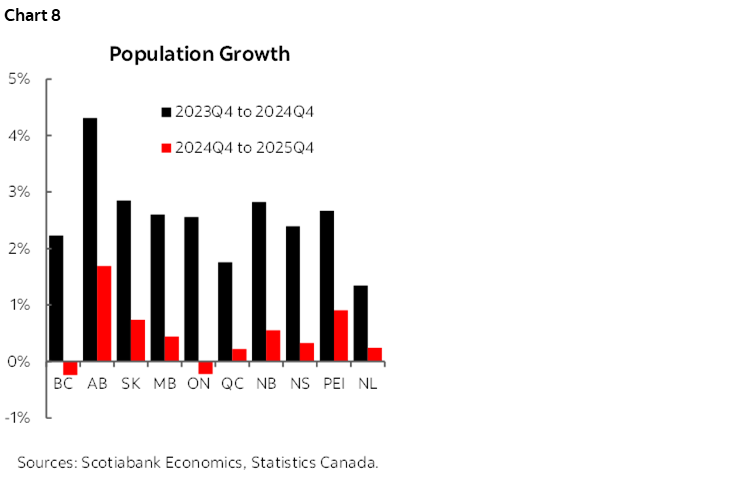
The provinces’ longer-term growth prospects are strongly influenced by demographic factors. A pullback in permanent resident admissions, along with a sizeable contraction in non-permanent residents, is materially slowing population and labour force growth across Canada. As a result of the changes in immigration policy, there was very limited population growth so far in 2025 (chart 8). We expected that Ontario and B.C. would feel the most pronounced effects of the changed federal government immigration policies, due to their high numbers of international students, and they did indeed see the weakest population growth in 2025—in fact seeing their populations contract somewhat over the course of the year. All provinces are facing significant slowdowns, which will weigh on potential growth in each province, though Alberta’s population growth remains solid at close to 2%.
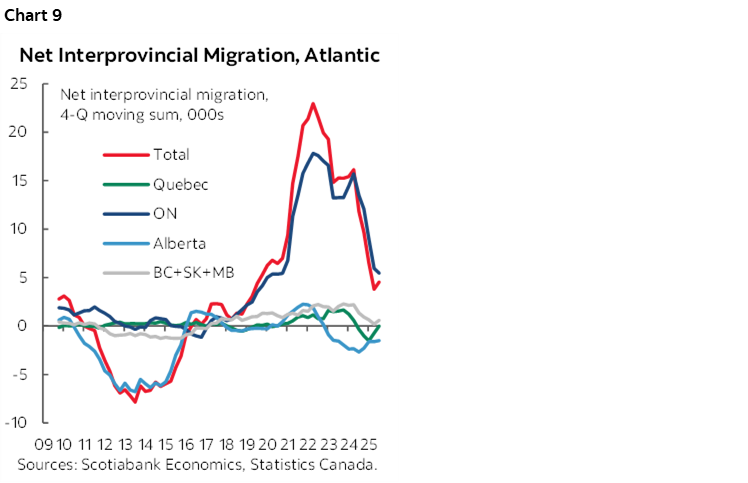
Falling interprovincial migration remains an additional challenge for the Atlantic provinces. While the flow of Ontarians moving East—a trend that began before the pandemic—continues, it is slowing quickly. In addition, these provinces are now experiencing a net loss of residents to Alberta and broadly neutral flows from other provinces (chart 9). The net result of this is that the region is only seeing net interprovincial migration inflows of around 5,000 people per year, down from over 20,000 in 2022. These trends are likely to persist, and as the movement of Ontarians to the Atlantic provinces continues to slow, this region may face stagnant or even negative net interprovincial migration.
BRITISH COLUMBIA
B.C.’s unemployment rate has risen slightly over the course of the year, but the province has seen a net gain in jobs in both services- and goods-producing sectors since the start of the tariff war. This, along with stable exports so far this year, indicate that the province’s less U.S. export-oriented economy is helping it remain fairly resilient through the trade shock.
Despite the tariff shock, consumer spending growth was very strong in the first half of the year, especially on motor vehicles. While household consumption has softened in the second half, it should still provide a large boost to B.C’s overall growth rate for 2025. Home sales in the expensive B.C. housing market fell at the beginning of the tariff war, but have been gradually recovering since the Summer as uncertainty has fallen from the Spring peak.
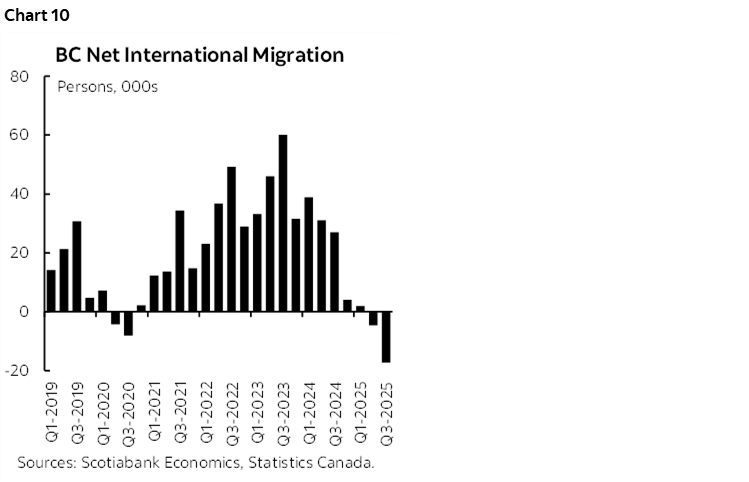
While B.C. diversified export base helps mitigate to some extent the impacts of the U.S. trade war, it is facing significant demographic headwinds. The province has the highest share of non-permanent residents, and has seen its immigration inflows drop and its outflows increase, resulting in a drop in net international migration even larger than during the pandemic (chart 10). These demographic headwinds will weigh on growth in the province, including through limiting demand for new housing over the medium-term. Housing starts in B.C. have been fairly flat over the past ten years, and residential construction is on track to contribute only modestly to growth in 2025.
That said, new major projects are a tailwind for the B.C. economy. The Kitimat LNG terminal became operational in the middle of 2025, supporting growth in the second half of the year and beyond. Non-residential investment growth was modest in 2025, but we expect this to pick up in the coming years, given the provincial government’s plan to increase public capital spending, and because B.C. is home to many potential new major projects—including four of the first 11 projects referred to the new federal Major Projects Office.
Overall, we expect growth of 2.1% in 2025, 1.7% in 2026, and 2.1% in 2027, overperforming the national average in all years.
ALBERTA
Alberta grew by a robust 3% pace in 2024, as the province continued to benefit from its natural resources as well as strong population gains driven by both international and interprovincial migration.
We estimate that the province grew by a similar pace in 2025. Household consumption has softened somewhat since the tariff war started but remains solid, housing starts have continued to grow at a good clip, and non-residential investment has remained stable. Goods exports have fallen somewhat since the beginning of the year, but remain in line with the volumes seen over the last couple of years. The labour market remained strong, with employment up 2.8% and hours worked up 2.0% on the year—despite the teachers’ strike for most of October.
While population growth is lower, Alberta continues to see the highest rate of any province, which is reinforcing its demographic advantage. In addition, while exports to the U.S. represents a large share of Alberta’s GDP, much of this is energy products, which do not seem to have been impacted by tariffs and are not easily substituted in the near-term. As a result, oil production has continued to steadily increase, and should continue to support solid growth in the province—with an added boost from the operationalization of Trans Mountain pipeline expansion. In addition, investment in the oil & gas sector is projected to remain solid, and could be boosted further by the national efforts to see new major projects, including in the energy sector. However, oil prices have been trending lower for some time, which could put some incremental investments at risk.
While population growth is lower, Alberta continues to see the highest rate of any province, which is reinforcing its demographic advantage. In addition, while exports to the U.S. represents a large share of Alberta’s GDP, much of this is energy products, which do not seem to have been impacted by tariffs and are not easily substituted in the near-term. As a result, oil production has continued to steadily increase, and should continue to support solid growth in the province—with an added boost from the operationalization of Trans Mountain pipeline expansion. In addition, investment in the oil & gas sector is projected to remain solid, and could be boosted further by the national efforts to see new major projects, including in the energy sector. However, oil prices have been trending lower for some time (chart 11), which could put some incremental investments at risk.
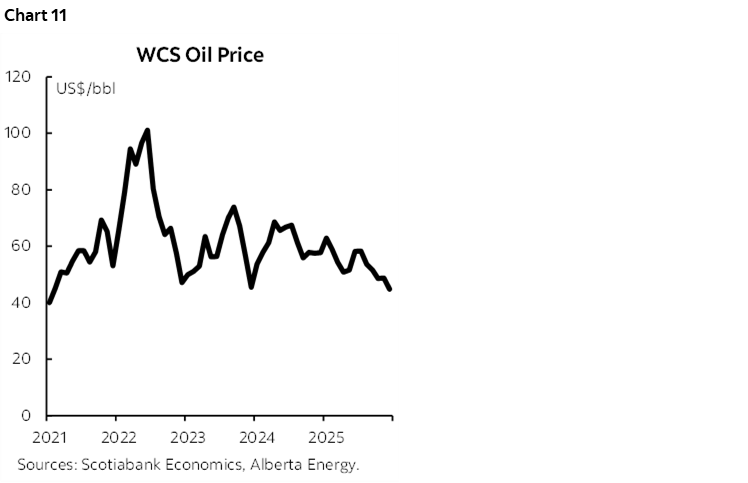
Broadly speaking, events in Venezuela underscore the case for export diversification, but the near-term impacts will likely be contained to modest price pressures on the WCS differential—giving back some of the gains following the TMX expansion coming on line. The proportion of Canadian heavy crude exports that go to the Gulf Coast and could be impacted by increased exports out of Venezuela over the medium-term is only about 10%.
We expect provincial growth of 2.8% in 2025, 2.6% in 2026, and 2.7% in 2027—best among provinces in all years.
SASKATCHEWAN
Saskatchewan’s economy also grew at a robust 3% clip in 2024, driven by strong household consumption and robust investment in the mining sector. These factors continue, and are being further supported by a pick-up in housing starts which has resulted in residential investment increasing by more than 15% through the first ten months of the year. China’s tariffs on canola products contributed to somewhat weaker farm exports this year—though stronger mining exports have partially offset this—and with the tariffs set to largely be removed in March, the agriculture sector could see a stronger 2026.
Job creation was strong in the first half of 2025, but softened somewhat in the second half of the year. After having dropped to 4.5% in Q2, the province’s unemployment rate rose to 5.9% in Q4—though remains substantially lower than the national average.
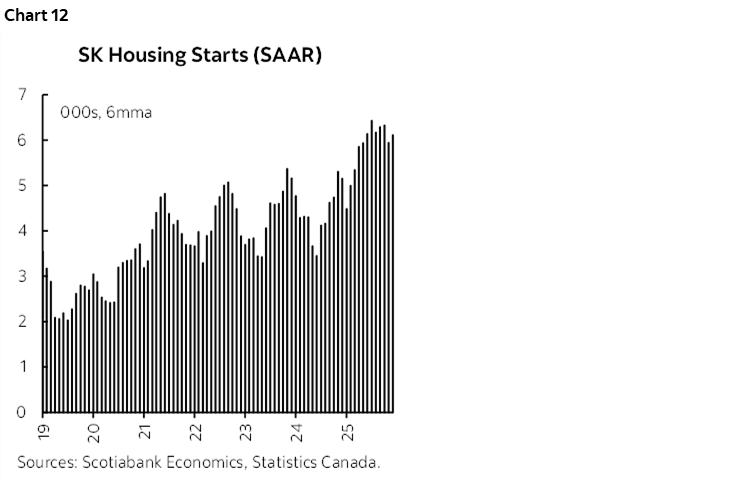
While population and labour force growth have slowed, they remain higher than for Canada overall, helping Saskatchewan maintain above-average potential growth. In addition, business investment growth is likely to continue to strengthen, due to the ongoing construction of the world’s biggest potash mine through 2029, and the potential addition of the Foran Copper Mine—which was one of the five first projects referred to the Major Projects Office. Residential investment is also helping to support growth, with new housing starts in 2025 up an impressive 41% compared to 2024 (chart 12).
Overall, we expect the Saskatchewan economy to have grown 2.4% in 2025, dipping to 1.9% in 2026 before rising to 2.2% in 2027—above the national average in each year.
MANITOBA
Economic indicators suggest that Manitoba has remained quite resilient, despite higher-than-average exposure to the U.S. trade shock. The province has outperformed the country in retail sales (up 4.8% year-to-date through October), home sales (up 11%), and residential investment (up 21%). Employment growth has slowed somewhat but remained positive, with 14k jobs added over 2025, and the unemployment rate has remained steady at around 6%.
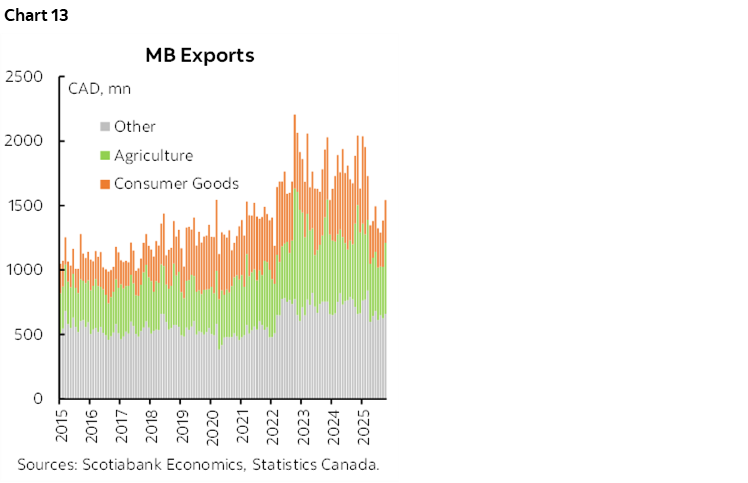
However, the U.S. tariffs and the related uncertainty have weighed on non-residential investment and exports. Business investment growth has been modest, and exports through the first ten months of the year were down 10% compared to same period last year (chart 13). The decline is quite broad-based, with most categories lower, and the largest declines in consumer goods and agriculture. With Manitoba’s higher-than-average exposure to the tariffs, export growth is likely to be weak again in 2026.
Population growth is also lower but remains positive. In addition, solid housing starts growth suggest that residential investment will continue to contribute to growth for some time, and farm receipts have remained solid—even despite the Chinese tariffs on canola products.
We expect growth in the Manitoba economy of 1.9% in 2025, 1.7% in 2026, and 2.0% in 2027—roughly in line, or slightly higher, than the national average in each year.
ONTARIO
The Ontario economy seems to have remained fairly resilient in 2025, despite a number of its sectors being hard hit by U.S. tariffs. Retail sales have remained broadly stable, and home sales have recovered somewhat following a slow period at the beginning of the year. Both residential and non-residential investment are tracking higher through the first ten months of the year compared to the same period in 2024, and housing starts have generally trended higher over the course of the year—though remain low compared to past years.
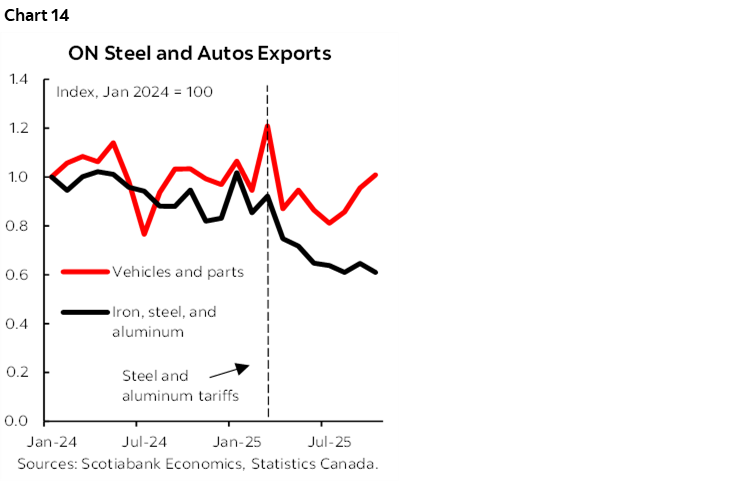
Higher exports of gold have helped to offset weaker exports in many sectors, including steel and aluminum. Ontario auto exports were also weaker in the middle of 2025, but have rebounded in recent months (chart 14)—reflecting the continued integration of the Canadian and U.S. auto manufacturing sectors.
After weakening in the Spring and Summer, employment in Ontario strengthened considerably toward the end of the year, and there are now an estimated 70k more people working in Ontario than before the onset of the tariff shock, with the largest gains in the health and transportation sectors—and manufacturing ending the year 1% higher. Hours worked averaged 0.4% lower in 2025 compared to 2024, but picked up slightly at the end of the year. The unemployment rate averaged 7.7% in 2025, up from 7.0%, despite a significant slowdown in population and labour force growth.
Looking forward, given the ongoing sectoral tariffs and ongoing uncertainty related to U.S. policy, and Ontario’s significant linkages with the U.S. economy, we expect the province to grow modestly at 1.3% in 2025 and 1.2% 2026. We expect growth to accelerate in 2027 as new investments, including related to new major projects, start to come online, with overall economic growth accelerating to 1.7% in that year.
QUEBEC
Quebec’s economy has slowed somewhat since the end of 2024, but has remained fairly resilient. Consumer spending has continued to steadily strengthen, and the housing market has similarly broadly ignored the tariff and uncertainty shock—with resale values up 17% on the year.
Residential investment and housing starts rose strongly over the course of 2025, bringing strong momentum into 2026; residential investment was up nearly 30% y/y in October. Partially offsetting the considerable strength in residential investment is continued weakness in non-residential investment growth—including flat business investment.
The labour market has continued to remain more resilient than we expected, given Quebec’s close trading links with the U.S. economy and the size of its aluminum sector—a key target of the U.S. sectoral tariffs. After increasing somewhat in the first half of 2025, the province’s unemployment rate trended lower in the second half of the year—despite the slowdown in labour force growth. Overall, the province gained 45k jobs over the course of the year, led by the education and finance, insurance, and real estate categories—and manufacturing holding its ground. However, total hours worked have increased much more modestly, growing only 0.1% in 2025 compared to 2024.
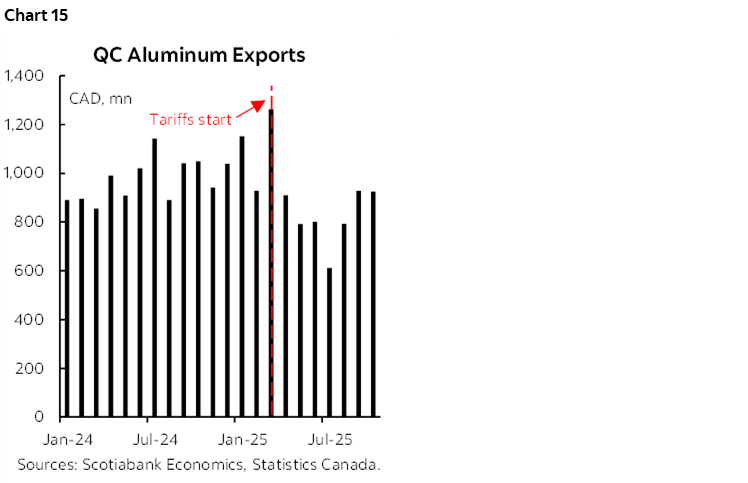
Despite the resilience in the economy overall, it is clear that the U.S. tariffs are having an impact on the Quebec economy. Quebec’s exports of aluminum, which represented 10% of the province’s total exports in 2024, fell by about 40% over the first half the year— but encouragingly rebounded somewhat in the Fall (chart 15). We expect the U.S. tariffs on steel and aluminum will continue to weigh on Quebec’s exports of these metals as long as the tariffs are in place, and the ongoing slowdown in population growth will also weigh on the broader economy. However, we expect growth to pick up in 2027 as non-residential investment starts to contribute more to growth, including through higher government infrastructure spending.
Overall, we see Quebec somewhat underperforming the national average, with growth of 1.1% in 2025 and 2026, and 1.6% in 2027.
MARITIME PROVINCES
All three of the Maritime provinces grew faster than the national average in 2024, with PEI recording the top growth rate of any Canadian province, though growth appears to have slowed in 2025—despite lower exposure to trade risks than Central Canada.
Employment growth remained positive but below the national average in all three provinces. Hours worked rose in New Brunswick, but fell in the other provinces. In line with the softness in the region’s labour market, Nova Scotia and New Brunswick had the weakest retail sales growth among provinces in 2025, only slightly outpacing inflation.
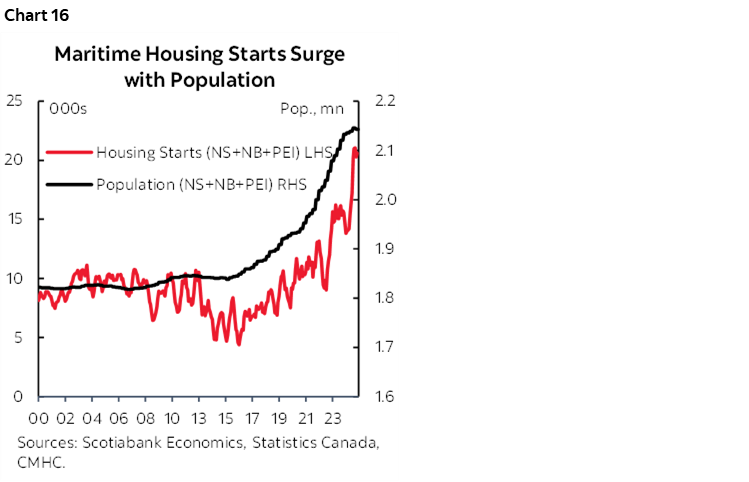
Helping to offset some of the weakness in household spending has been very strong performance on the investment side. Through the first ten months of 2025, residential investment was up 34% in PEI compared to the previous year, with the other provinces also seeing solid growth. In addition, new housing starts were up even more strongly in each province (chart 16), with PEI seeing a 47% increase—indicating that the housing boom resulting from the high population growth in recent years continues, and that residential investment should continue to contribute significantly to headline growth in 2026. Non-residential investment has also been contributing positively to growth in 2025, especially in PEI, where government capital spending was up 5% in the first three quarters of the year.
Exports in the region have also been fairly resilient, though New Brunswick is on track for a decline in 2025, led by lower energy exports to the U.S. Nova Scotia fish exports to China were also lower, reflecting the Chinese tariffs on Canadian seafood, but exports overall for the province have been stable—and the Chinese tariffs are set to be removed in March.
We expect growth in the Maritime provinces to have come down from their 2024 rates to slightly below 2% in 2025, and slow slightly further in 2026 as labour force growth continues to slow, and then pick up somewhat in 2027.
NEWFOUNDLAND AND LABRADOR
Newfoundland and Labrador’s economy rebounded with 2.6% growth in 2024 after having contracted the prior two years, though signals were a bit mixed in 2025.
The province had the weakest labour market performance in 2025, with both employment and hours worked trending slightly lower over the course of the year. In addition, residential investment is down 22%, though mainly because a very strong period of investment in late 2024 was not repeated in 2025.
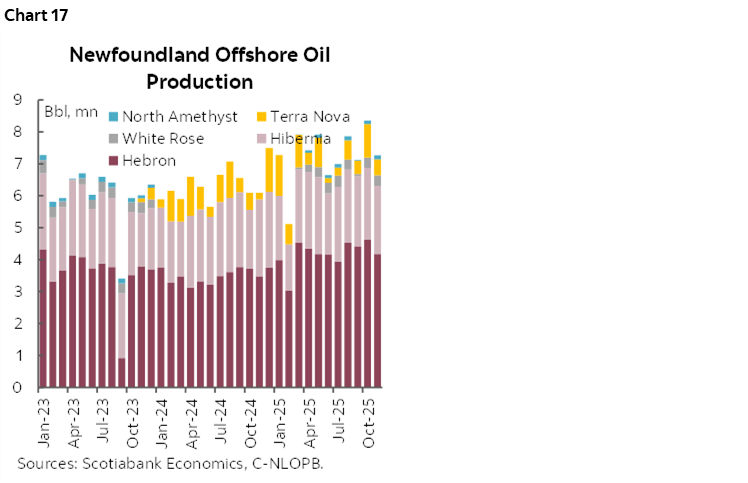
However, exports and non-residential investment have remained stable, and oil production has continued to trend higher (chart 17). While oil production is expected to eventually taper off as fields reach the end of their lifespans, the planned hydroelectricity capital projects at Churchill Falls and other sites should help to mitigate a slowdown in oil & gas and provide an important new source of growth in the provincial economy.
Overall, we expect the province to grow broadly in line with the national average, with growth slowing to 1.7% in 2025 and 1.5% in 2027, before rising to 2% next year.
DISCLAIMER
This report has been prepared by Scotiabank Economics as a resource for the clients of Scotiabank. Opinions, estimates and projections contained herein are our own as of the date hereof and are subject to change without notice. The information and opinions contained herein have been compiled or arrived at from sources believed reliable but no representation or warranty, express or implied, is made as to their accuracy or completeness. Neither Scotiabank nor any of its officers, directors, partners, employees or affiliates accepts any liability whatsoever for any direct or consequential loss arising from any use of this report or its contents.
These reports are provided to you for informational purposes only. This report is not, and is not constructed as, an offer to sell or solicitation of any offer to buy any financial instrument, nor shall this report be construed as an opinion as to whether you should enter into any swap or trading strategy involving a swap or any other transaction. The information contained in this report is not intended to be, and does not constitute, a recommendation of a swap or trading strategy involving a swap within the meaning of U.S. Commodity Futures Trading Commission Regulation 23.434 and Appendix A thereto. This material is not intended to be individually tailored to your needs or characteristics and should not be viewed as a “call to action” or suggestion that you enter into a swap or trading strategy involving a swap or any other transaction. Scotiabank may engage in transactions in a manner inconsistent with the views discussed this report and may have positions, or be in the process of acquiring or disposing of positions, referred to in this report.
Scotiabank, its affiliates and any of their respective officers, directors and employees may from time to time take positions in currencies, act as managers, co-managers or underwriters of a public offering or act as principals or agents, deal in, own or act as market makers or advisors, brokers or commercial and/or investment bankers in relation to securities or related derivatives. As a result of these actions, Scotiabank may receive remuneration. All Scotiabank products and services are subject to the terms of applicable agreements and local regulations. Officers, directors and employees of Scotiabank and its affiliates may serve as directors of corporations.
Any securities discussed in this report may not be suitable for all investors. Scotiabank recommends that investors independently evaluate any issuer and security discussed in this report, and consult with any advisors they deem necessary prior to making any investment.
This report and all information, opinions and conclusions contained in it are protected by copyright. This information may not be reproduced without the prior express written consent of Scotiabank.
™ Trademark of The Bank of Nova Scotia. Used under license, where applicable.
Scotiabank, together with “Global Banking and Markets”, is a marketing name for the global corporate and investment banking and capital markets businesses of The Bank of Nova Scotia and certain of its affiliates in the countries where they operate, including; Scotiabank Europe plc; Scotiabank (Ireland) Designated Activity Company; Scotiabank Inverlat S.A., Institución de Banca Múltiple, Grupo Financiero Scotiabank Inverlat, Scotia Inverlat Casa de Bolsa, S.A. de C.V., Grupo Financiero Scotiabank Inverlat, Scotia Inverlat Derivados S.A. de C.V. – all members of the Scotiabank group and authorized users of the Scotiabank mark. The Bank of Nova Scotia is incorporated in Canada with limited liability and is authorised and regulated by the Office of the Superintendent of Financial Institutions Canada. The Bank of Nova Scotia is authorized by the UK Prudential Regulation Authority and is subject to regulation by the UK Financial Conduct Authority and limited regulation by the UK Prudential Regulation Authority. Details about the extent of The Bank of Nova Scotia's regulation by the UK Prudential Regulation Authority are available from us on request. Scotiabank Europe plc is authorized by the UK Prudential Regulation Authority and regulated by the UK Financial Conduct Authority and the UK Prudential Regulation Authority.
Scotiabank Inverlat, S.A., Scotia Inverlat Casa de Bolsa, S.A. de C.V, Grupo Financiero Scotiabank Inverlat, and Scotia Inverlat Derivados, S.A. de C.V., are each authorized and regulated by the Mexican financial authorities.
Not all products and services are offered in all jurisdictions. Services described are available in jurisdictions where permitted by law.