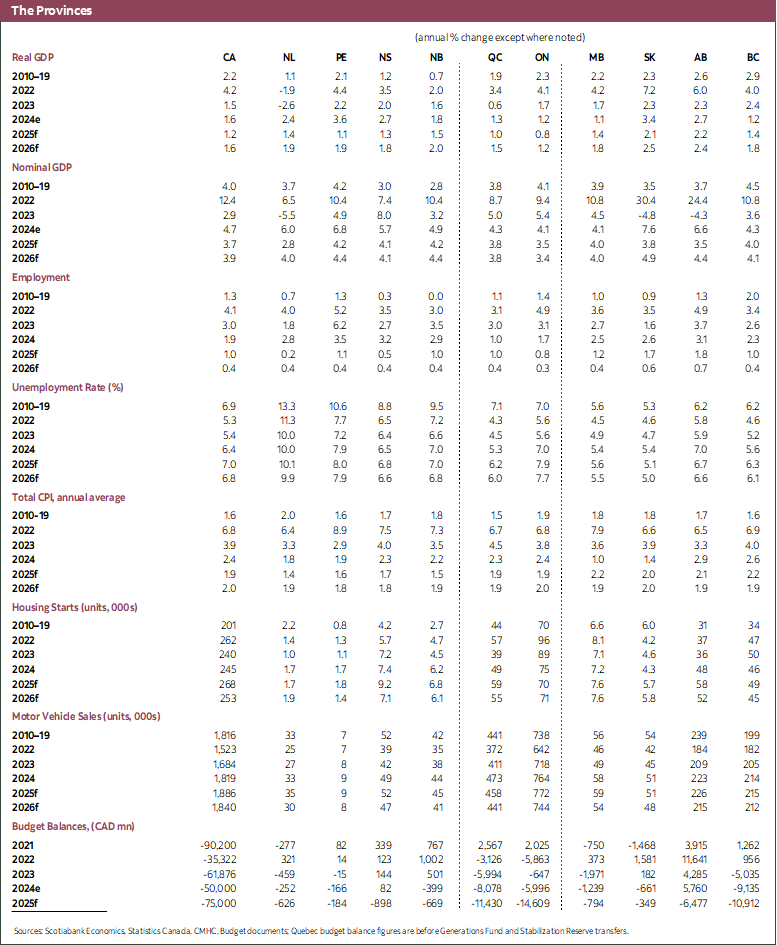
GROWTH CONTINUES TO SLOW AMID TRADE AND DEMOGRAPHIC HEADWINDS
HIGHLIGHTS
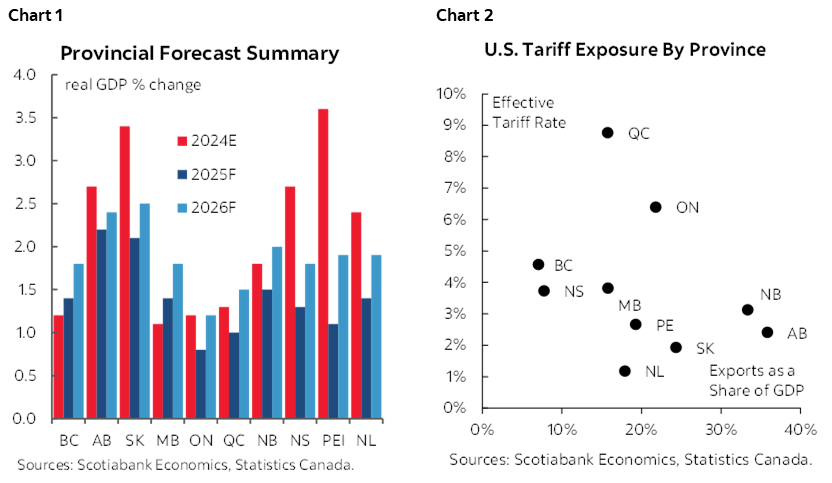
Most Canadian provinces are poised for slowdowns in 2025 (chart 1). A complex mix of trade dynamics, monetary policy responses, and demographic factors continue to weigh on growth. Although U.S. tariff rates have eased somewhat from initial levels, they remain a significant headwind, particularly for sectors with high exposure to international trade. The burden of these tariffs is not evenly distributed across the country—provinces with greater reliance on affected industries are facing more pronounced economic strain. Effective U.S. tariff rates vary, with manufacturing-heavy regions like Ontario and Quebec seeing higher impacts, while resource-based provinces such as Alberta and Saskatchewan are relatively less affected (chart 2). Economic uncertainty is somewhat lower than earlier this year, but remains elevated—dampening consumer confidence and business investment. In addition, the country is bracing for the review of CUSMA, which to date has significantly limited the impact of tariffs in most sectors. In response to softening economic and labour market data, the Bank of Canada cut its policy rate in September and we expect one more cut by the end of this year, which will provide some support to provincial economies. However, slowing population growth is simultaneously lowering underlying potential growth, and it will take some time for the positive impact of new major projects to feed through the economy.
HOUSEHOLD CONSUMPTION TO SOFTEN
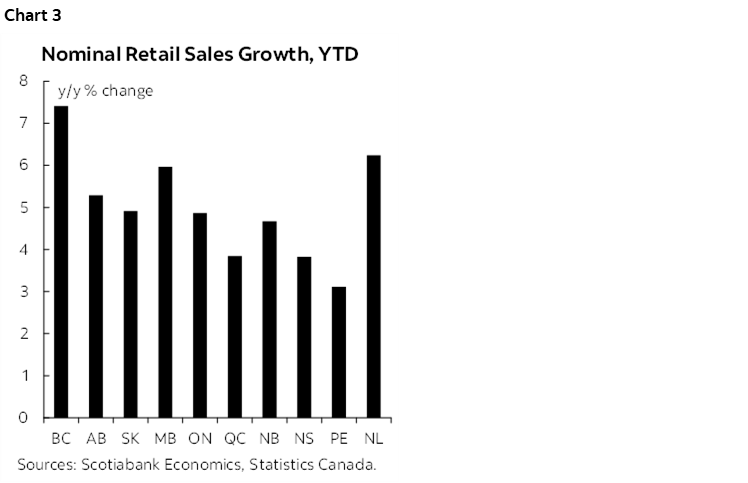
Household spending growth has been resilient so far. Consumer spending in Canada is being shaped by competing forces. The supportive effects of monetary policy easing are still working through the economy, with the Bank of Canada having lowered its policy rate from a peak of 5% beginning in June 2024. Given the typical 12–24 month lag in monetary transmission, some residual support for spending remains. This has helped household spending remain resilient through the first months of the tariff shock, with provincial retail sales up between 3% and 8% (in nominal terms) through July compared to the same period last year (chart 3). However, this has been largely driven by the growth in household consumption over the course of 2024, which has levelled off and been fairly stable since the start of 2025.
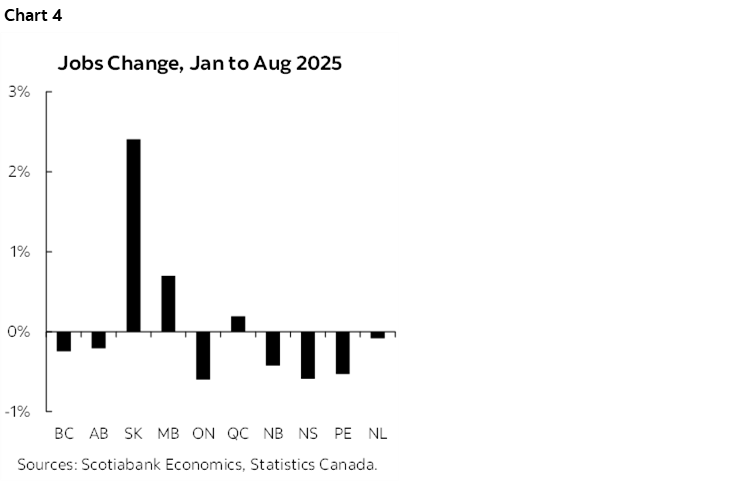
Deteriorating labour market conditions point to weaker household spending going forward. Unemployment has been trending higher since mid-2023, and the tariff and uncertainty shock has led to a further deterioration in the labour market—which seems to have accelerated over the summer. Across July and August, the Canadian economy shed 115,000 jobs, more than offsetting a surprisingly strong June employment report, and increasing the national unemployment rate to 7.1%. Seven provinces had fewer people working in August compared to January (chart 4), with trade-exposed Ontario seeing the largest decline of 0.6%, representing about 50,000 jobs lost. Nova Scotia and Prince Edward Island have also seen a similar percentage decline. However, a few provinces have been more resilient, especially Saskatchewan, where employment is up by about 2.5%. That said, some supply side dynamics muddle comparisons of job numbers across provinces, given variations in labour force growth, making the unemployment rate the best metric to watch. Overall, we expect weakness in the labour market to continue, though even weak job growth could start to outstrip population growth due to the slowdown in immigration, leading unemployment rates to fall in 2026. As the labour market continues to weaken, we expect household spending to follow suit. Indeed, monthly vehicle sales data for August—our first reading on household spending in the month—showed a significant drop.
INVESTMENT GROWTH HAS SLOWED
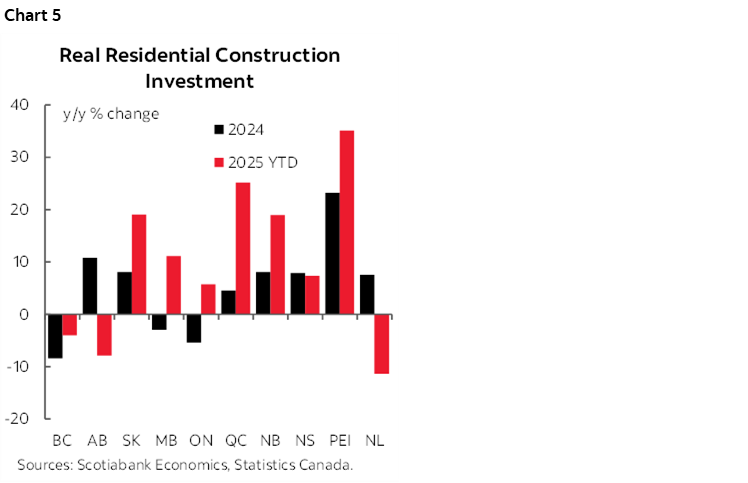
Housing markets are varied across the country. Sales of existing homes in most provinces slowed after the onset of the trade war and pause in the Bank of Canada’s interest rate cutting cycle in the Spring, especially the most expensive markets of British Columbia and Ontario, but are picking back up. Residential investment has contributed positively to growth through the first eight months of the year in most provinces, but has dragged in British Columbia, Alberta, and Newfoundland and Labrador (chart 5). In addition, housing starts through August are lower compared to a year ago in Manitoba, Ontario, and Newfoundland and Labrador, which is likely to result in residential investment drag in these provinces going forward. In contrast, residential investment and housing starts are up strongly in some provinces, especially Saskatchewan and Prince Edward Island, and the Bank of Canada’s September interest rate cut will support the housing sector across the country by reducing borrowing costs. That said, lower immigration will reduce some demand for housing, especially in the largest cities, which have long seen more than their fair share of newcomers to Canada.
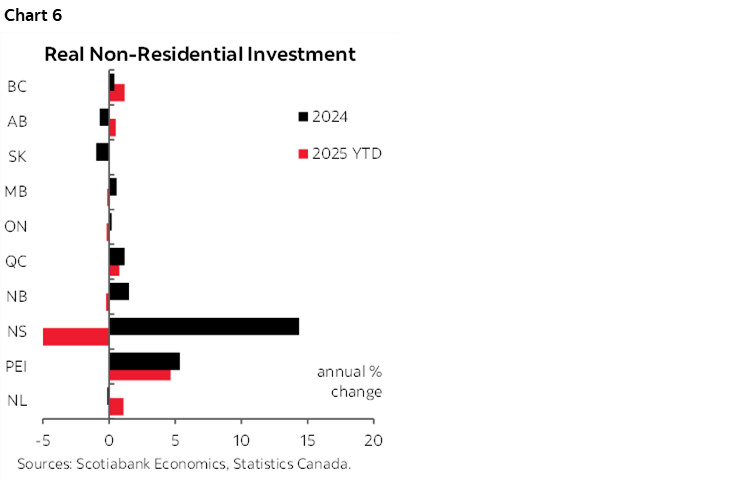
Non-residential investment remains subdued. Canada’s recent track record of weak business investment continues. All provinces appear to have recorded modestly negative growth in business investment last year, and all are flat or modestly negative again through the first half of this year. However, in some provinces, public investment has helped to offset the weakness in private investment—especially Nova Scotia and Prince Edward Island, which saw overall non-residential investment gains of roughly 15% and 5%, respectively, in 2024. Through the first half of this year, positive public investment growth has helped most provinces see a gain in overall non-residential investment over the same period last year, with the exception of Nova Scotia—which had an extremely strong 2024 (chart 6). We expect business investment to continue to be negatively impacted by the ongoing tariffs and uncertainty, but growing public investment helping to offset this. The medium-term outlook is more promising, given the numerous major projects in the pipeline, and the federal government’s efforts to significantly shorten major project approvals and see additional significant projects being added.
EXPORTS WEAKENING AS FRONTRUNNING FADES
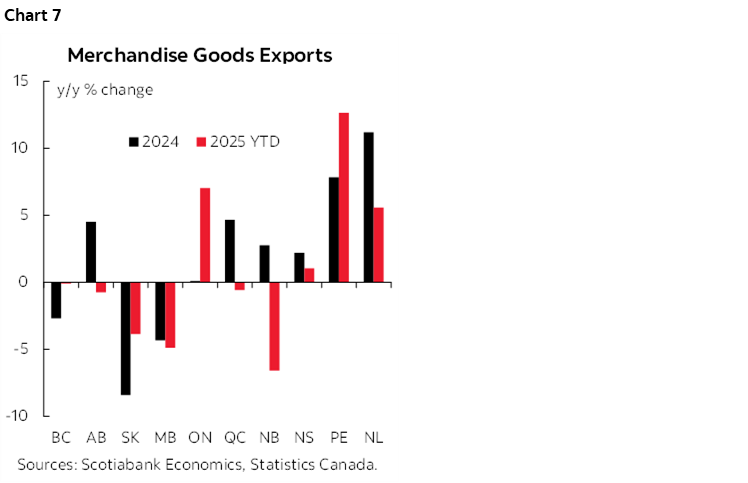
Strong export growth in Q1 is unwinding. Canadian exports were elevated in Q1, as American firms brought in extra products ahead of tariffs coming into effect, which boosted Canadian growth to start the year. The unwinding of this impact has been evident in the export data since then, which has been considerably lower. Some provinces’ exports are actually up year-over-year through July (chart 7), due to tariff front-running in early 2025. However, we expect exports to clearly weigh on growth for the year overall given the negative impacts of ongoing tariffs. While the frequency of U.S. tariff announcements has slowed relative to the spring and summer, the trade environment is ever-evolving—as evidenced by the September 25th announcement of new U.S. tariffs on pharmaceuticals and other goods.
Chinese tariffs are also having impacts. While the most of the focus in Canada has been on the U.S. trade war, China’s 25% tariffs on seafood and even larger tariffs on canola products are also having impacts in some parts of Canada, especially Atlantic Canada and the Prairies. However, to date the impact of the Chinese tariffs seems relatively muted, as exports and prices of affected goods appear to have remained fairly stable.
DEMOGRAPHIC HEADWINDS
The provinces’ longer-term growth prospects are strongly influenced by demographic factors. A pullback in permanent resident admissions, along with a sizeable contraction in non-permanent residents, is materially slowing population and labour force growth across Canada (chart 8). As a result of the changes in immigration policy, there has been very limited population growth so far in 2025.
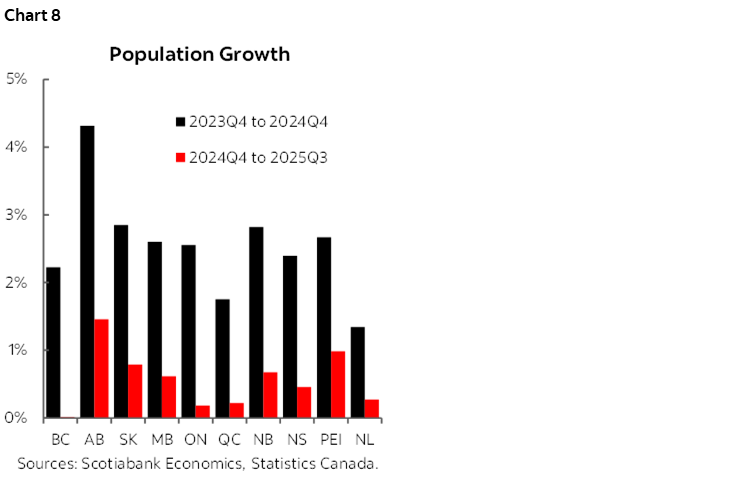
The drop in non-permanent residents is another key factor in shaping the differing outlooks of the provinces. We expected that Ontario and B.C. would feel the most pronounced effects of the changed federal government immigration policies, due to their high numbers of international students, and they have indeed seen among the weakest population growth so far this year. However, all provinces are facing significant slowdowns, which will weigh on potential growth in each province.
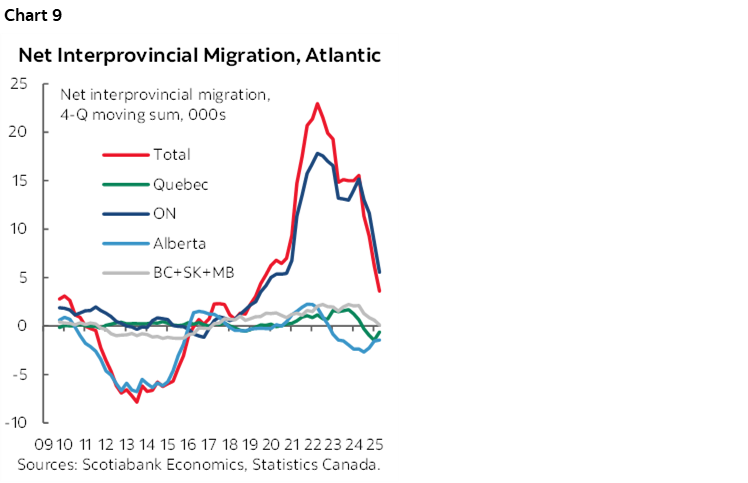
Interprovincial migration remains an additional challenge for the Atlantic provinces. While the flow of Ontarians moving East—a trend that began before the pandemic—continues, it is slowing quickly. In addition, these provinces are now experiencing a net loss of residents to Alberta and Quebec, and neutral flows from other provinces (chart 9). These trends are expected to persist, and as the movement of Ontarians to the Atlantic provinces continues to slow, this region may face stagnant or even negative net interprovincial migration. This, alongside the slowdown in international migration, will weigh on growth prospects in Atlantic Canada.
BRITISH COLUMBIA
Despite the tariff shock, consumer spending has continued to grow steadily so far this year, and the continued interest rate easing should support further consumer spending growth. Home sales in the expensive B.C. housing market fell at the beginning of the tariff war, but have started to bounce back over the summer as uncertainty has fallen from the spring peak.
B.C.’s unemployment rate has risen slightly over the course of the year, but less so than in many other provinces, and is about a percentage point below the national average. The province saw job losses of over 15k in July and August, though these did not seem to be driven by trade-exposed sectors. Instead, the losses were concentrated in the education, health care, and information, culture and recreation sectors. The province has seen a net gain in jobs in goods-producing sectors since the start of the tariff war. This, along with stable exports so far this year, indicate that the province’s less U.S. export-oriented economy is helping it remain fairly resilient through the trade shock. In addition, the Kitimat LNG had its first full month of operations in July, which will support growth in the second half of the year and beyond.
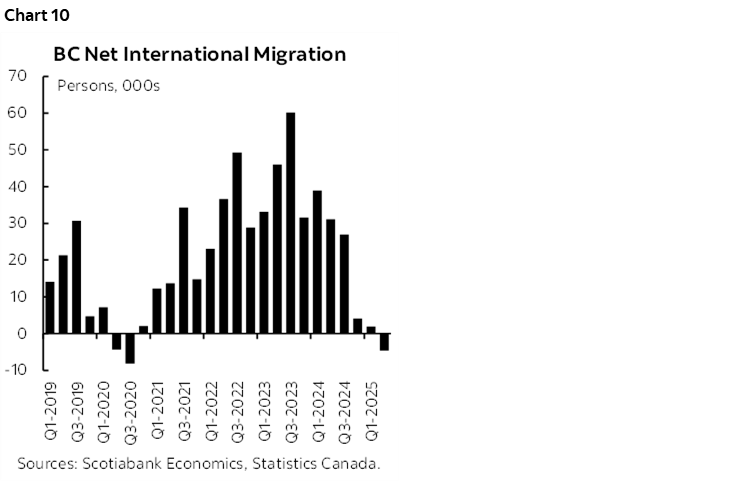
While B.C. diversified export base helps mitigate to some extent the impacts of the U.S. trade war, it is facing perhaps the strongest demographic headwinds of any province. The province has the highest share of non-permanent residents, and has seen its immigration inflows drop and its outflows increase, resulting in a drop in net international migration similar to that at the beginning of the pandemic (chart 10). These demographic headwinds will weigh on growth in the province, including through limiting demand for new housing over the medium-term. Housing starts in B.C. have been fairly flat over the past ten years, and residential construction is on track to drag on overall growth again in 2025. However, the provincial government is increasing public capital spending, which will mitigate some of the continued weakness in housing construction. Business investment is down slightly to start the year, but we expect this to pick up, especially given that B.C. has two of the first projects under consideration by the new federal Major Projects Office, including the next phase of the Kitimat LNG facility.
Overall, we expect growth of 1.4% in 2025 and 1.8% in 2026, slightly overperforming the national average in both years.
ALBERTA
Alberta had the third-highest rate of growth among the provinces in 2024, as the province continued to benefit from its natural resources as well as population gains—which were driven by both international and interprovincial migration.
So far in 2025, Alberta continues to demonstrate stronger-than-average growth. Household consumption has soften somewhat since the tariff war started but remains solid, housing starts have continued to grow at a good clip, and non-residential investment has remained solid. Goods exports have fallen somewhat since the beginning of the year, but remain in line with the volumes seen over the last couple of years. The unemployment rate has increased and employment is down slightly since the tariff war started, but hours worked are up over 2% so far this year.
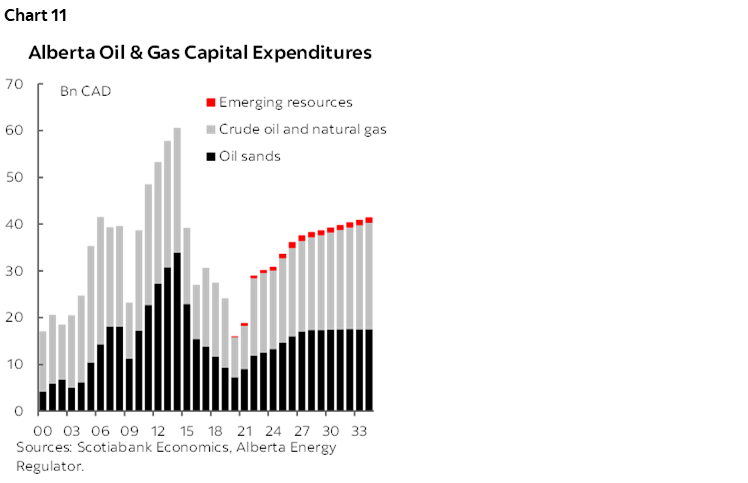
We expect the province’s economy to grow by 2.2% in 2025 and 2.4% in 2026—at or near the top of the provincial growth ranking in both years. While population growth is lower, the province continues to see the highest rate of population growth, which will reinforce its demographic advantage. In addition, while exports to the U.S. represents a large share of Alberta’s GDP, much of this is energy products, which have a lower tariff rate and are not easily substituted in the near-term. As a result, oil production has remained steady, and should continue to support solid growth in the province—with an added boost from the operationalization of Trans Mountain pipeline expansion. In addition, investment in the oil & gas sector is projected to remain solid (chart 11), and could be boosted further by the federal government’s efforts to see new major projects, including in the energy sector.
SASKATCHEWAN
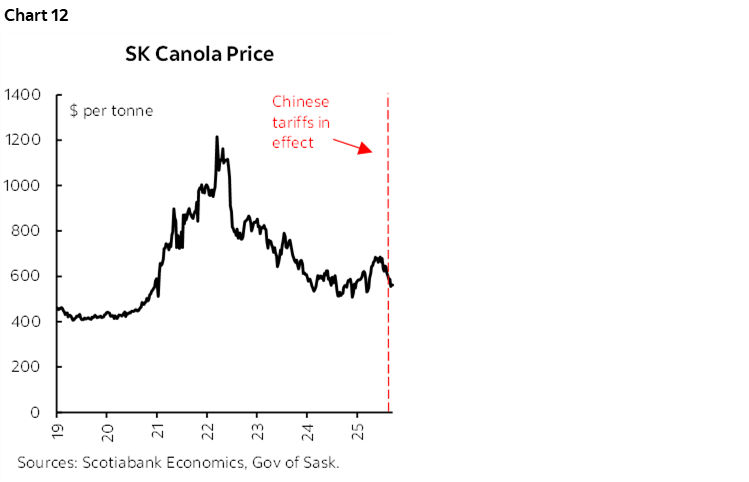
Saskatchewan’s economy grew at the second-fastest rate among the provinces in 2024, driven by strong household consumption and robust investment in the mining sector. These factors continue, and are being further supported by a pick-up in housing starts which has resulted in residential investment increasing by more than 20% through the first seven months of the year. While China’s high tariffs on canola products represent a significant potential headwind to Saskatchewan’s agriculture sector, so far canola prices have not had a significant reaction (chart 12), helping mute the impacts of these tariffs so far.
The province’s labour market continues to demonstrate the underlying strength in the Saskatchewan economy, with only one month of job losses since the onset of the tariff war, and an unemployment rate that has fallen by 0.7 percentage points from January to August to 4.7%—the lowest rate in the country by a full percentage point.
While population and labour force growth has slowed, it remains positive, helping Saskatchewan maintain above-average potential growth. In addition, strong business investment is likely to continue, due to the ongoing construction of the world’s biggest potash mine through 2029, and the potential addition of the Foran Copper Mine—which is one of the five first projects under consideration by the Major Projects Office.
Overall, we expect the Saskatchewan economy to grow 2.1% this year and 2.5% next year—at or near the top of the provincial growth ranking in both years.
MANITOBA
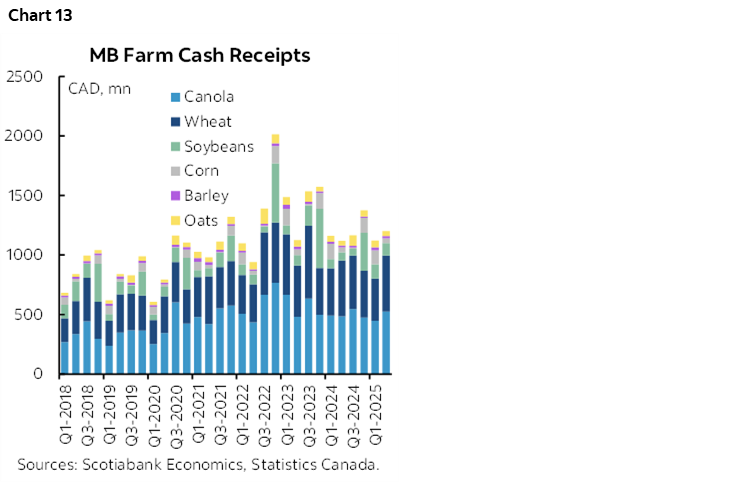
Manitoba’s economy grew slightly below the national average in 2024, with growth driven entirely by services industries as elevated interest rates weighed on the goods-component of the economy. So far in 2025, economic indicators suggest that Manitoba is growing at a pace at least in line with the national average. Retail sales are up 6% year-to-date through July, home sales are up 13%, and residential investment is up 11%. However, non-residential investment and exports are down somewhat. In addition, the province’s largest export category, agriculture products, has been steady (chart 13), but there have been declines in a number of other sectors, including consumer goods, energy products, industrial machinery.
The province is one of three that has seen a net gain in jobs since the tariff war started, and while the unemployment rate has continued the climb higher that it started in 2022, it has not climbed as much as the national average. The province boasts Canada’s second-lowest unemployment rate at 5.7%.
We expect growth in the Manitoba economy of 1.4% this year and 1.8% next year—slightly higher than the national average for both years. Population growth is lower but remains positive, and the province’s diversified export base should help mitigate some of the impacts of the tariffs.
ONTARIO
Ontario’s economy grew slightly below the national average in 2024, as growth in services industries was partially offset by contractions in manufacturing and construction activity, which had been weighed down by previously elevated interest rates.
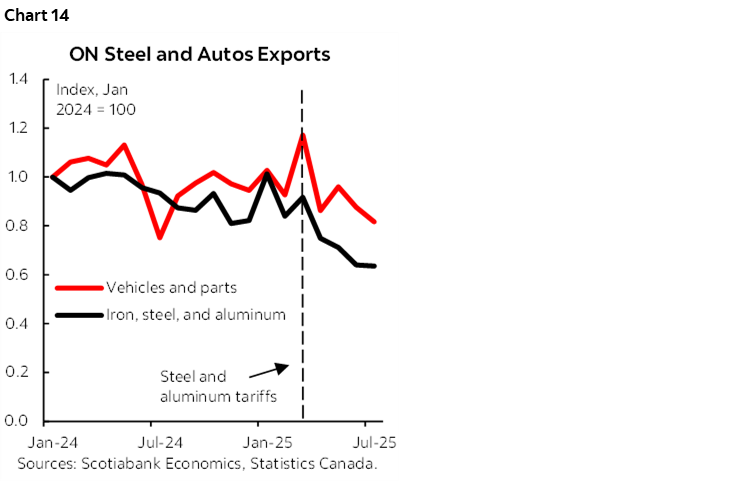
So far in 2025, retail sales have been fairly stable despite the tariff and uncertainty shock, and housing sales are rebounding after a slowdown in the Spring. Housing starts remain low but have ticked up since March. Non-residential investment has softened slightly since the start of the year, but is up 6% year-to-date. Exports of steel & aluminum and autos & auto parts have seen accelerations in their longer-term declines since the tariffs came into effect (chart 14). Exports of these goods represented 31% of Ontario’s total merchandise exports last year. Due to weak exports in the first half of 2024 and front-running of the tariffs in early 2025, Ontario’s exports were actually up 5% YTD through July, but we expect the clear downward momentum over the course of this year to continue.
The province has lost nearly 50k jobs since January, a decline of about 0.6%—the largest impact in the country. The jobs losses have been across many sectors, including manufacturing, agriculture, education. In addition, hours worked are down 0.8% through the first eight months of the year. The unemployment rate has not increased much, though this is in the context of a rapid slowdown in population growth; the Ontario labour force has contracted since the beginning of the year, though remains somewhat larger than the same period last year.
The weakness in the labour market is likely to lead to weaker consumer spending going forward, and the province’s close ties with the U.S. economy will weigh on business investment. Overall, we expect real GDP growth in Ontario of 0.8% in 2025 and 1.2% in 2026—somewhat underperforming the national average in both years.
QUEBEC
Quebec’s economy also grew slightly below the national average in 2024. Previously elevated interest rates contributed to contractions in manufacturing and utilities, which were partially offset by improvements in construction, crop production, and metal mining activity. Over the course of last year, declining interest rates supported a recovery in consumer spending, which has remained stable even since the onset of the tariff war. The housing market has similarly shaken off the tariff and uncertainty shock; home sales saw only a modest softening in March, and housing starts have continued their rise since 2023. Residential investment is up 23% over last year through August. However, the decline in business investment that pre-dated the tariff shock has accelerated somewhat, and exports are modestly down through July.
The labour market has been more resilient than we expected, given Quebec’s close trading links with the U.S. economy and the size of its aluminum sector—a key target of the U.S. sectoral tariffs. The province is one of only three that has not seen a net decline in employment since January. The unemployment rate has risen further since the beginning of the year, though at the same pace as the Canadian average.
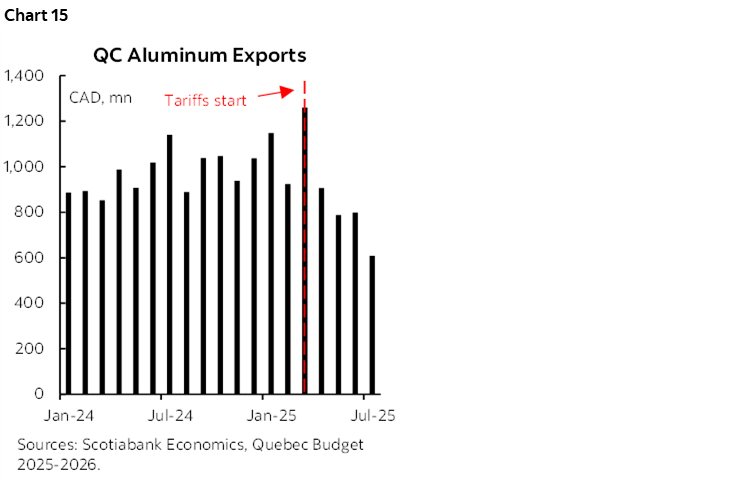
In addition to the growing impacts of slowing labour force growth due to immigration changes, we expect the U.S. tariffs to increasingly weigh on the Quebec economy—especially the steel & aluminum sector. Quebec’s exports of aluminum, which represented 10% of the province’s total exports last year, have fallen by about 40% between December and August—though tariff front-running provided a temporary boost in March (chart 15). We expect the U.S. tariffs on steel & aluminum imports will continue to drag on Quebec’s exports of these metals as long as the tariffs are in place.
Overall, we see Quebec underperforming the national average this year and next, with growth of 1.0% in 2025 and 1.5% in 2026.
MARITIME PROVINCES
All three of the Maritime provinces grew faster than the national average in 2024, with PEI recording the top growth rate of any Canadian province. The services sector was the primary driver of growth across the three provinces, aided by strength in the construction and manufacturing sectors.
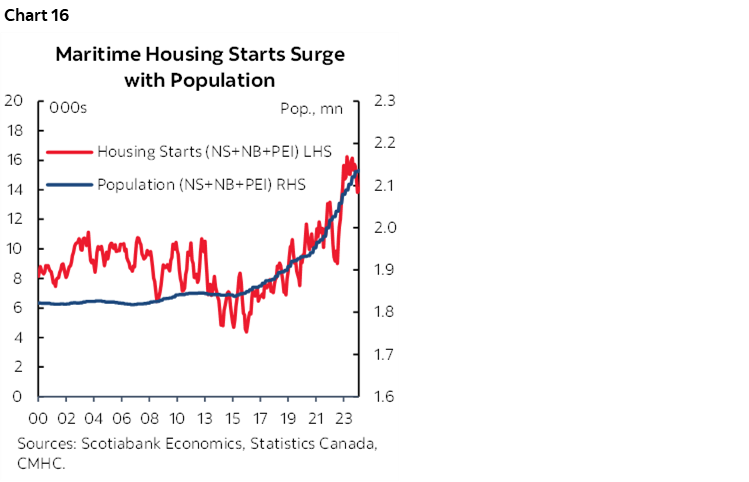
Retail sales growth across the Maritimes has fallen below the national average so far in 2025. In addition, all three Maritime provinces have seen employment contract by about 0.5% since the U.S. tariff war started, though their unemployment rates have been fairly steady in the context of sharply slowing labour force growth. However, weakness on the consumer side has been offset to some extent by strong growth in both residential and non-residential investment. On the residential side, housing construction investment and new housing starts continue to grow strongly, as the 2015–2024 population growth continues to drive a housing boom (chart 16). On the non-residential side, business investment has remained stable through the tariff and uncertainty shock, and public sector investment continues to increase.
The Maritimes are less exposed to trade risk than some other provinces, due to their lower export shares. However, slowing consumer spending and a sharp slowdown in labour force growth will weigh on the overall growth rate. We expect growth in the Maritime provinces to slow from their 2024 growth rates, but remain slightly higher than the national average in 2025 and 2026.
NEWFOUNDLAND AND LABRADOR
Newfoundland and Labrador’s economy rebounded strong in 2024 after having contracted the prior two years. Growth was supported by the province’s natural resources, notably through increased oil & gas as well as mining activity. Population growth and job gains, along with declining interest rates, fueled a rise in consumer spending.
So far in 2025, consumer spending has remained strong and export growth has remained positive, but investment has decreased in the wake of the U.S. trade war. Employment is down modestly, with the unemployment rate broadly unchanged.
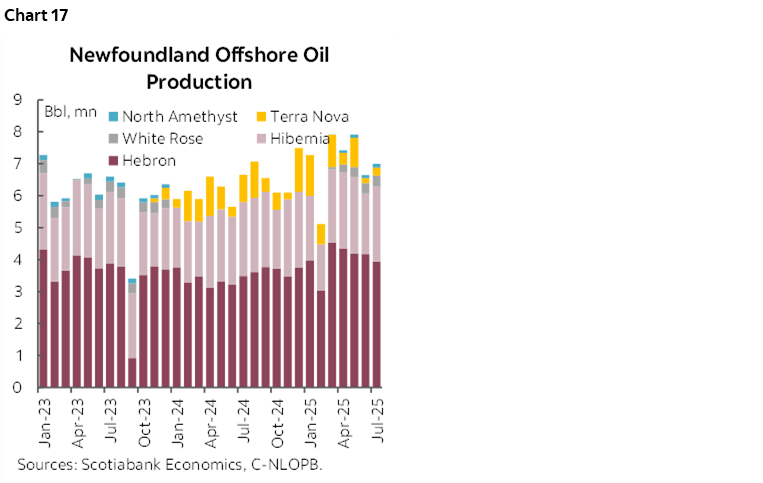
Oil production has continued to trend higher through the early months of the U.S. trade war (chart 17). While oil production is expected to eventually taper off as fields reach the end of their lifespans, the planned hydroelectricity capital projects at Churchill Falls and other sites will help to mitigate a slowdown in oil & gas and provide an important new source of growth in the provincial economy.
We expect the province to slightly overperform the national average in both this year and next, with growth of 1.4% in 2025 and 1.9% in 2026.
DISCLAIMER
This report has been prepared by Scotiabank Economics as a resource for the clients of Scotiabank. Opinions, estimates and projections contained herein are our own as of the date hereof and are subject to change without notice. The information and opinions contained herein have been compiled or arrived at from sources believed reliable but no representation or warranty, express or implied, is made as to their accuracy or completeness. Neither Scotiabank nor any of its officers, directors, partners, employees or affiliates accepts any liability whatsoever for any direct or consequential loss arising from any use of this report or its contents.
These reports are provided to you for informational purposes only. This report is not, and is not constructed as, an offer to sell or solicitation of any offer to buy any financial instrument, nor shall this report be construed as an opinion as to whether you should enter into any swap or trading strategy involving a swap or any other transaction. The information contained in this report is not intended to be, and does not constitute, a recommendation of a swap or trading strategy involving a swap within the meaning of U.S. Commodity Futures Trading Commission Regulation 23.434 and Appendix A thereto. This material is not intended to be individually tailored to your needs or characteristics and should not be viewed as a “call to action” or suggestion that you enter into a swap or trading strategy involving a swap or any other transaction. Scotiabank may engage in transactions in a manner inconsistent with the views discussed this report and may have positions, or be in the process of acquiring or disposing of positions, referred to in this report.
Scotiabank, its affiliates and any of their respective officers, directors and employees may from time to time take positions in currencies, act as managers, co-managers or underwriters of a public offering or act as principals or agents, deal in, own or act as market makers or advisors, brokers or commercial and/or investment bankers in relation to securities or related derivatives. As a result of these actions, Scotiabank may receive remuneration. All Scotiabank products and services are subject to the terms of applicable agreements and local regulations. Officers, directors and employees of Scotiabank and its affiliates may serve as directors of corporations.
Any securities discussed in this report may not be suitable for all investors. Scotiabank recommends that investors independently evaluate any issuer and security discussed in this report, and consult with any advisors they deem necessary prior to making any investment.
This report and all information, opinions and conclusions contained in it are protected by copyright. This information may not be reproduced without the prior express written consent of Scotiabank.
™ Trademark of The Bank of Nova Scotia. Used under license, where applicable.
Scotiabank, together with “Global Banking and Markets”, is a marketing name for the global corporate and investment banking and capital markets businesses of The Bank of Nova Scotia and certain of its affiliates in the countries where they operate, including; Scotiabank Europe plc; Scotiabank (Ireland) Designated Activity Company; Scotiabank Inverlat S.A., Institución de Banca Múltiple, Grupo Financiero Scotiabank Inverlat, Scotia Inverlat Casa de Bolsa, S.A. de C.V., Grupo Financiero Scotiabank Inverlat, Scotia Inverlat Derivados S.A. de C.V. – all members of the Scotiabank group and authorized users of the Scotiabank mark. The Bank of Nova Scotia is incorporated in Canada with limited liability and is authorised and regulated by the Office of the Superintendent of Financial Institutions Canada. The Bank of Nova Scotia is authorized by the UK Prudential Regulation Authority and is subject to regulation by the UK Financial Conduct Authority and limited regulation by the UK Prudential Regulation Authority. Details about the extent of The Bank of Nova Scotia's regulation by the UK Prudential Regulation Authority are available from us on request. Scotiabank Europe plc is authorized by the UK Prudential Regulation Authority and regulated by the UK Financial Conduct Authority and the UK Prudential Regulation Authority.
Scotiabank Inverlat, S.A., Scotia Inverlat Casa de Bolsa, S.A. de C.V, Grupo Financiero Scotiabank Inverlat, and Scotia Inverlat Derivados, S.A. de C.V., are each authorized and regulated by the Mexican financial authorities.
Not all products and services are offered in all jurisdictions. Services described are available in jurisdictions where permitted by law.