

HIGHLIGHTS
- Mexico’s calendar has the most on offer in Latam next week, with retail sales, H1-Oct CPI (also due in Brazil), unemployment, and economic activity data on tap between Wednesday and Friday.
- Headline inflation expected to pick up to 3.6–3.7% y/y, economic activity likely remaining above 3% y/y, MXN weakness, and the Fed’s hiking cycle are at odds with Banxico’s minutes showing that three of the five board members are leaning toward possible cuts.
- In today’s report, the team in Mexico goes over tourism data, with the sector posting only moderate growth in international arrivals year-to-date. Mexico received 4% more tourists in Jan–Aug 2026 than it did over the same period in 2025, but this compares to 7.5% y/y growth twelve months prior.
Chart of the Week
MEXICAN ECONOMIC ACTIVITY, MID-MONTH CPIs
Juan Manuel Herrera, Director
+52.55.2299.6675
juanmanuel.herrera@scotiabank.com
- Mexico’s calendar has the most on offer in Latam next week, with retail sales, H1-Oct CPI (also due in Brazil), unemployment, and economic activity data on tap between Wednesday and Friday.
- Headline inflation expected to pick up to 3.6–3.7% y/y, economic activity likely remaining above 3% y/y, MXN weakness, and the Fed’s hiking cycle are at odds with Banxico’s minutes showing that three of the five board members are leaning toward possible cuts.
- In today’s report, the team in Mexico goes over tourism data, with the sector posting only moderate growth in international arrivals year-to-date. Mexico received 4% more tourists in Jan–Aug 2026 than it did over the same period in 2025, but this compares to 7.5% y/y growth twelve months prior.
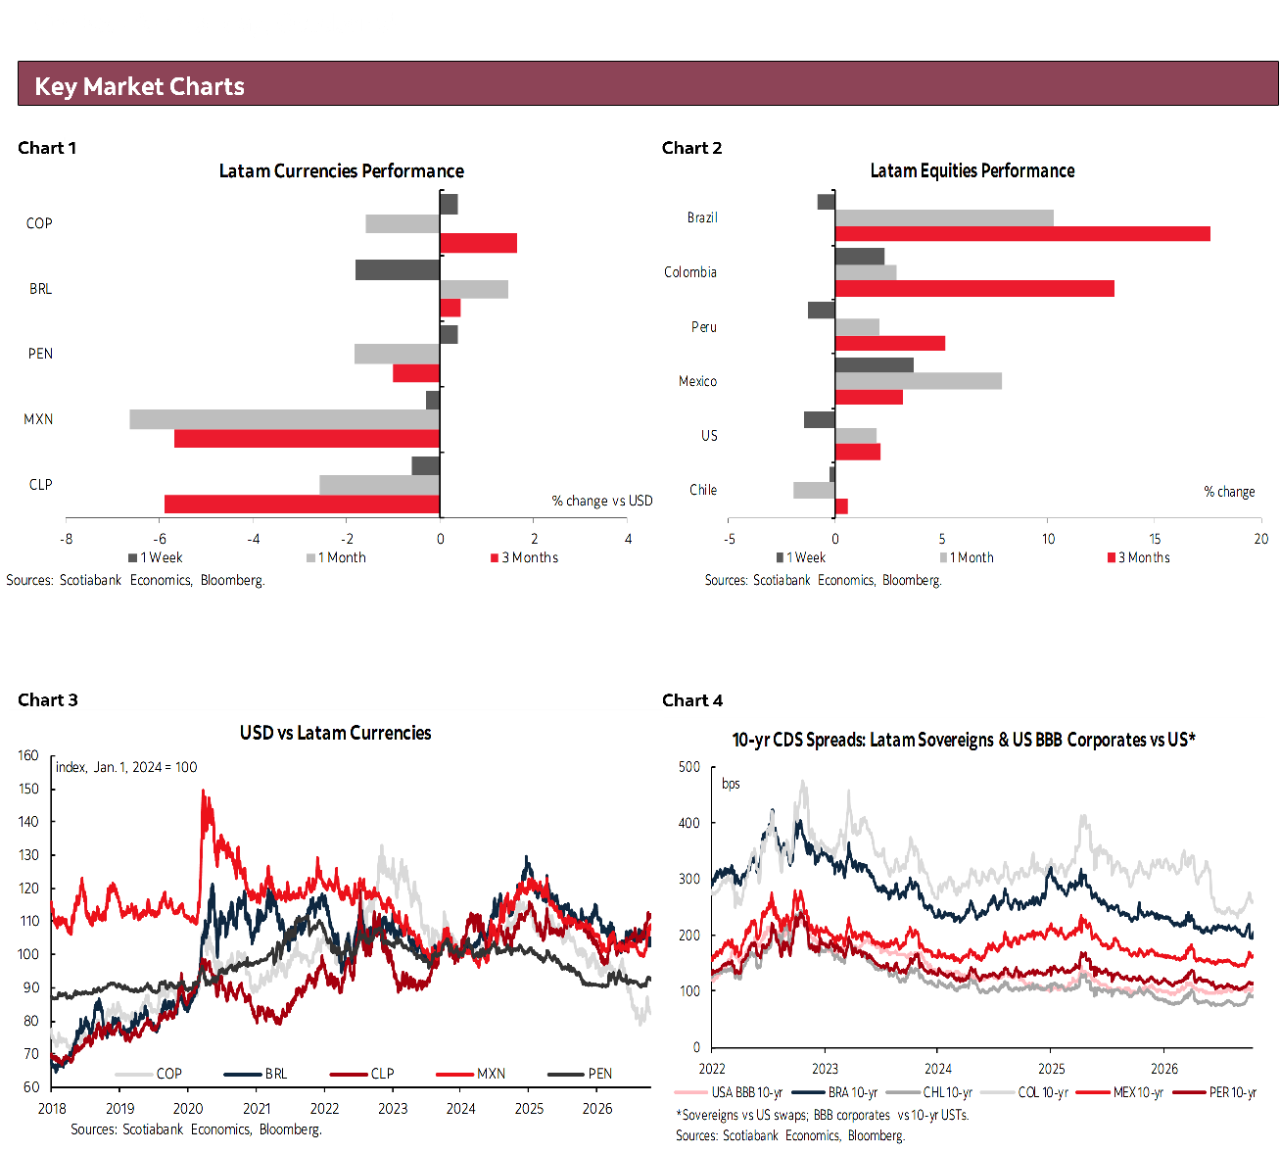
Jittery global markets have a quieter economic week ahead to brace for the next round of central bank decisions starting in late-October. Q3 earnings results from key companies like Meta and Tesla, Chinese GDP, U.K. and Canadian macro releases, and global PMIs at the close of the week are the ex-Latam calendar highlights. Tech sector sentiment and energy market developments should remain important shot-callers for trading next week, with the S&P 500’s ~2% loss since Friday marking the index’s worst weekly showing in two months—though, of course, after reaching an all-time high ten days ago.
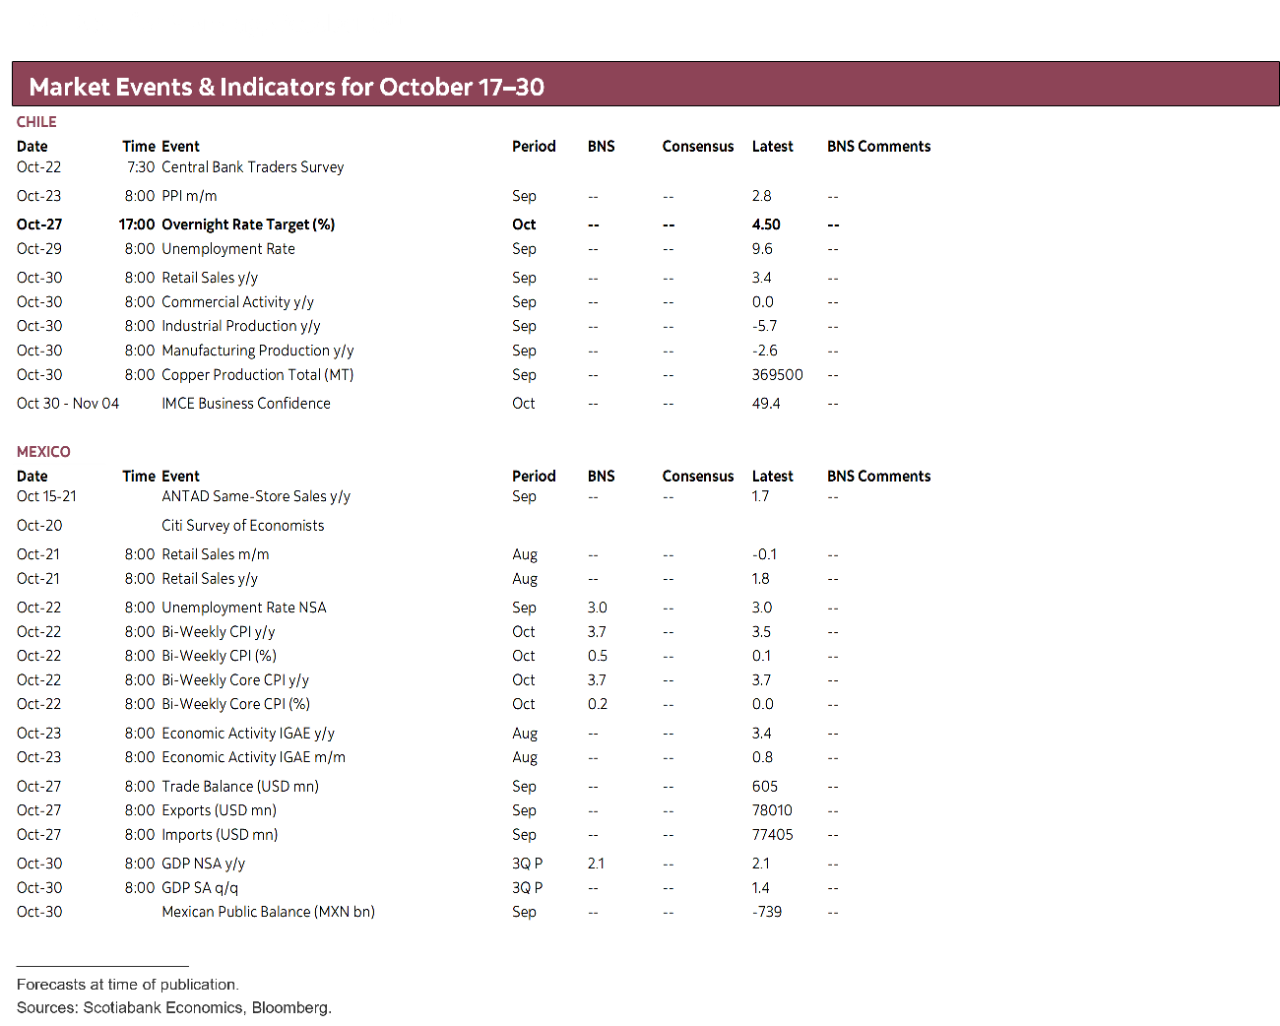
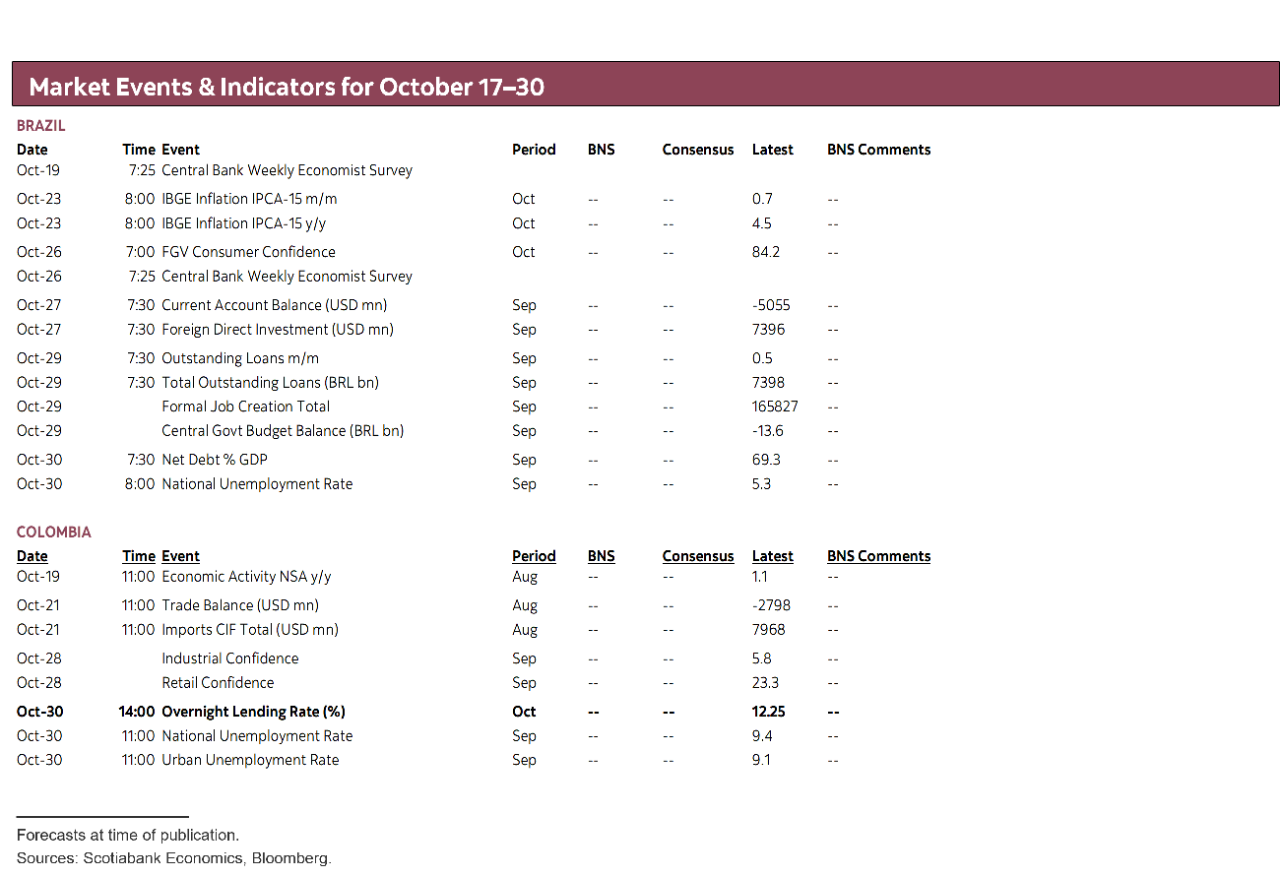
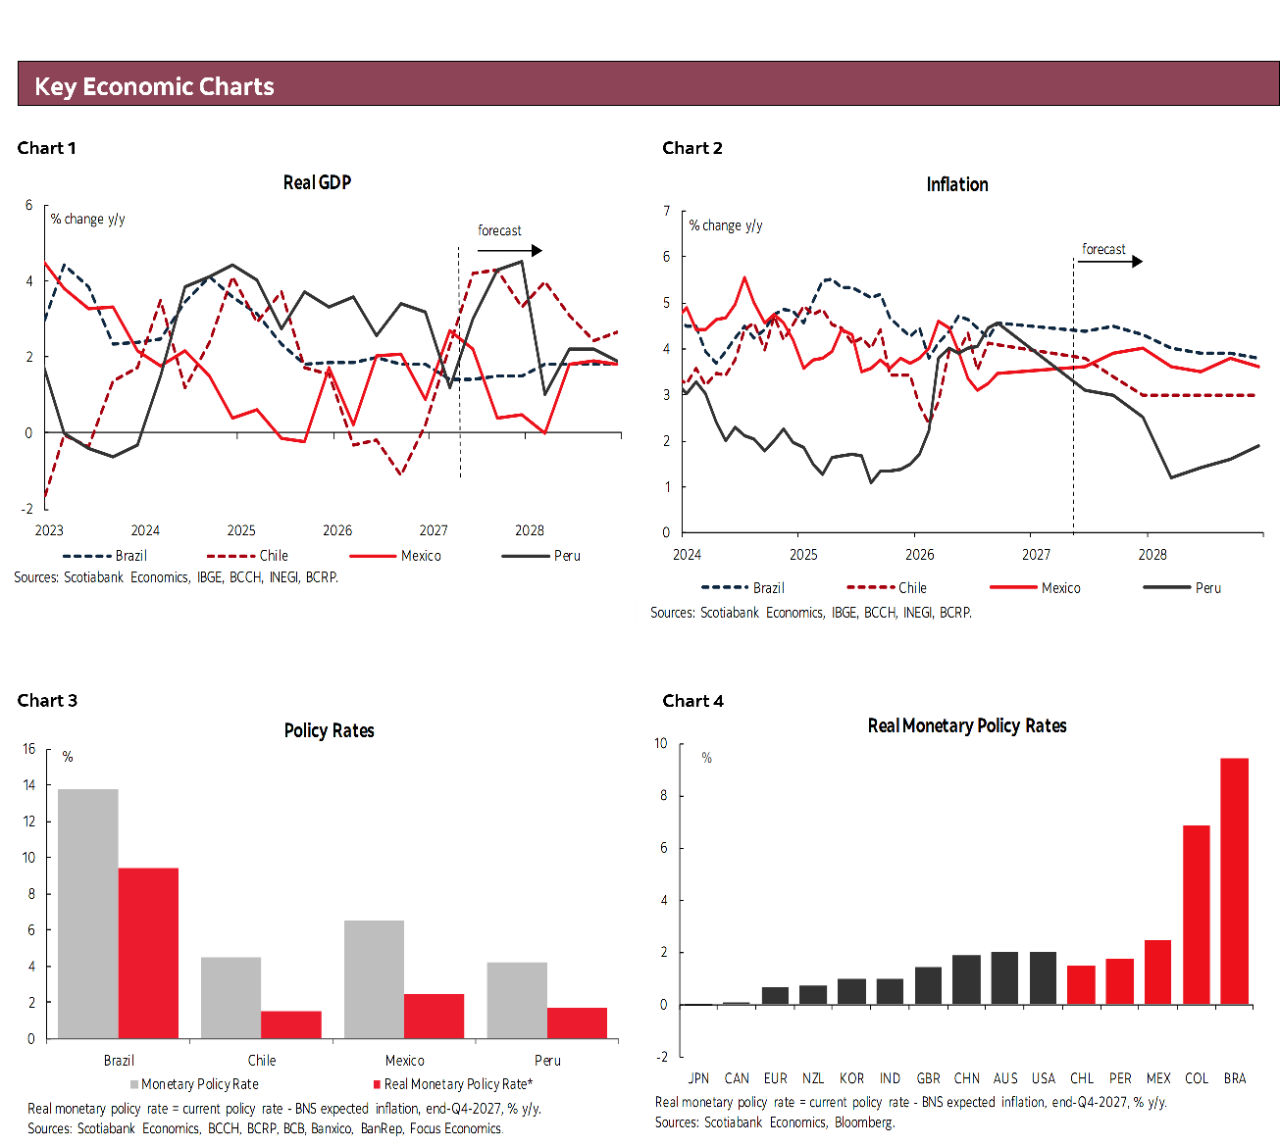
Mexico’s calendar has the most on offer in Latam next week, with retail sales, mid-month CPI, unemployment, and economic activity data on tap between Wednesday and Friday. Brazil will also publish mid-October CPI data on Friday which is expected to accelerate to 4.7–4.8% from 4.5% but has little else of note during the week and local markets look more likely to take their cue from presidential election polls and global market sentiment. Polls published over the last week mostly show Bolsonaro about 1–2ppts above Lula—within the margin of error. Colombia publishes economic activity figures, Chile has but PPI and the BCCh’s traders survey, and Peru’s calendar is bare of notable releases.
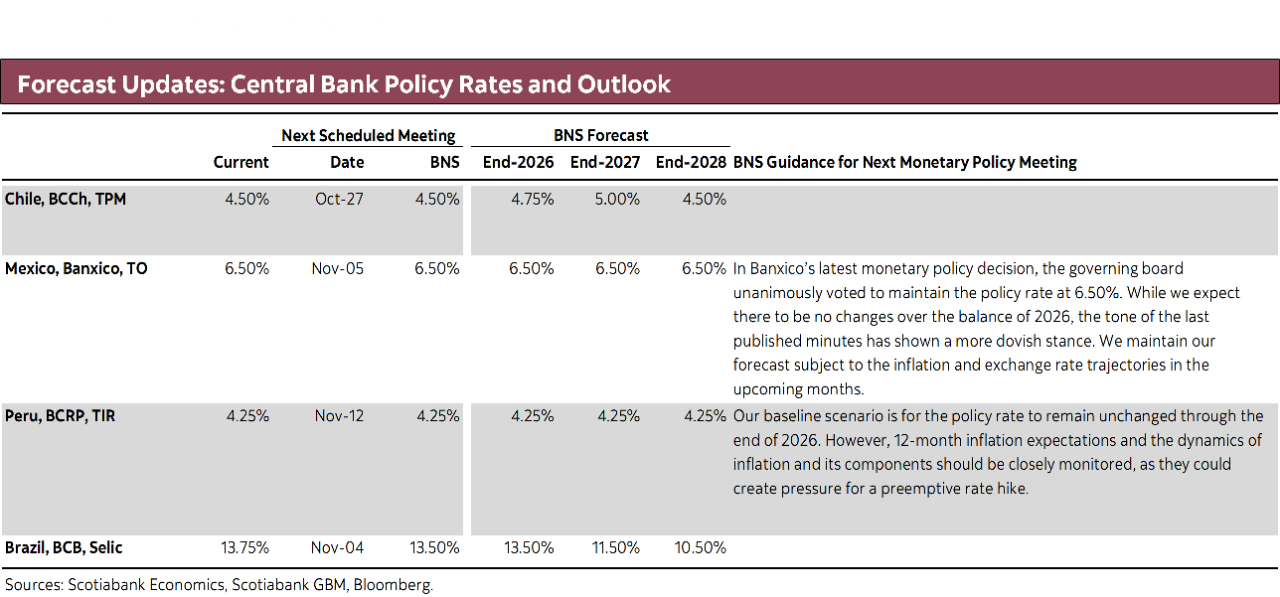
Next week’s data out of Mexico could add to the feeling that Banxico’s dovishness is misplaced. Stronger than expected economic growth and stubborn inflation alongside a growing divergence vis-à-vis the Fed’s policy path future that is weighing on the Mexican peso is at odds with the central bank’s nod to possible additional rate cuts in the near-term. Not only did Banxico’s latest decision make a point to separate its rate decisions from the Fed’s, but the minutes to the meeting showed that three of five board members floated that an additional adjustment may be evaluated, appropriate, or worthy of discussion in the near term.
On Thursday, we get H1-Oct CPI data that is expected to show an acceleration in headline inflation from 3.5% to 3.6–3.7%, though with core inflation expected to hold at 3.7%. As recently as H1-Jul, headline inflation sat at 3.1% y/y as a sharp increase in fruit and vegetable prices earlier in the year—which took headline inflation to as high as 4.7% y/y in H1-Mar—then normalized. Fruit and vegetable prices are again on the ascent, however, printing a 9.7% y/y reading in H2-Sep, which combined with steeper energy and government-approved prices means non-core inflation has accelerated from 0.2% y/y in H1-Jul to 2.8% as of the H2-Sep record.
It would be unfair to mention that core inflation has continued its downtrend since around the start of the year, coming in at 3.7% in H2-Sep, thus just shy of the post-pandemic low of 3.56% in March of last year. Services inflation is at its lowest in the post-pandemic period, but it’s difficult to spin that a 4.2% y/y reading here is a positive story, it being above the 2–4% target band and only slowly moving towards the upper bound. There’s also the fact that a drop in recreation inflation from 0.8% in H1-Sep to -0.7% y/y H2-Sep due to internet and TV packages prices is not the most broad-based driver of disinflation.
With high headline inflation that we expect to close the year at 3.8% and the continuation of well-above inflation double-digit minimum wage increases it’s tough to see a situation where core services inflation can move decently within the 2–4% headline inflation target range, nor see overall core inflation reach Banxico’s end-2027 forecast of 3%; this also gets tougher if the MXN continues to depreciate on rate differentials. For reference, the Citi economists survey median (with an update due Tuesday) expects core inflation to close next year at 3.8%.
On Friday, INEGI publishes August economic activity (IGAE) data which will likely show another ~3% expansion in output. Coming off a 3.4% y/y non-seasonally adjusted (NSA) and 0.8% m/m SA gain in July, it’s likely that there was some moderation or correction in activity in August, more so if one assumes the normalization of World Cup related spending that took place in the first half of July. INEGI’s timely indicator of economic activity (IOAE)—which is, admittedly, not great—estimates that Mexico’s economy grew 0.14% SA in August, half of July’s 0.29% m/m.
We don’t have a lot of August data to go on to guesstimate next week’s IGAE reading, but industrial production accelerated to 3.5% from 2.7% y/y according to INEGI data and ANTAD same-store sales rose by 1.7% y/y, compared to a 1% gain in July. Beyond the little data that we have, after a strong 1.7% m/m NSA gain in economic activity in July, it’s reasonable to assume a decline in August (in line with seasonal patterns), which at -1% m/m would translate into a 3.1% y/y print; call it 3% y/y for simplicity with a bias to the upside.
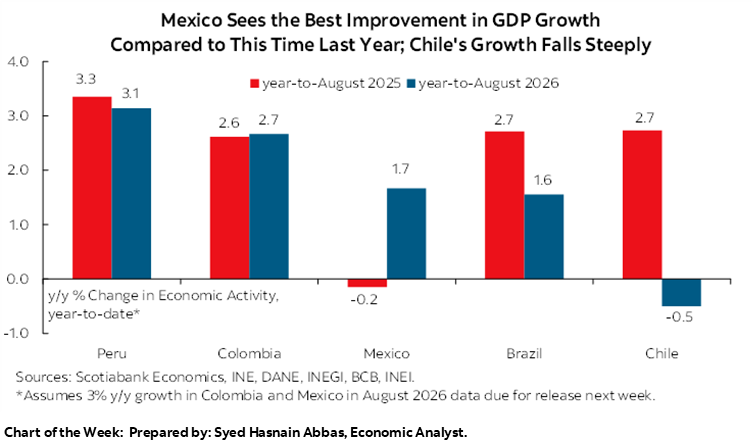
Taking a 3% gain in economic activity in August means Mexico’s economy expanded by 1.7% y/y in the first eight months of the year compared to the same period last year. This looks like a solid turnaround from the 0.2% y/y contraction it recorded in the first eight months of 2025, which stands in contrast to comparative decelerations in each of Chile, Brazil, and Peru for these same periods as the front-page chart shows; Colombia’s growth was practically the same in 2025 and 2026 year-to-date.
A 1.7% expansion in the year-to-date would be stronger than economists, including those at Banxico, had anticipated for the current year, which in turn suggests that there’s less of a pressing need to roll out additional rate cuts. In January’s Banxico economists survey, the median respondent projected growth of 1.2–1.3% in 2026. We think the fourth quarter will see a decent deceleration in GDP growth that would bring the annual average to 1.3%—but this is more than double our 0.6% forecast at the start of the year.
Contrary to expectations, the FIFA World Cup was not a major boost to the domestic economy, particularly regarding spending by international tourists. As the team discusses in today’s report, Mexico’s tourism sector continues to post only moderate growth in international arrivals. Mexico received 4% more tourists in Jan–Aug 2026 than it did over the same period in 2025, but this compares to 7.5% y/y growth twelve months prior. The composition of these arrivals is also discouraging, non-border/air arrivals tourists fell by 4% y/y year-to-date (compared to +0.3% in Jan–Aug 2025). The most recent figures for August are worse, with a 0.5% y/y drop in total arrivals and a 6.5% y/y drop in air arrivals—all taking place alongside falling occupancy rates at hotels.
COUNTRY UPDATES
Mexico—Tourism Fails to Pick Up in Mexico Despite Co-Hosting the FIFA World Cup
Rodolfo Mitchell, Director of Economic and Sectoral Analysis
+52.55.3977.4556 (Mexico)
mitchell.cervera@scotiabank.com.mx
Miguel Saldaña, Economist
+52.55.5123.1718 (Mexico)
msaldanab@scotiabank.com.mx
Martha Cordova, Economic Research Specialist
+52.55.5435.4824 (Mexico)
martha.cordovamendez@scotiabank.com.mx
Despite hosting the most recent FIFA World Cup last summer, Mexico’s tourism sector continues to post only moderate growth in international arrivals, while its composition points to a less robust performance: border flows are the main source of growth, whereas air arrivals, hotel occupancy, and passenger traffic at several beach destinations are weakening. As a result, the outlook for 2026 is one of nationwide growth with pronounced regional disparities rather than a broad-based boom.
Mexico received approximately 32.7 million international tourists between January and August 2026, 3.9% more than in 2025 and nearly 10% above the 29.8 million recorded in the same period of 2019. However, momentum has moderated: in August, total tourist arrivals fell 0.5% year over year, while arrivals of non-border tourists—the segment most closely associated with traditional tourist destinations—declined 6.6%; within this category, air arrivals dropped 6.5%. In contrast, border tourist arrivals rose 5.4%. Tourist spending increased 8.1% in August, supported by a 15.2% rise in average spending among air travelers. The United States accounted for 67.1% of non-border tourists that month, underscoring Mexico’s high dependence on that market.
The hotel sector is also showing signs of a slowdown. Across the 70 destinations monitored by DataTur, cumulative occupancy through July fell from 59.2% in 2025 to 57.4% in 2026: beach destinations declined from 67.6% to 64.8%, while cities edged down from 51.9% to 51.0%. Room supply grew 3.1%, but occupied rooms increased by only 0.1%, indicating that capacity expansion is outpacing demand. Among the main tourism hubs, Cancún maintained a high occupancy rate of 73.2%, although 1.6 percentage points lower; Los Cabos reached 73.5%, down 2.6 points; Riviera Maya fell from 74.5% to 68.7%; and Playa del Carmen declined from 71.9% to 66.9%. In contrast, Mexico City improved from 55.0% to 57.2%, and Huatulco from 67.1% to 69.5%.
Airport data confirm this divergence. Between January and September, the three private airport groups handled just over 92 million passengers combined, 1.6% fewer than a year earlier: ASUR Mexico fell 3.1% y/y and GAP Mexico 2.35% y/y, while OMA grew 2.0% y/y. Cancún recorded 20.9 million passengers, a decline of 5.9%, including a 6.5% drop in international traffic. Within GAP, Guadalajara advanced 4.2%, but Tijuana fell 5.2%, Los Cabos 5.6%, and Puerto Vallarta 12.3%; at the latter two destinations, international traffic declined 8.4% and 19.4%, respectively. Within OMA, Monterrey grew only 0.8%, Mazatlán fell 5.0%, and Zihuatanejo increased 5.2%. For Mexico City International Airport (AICM) and Felipe Ángeles International Airport (AIFA), whose latest official data are available through August, traffic increased 1.5% and 9.6%, respectively; at AICM, international traffic grew 3.9%, while AIFA was driven mainly by domestic passengers. However, it is worth noting that AIFA’s estimated occupancy is expected to reach only 40% of its potential in 2026.
Supportive factors include the domestic market, border flows, the recovery in Mexico City and Guadalajara, and connectivity across the main urban centres. Conversely, operators and industry associations identify reduced air capacity, higher jet fuel prices, peso appreciation, perceptions of insecurity, sargassum, and weaker international promotion as obstacles to competitiveness. In Cancún, the departure of Spirit Airlines and aircraft shortages also reduced capacity from the United States, the main source market for the Mexican Caribbean.
For year-end 2026, CNET projects 49.7 million international tourists, 4% more than in 2025, and revenues of US$36.8 billion, an estimated increase of 5%. Cumulative growth through August is consistent with that aggregate forecast, although the mix is less favourable for beach destinations and air travel. There is not yet a sufficiently detailed official nationwide forecast for 2027. The baseline scenario is one of moderate and uneven growth: Mexico retains favourable structural fundamentals, and Phocuswright ranks it among the markets with the greatest expansion potential through 2027, but the Mexican Caribbean faces tangible connectivity risks; hoteliers estimate a further 5.3% reduction in seats to Cancún between January and April 2027.
Mexico’s tourism sector continues to show momentum in terms of volume, but growth is moderating in the highest-value segments and at the main beach destinations. The strength of cities such as Mexico City and Guadalajara contrasts with the weakness of Cancún, Puerto Vallarta, Los Cabos, and Riviera Maya. Therefore, the main challenge for 2027 will be to restore international connectivity and competitiveness, rather than merely increasing the total number of visitors.
| LOCAL MARKET COVERAGE | ||
| CHILE | ||
| Website: | Click here to be redirected | |
| Subscribe: | anibal.alarcon@scotiabank.cl | |
| Coverage: | Spanish and English | |
| MEXICO | ||
| Website: | Click here to be redirected | |
| Subscribe: | estudeco@scotiacb.com.mx | |
| Coverage: | Spanish | |
| PERU | ||
| Website: | Click here to be redirected | |
| Subscribe: | siee@scotiabank.com.pe | |
| Coverage: | Spanish | |
DISCLAIMER
This report has been prepared by Scotiabank Economics as a resource for the clients of Scotiabank. Opinions, estimates and projections contained herein are our own as of the date hereof and are subject to change without notice. The information and opinions contained herein have been compiled or arrived at from sources believed reliable but no representation or warranty, express or implied, is made as to their accuracy or completeness. Neither Scotiabank nor any of its officers, directors, partners, employees or affiliates accepts any liability whatsoever for any direct or consequential loss arising from any use of this report or its contents.
These reports are provided to you for informational purposes only. This report is not, and is not constructed as, an offer to sell or solicitation of any offer to buy any financial instrument, nor shall this report be construed as an opinion as to whether you should enter into any swap or trading strategy involving a swap or any other transaction. The information contained in this report is not intended to be, and does not constitute, a recommendation of a swap or trading strategy involving a swap within the meaning of U.S. Commodity Futures Trading Commission Regulation 23.434 and Appendix A thereto. This material is not intended to be individually tailored to your needs or characteristics and should not be viewed as a “call to action” or suggestion that you enter into a swap or trading strategy involving a swap or any other transaction. Scotiabank may engage in transactions in a manner inconsistent with the views discussed this report and may have positions, or be in the process of acquiring or disposing of positions, referred to in this report.
Scotiabank, its affiliates and any of their respective officers, directors and employees may from time to time take positions in currencies, act as managers, co-managers or underwriters of a public offering or act as principals or agents, deal in, own or act as market makers or advisors, brokers or commercial and/or investment bankers in relation to securities or related derivatives. As a result of these actions, Scotiabank may receive remuneration. All Scotiabank products and services are subject to the terms of applicable agreements and local regulations. Officers, directors and employees of Scotiabank and its affiliates may serve as directors of corporations.
Any securities discussed in this report may not be suitable for all investors. Scotiabank recommends that investors independently evaluate any issuer and security discussed in this report, and consult with any advisors they deem necessary prior to making any investment.
This report and all information, opinions and conclusions contained in it are protected by copyright. This information may not be reproduced without the prior express written consent of Scotiabank.
™ Trademark of The Bank of Nova Scotia. Used under license, where applicable.
Scotiabank, together with “Global Banking and Markets”, is a marketing name for the global corporate and investment banking and capital markets businesses of The Bank of Nova Scotia and certain of its affiliates in the countries where they operate, including; Scotiabank Europe plc; Scotiabank (Ireland) Designated Activity Company; Scotiabank Inverlat S.A., Institución de Banca Múltiple, Grupo Financiero Scotiabank Inverlat, Scotia Inverlat Casa de Bolsa, S.A. de C.V., Grupo Financiero Scotiabank Inverlat, Scotia Inverlat Derivados S.A. de C.V. – all members of the Scotiabank group and authorized users of the Scotiabank mark. The Bank of Nova Scotia is incorporated in Canada with limited liability and is authorised and regulated by the Office of the Superintendent of Financial Institutions Canada. The Bank of Nova Scotia is authorized by the UK Prudential Regulation Authority and is subject to regulation by the UK Financial Conduct Authority and limited regulation by the UK Prudential Regulation Authority. Details about the extent of The Bank of Nova Scotia's regulation by the UK Prudential Regulation Authority are available from us on request. Scotiabank Europe plc is authorized by the UK Prudential Regulation Authority and regulated by the UK Financial Conduct Authority and the UK Prudential Regulation Authority.
Scotiabank Inverlat, S.A., Scotia Inverlat Casa de Bolsa, S.A. de C.V, Grupo Financiero Scotiabank Inverlat, and Scotia Inverlat Derivados, S.A. de C.V., are each authorized and regulated by the Mexican financial authorities.
Not all products and services are offered in all jurisdictions. Services described are available in jurisdictions where permitted by law.