

HIGHLIGHTS
- From the results of Brazil’s general election to regional CPI releases and a tricky BCRP rate announcement, there is a lot on offer next week in Latin America.
- Brazilian markets open on Monday to the results of Sunday’s election, with a focus on the gap between Lula and Bolsonaro as both candidates will almost certainly face off in a second-round presidential vote in late-October.
- Inflation is estimated to have accelerated in September by 0.1-0.3ppts in each of Chile, Colombia, Mexico, and Brazil. We expect a BCRP rate hold as recent monthly price gains have been in line with historical averages, but the bank is no stranger to surprises.
- In today’s report, the team in Peru covers fiscal developments in the country with an expectation that the government will meet its fiscal deficit target of 1.8% for the second consecutive year, while our economists in Mexico go over the latest formal employment data that point to a cooling in hiring.
Chart of the Week
BRAZIL ELECTION RESULTS, REGIONAL CPI, BCRP DECISION
Juan Manuel Herrera, Director
+52.55.2299.6675
juanmanuel.herrera@scotiabank.com
- From the results of Brazil’s general election to regional CPI releases and a tricky BCRP rate announcement, there is a lot on offer next week in Latin America.
- Brazilian markets open on Monday to the results of Sunday’s election, with a focus on the gap between Lula and Bolsonaro as both candidates will almost certainly face off in a second-round presidential vote in late-October.
- Inflation is estimated to have accelerated in September by 0.1-0.3ppts in each of Chile, Colombia, Mexico, and Brazil. We expect a BCRP rate hold as recent monthly price gains have been in line with historical averages, but the bank is no stranger to surprises.
- In today’s report, the team in Peru covers fiscal developments in the country with an expectation that the government will meet its fiscal deficit target of 1.8% for the second consecutive year, while our economists in Mexico go over the latest formal employment data that point to a cooling in hiring.
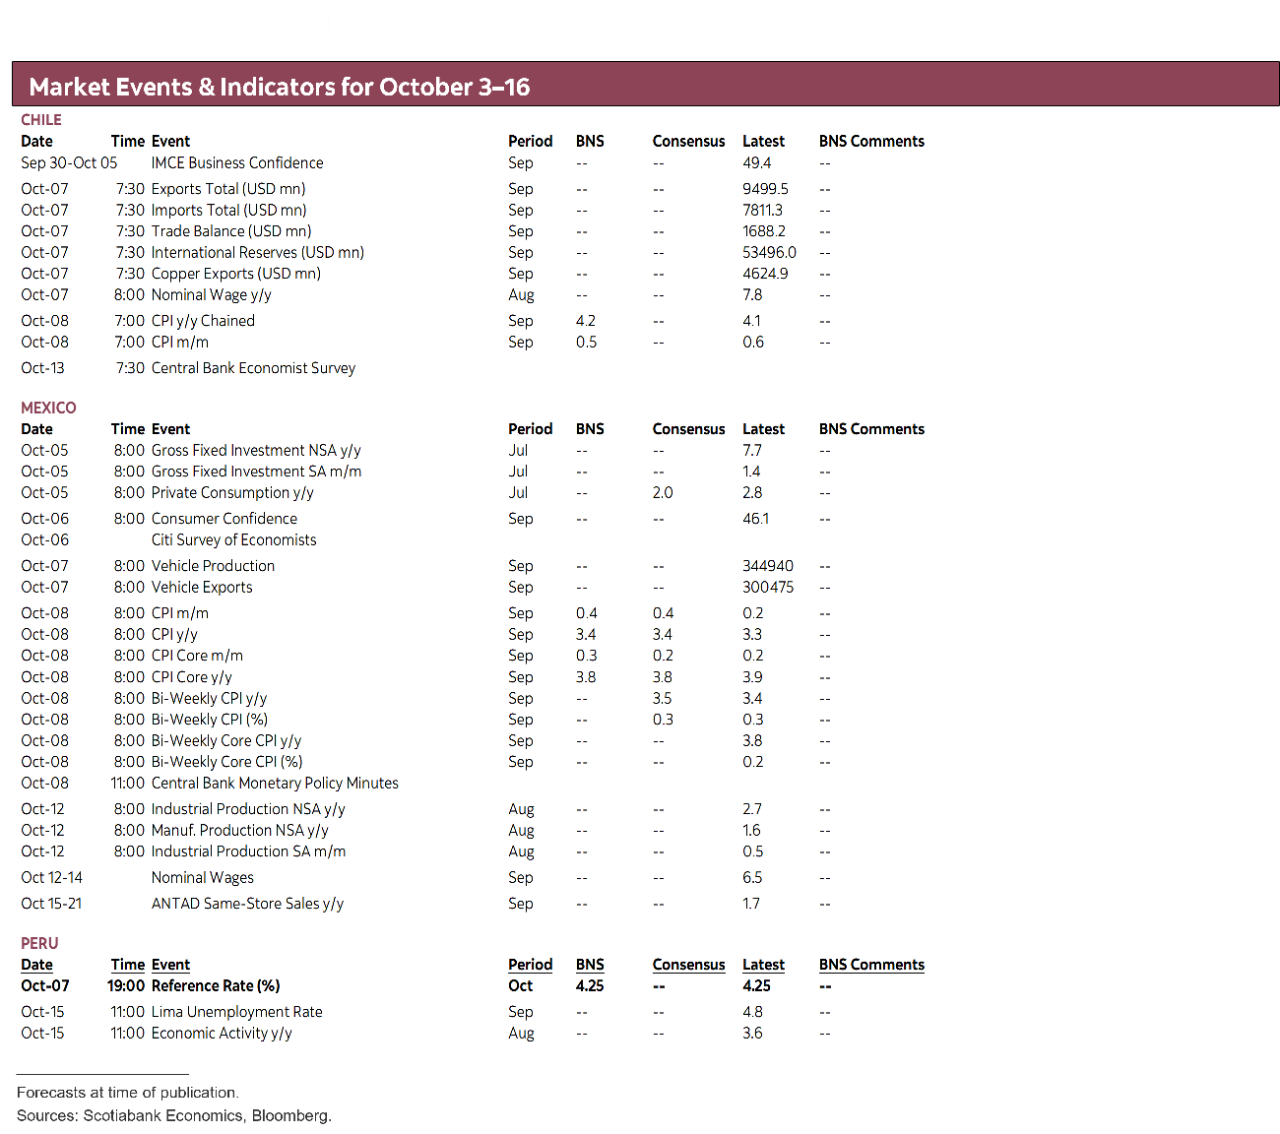
From the results of Brazil’s general election to CPI releases in Chile, Colombia, Mexico, and Brazil, and a tricky BCRP rate announcement, there is a lot on offer next week in Latin America. G10 schedules are a bit quieter than usual (Canadian employment and the Fed’s minutes are the standouts), which should give local Latam markets more room to trade on local determinants on top of the broad global market mood that remains highly attentive to energy markets and steep increases in borrowing rates.
There’s also some optimism among Mexican officials that they could soon reach an agreement with the U.S. that lowers duties on autos and steel, so we may see some developments on that front over the coming days with the White House seemingly wanting to get a deal across before the early-November midterms. Reports claim that the non-U.S. content of Mexican autos would face a 15% duty rate instead of the current 25%, which means that the effective tariff rate on the total value of the vehicle would reportedly be between 10 and 12%. This tariff cut is in line with the one the U.S. had agreed to with Canada before talks broke down in August, partly due to light trucks being excluded from this lower rate—and it is unclear whether these would be included in Mexico’s agreement.
The Latam week opens to results from Brazil’s Sunday election which should be available a few hours after polls close at 16ET, with ballots submitted almost exclusively on electronic voting machines allowing for a quick tally of results. Brazilians will cast votes for president and vice president, governors for all 26 states, both chambers of congress, and state legislatures. The presidency is, of course, the most closely watched race but one that is highly unlikely to deliver a winner as candidates require more than 50% of valid votes.
The vast majority of polls show incumbent Lula ahead by about 4–5ppts over his main contender, Flavio Bolsonaro, with both candidates obvious favourites to face off in a second-round vote on October 25th. The margin of victory for Lula or even a surprise first place result for Bolsonaro will be the main determinant of the market reaction on Monday. Several of our readers will already know the results if they first read this report on Monday morning, but a closer vote tally than that reflected in the latest polls would likely see a solid rally in Brazilian markets that adjust to higher odds of a pro-business presidency under Bolsonaro.
As for head-to-head polls, most of the major surveys show the two candidates in a statistical tie, but the latest survey from DataFolha showed Lula ahead of Bolsonaro by 3ppts. Thursday’s presidential debate, which could have swayed last-minute undecided voters, was cancelled after Lula’s withdrawal was followed by Bolsonaro’s. Between the DataFolha poll and some accusations made by Lula against Bolsonaro (left to the reader), the latter’s Polymarket victory odds have fallen to 57% from 62% a couple of days ago, but still up significantly from 25% at end-July.
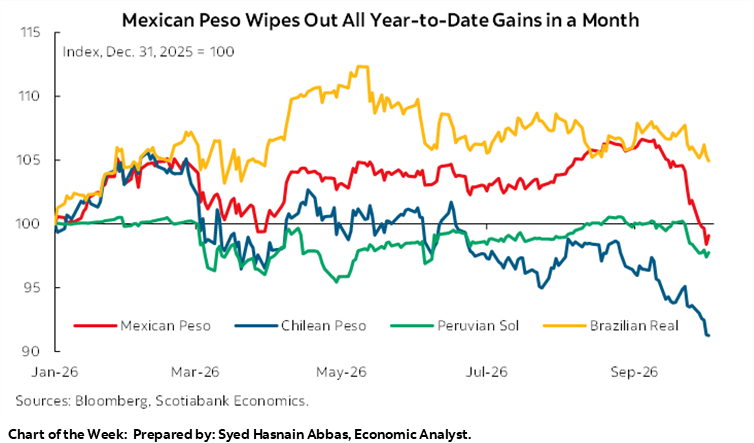
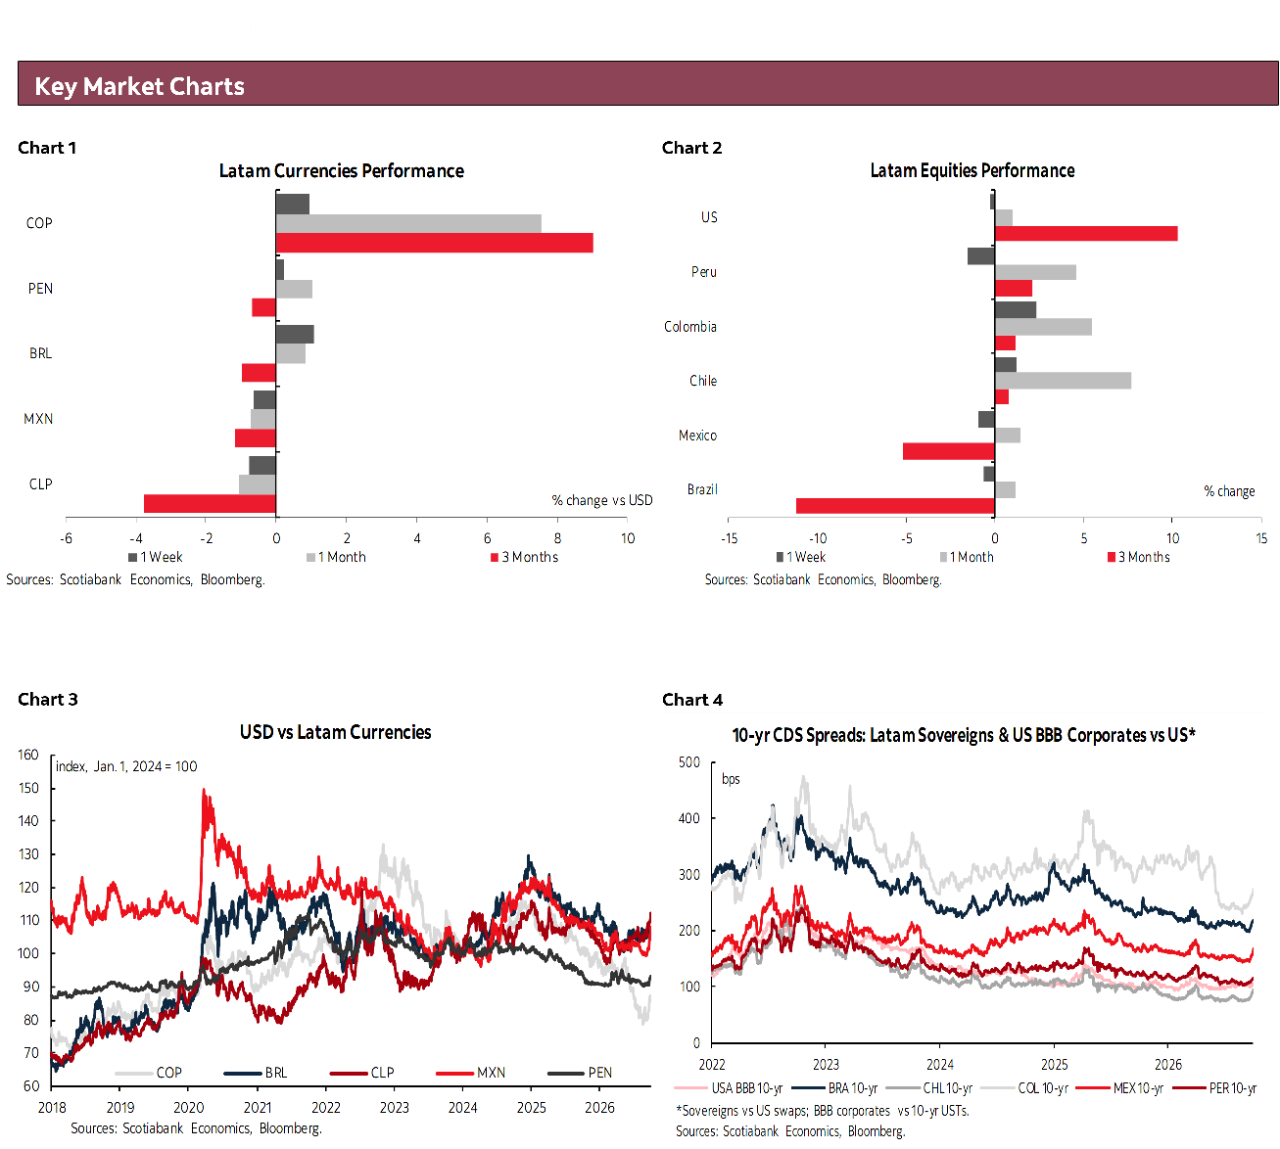
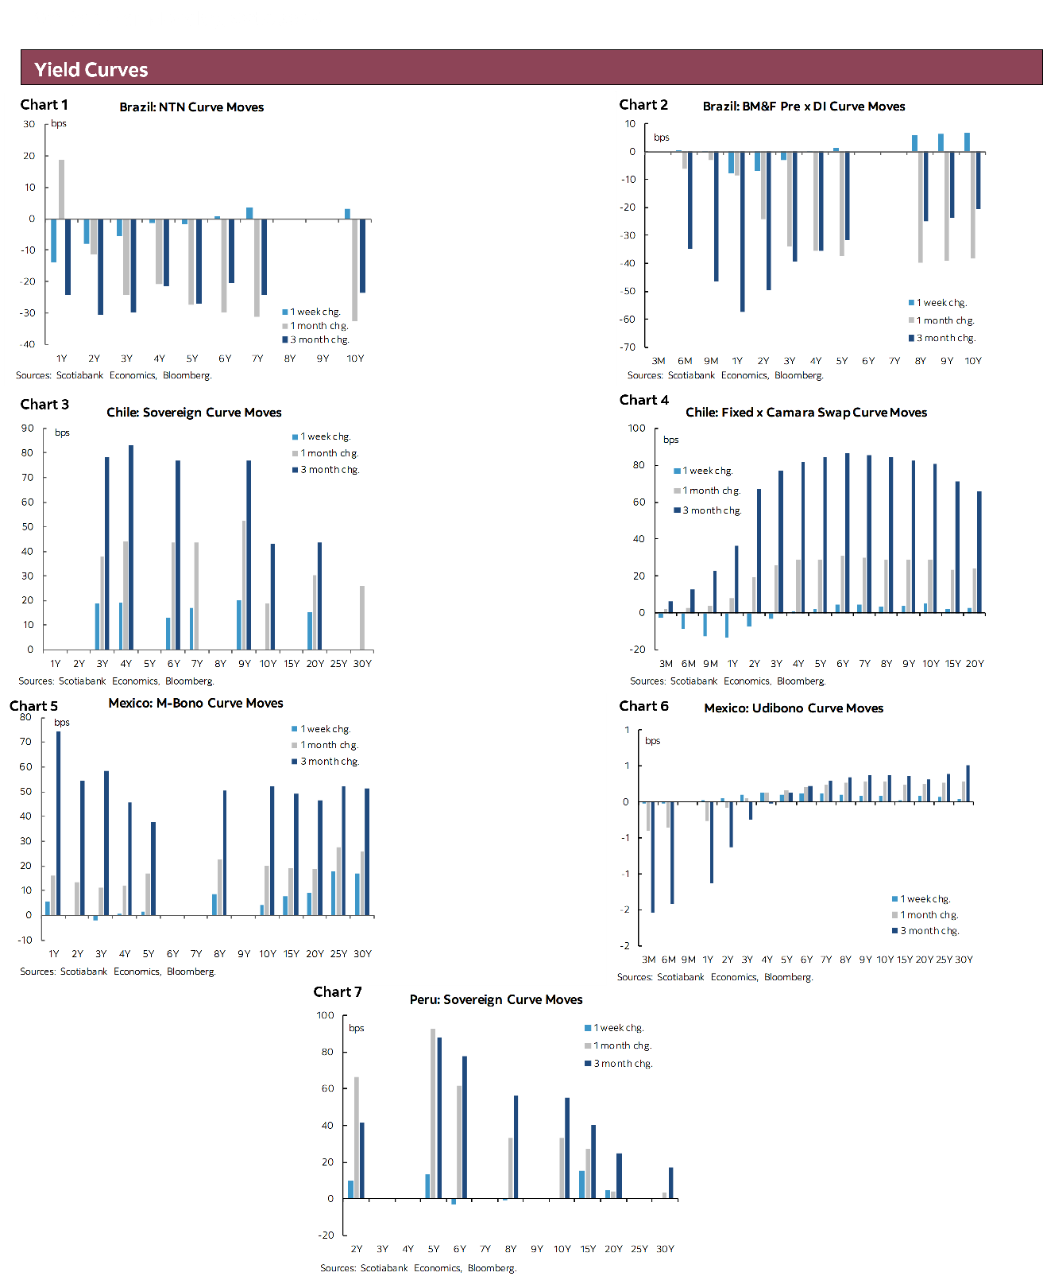
Bolsonaro’s improving odds have been a solid tailwind for Brazilian assets that have managed to resist or buck the global trends seen in recent weeks. The BRL has held up during the latest USD leg higher and the country’s 10yr yield is down about 30bps since end-August (the last couple of days have not been as friendly) compared to ~50bps higher in the U.S. or +20bps and +30bps in the case of Mexico and Chile, respectively. We’ll see whether this trend is continued or at least partly reversed next week.
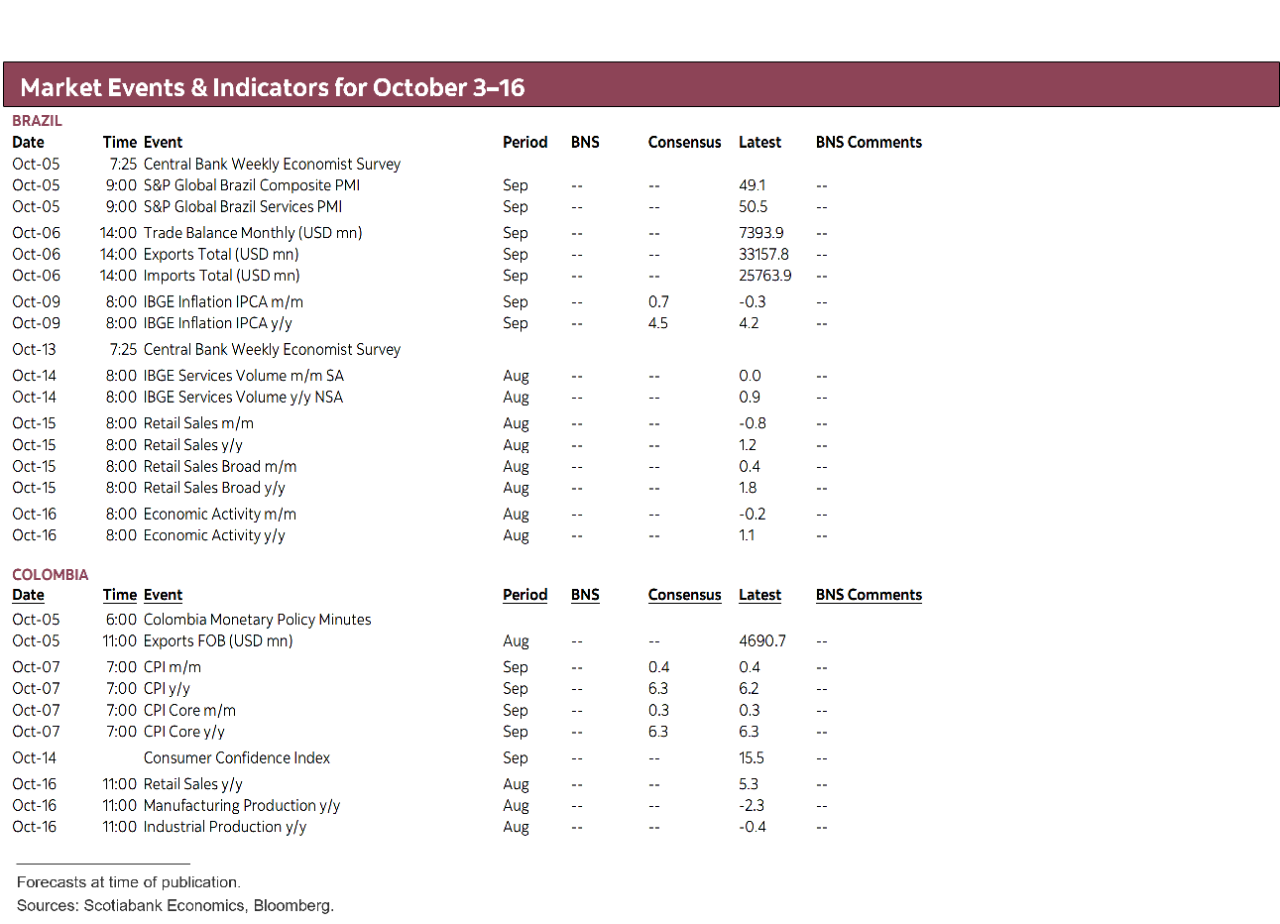
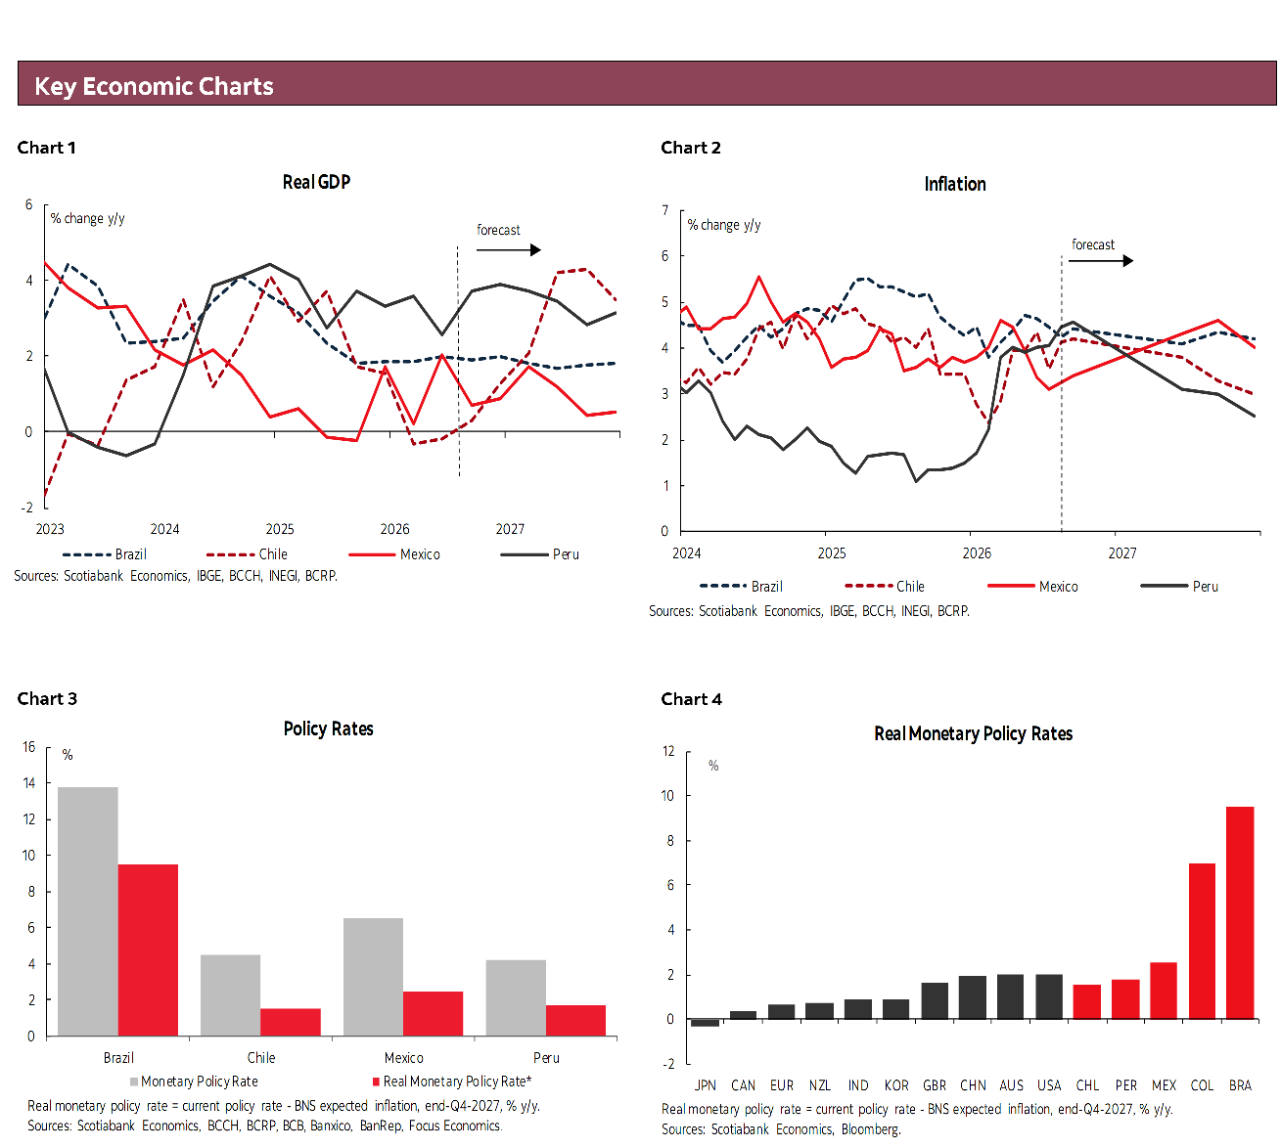
Data-wise, Brazilian September inflation will likely end up being an afterthought or secondary consideration for markets. Economists expect that headline IPCA accelerated from 4.2% to 4.5% y/y in data due Friday, merely mirroring the increase in the mid-month IPCA-15 release. Brazilian S&P PMIs on Monday, and international trade data on Tuesday should come and go without much fanfare. At writing, markets are pricing in about toss-up odds that the BCB cuts one final time by 25bps at its November or December announcement. There may be a wholesale reassessment by markets of the BCB’s policy path on the other side of the elections with greater clarity on the risks ahead, but as things stand monetary policy remains highly restrictive and bound to continue to weigh Brazilian economic growth.
The other CPI releases from the region are clustered on Wednesday and Thursday, with Colombia first up, and then Chile and Mexico the following day. Starting with Colombia, economists are eyeing a modest increase in the headline inflation rate to 6.3% from 6.2% while core inflation holds at 6.3%, coming on the heels of this past Wednesday’s somewhat unexpected 25bps BanRep hike to 12.25%—only 7 of the 29 polled by Bloomberg expected an increase, of which only 2 predicted the quarter-point move as the rest eyed a 50bps hike. The bank’s hike suggests that further tightening is possible amid continuing inflation risks, while the degree of fiscal adjustments expected under Fin Min Gómez will also influence the upside for rates depending on how much these dampen domestic demand.
We estimate that Chilean CPI rose by 0.5% m/m in September (versus 0.6% m/m in August), translating into a 4.2% y/y rate that would mark a small rise from the 4.1% pace recorded in August and thus just about reaching its highest level since June’s 4.3% level. As for the ex-volatiles basket, our economists anticipate a 0.3% m/m rise which would thus see the y/y rate ticking 0.1ppts lower to 32% from 3.3%. While headline inflation has recent from a cycle low of 2.4% in February to 4.2% as of August, ex-volatiles inflation has remained in a steady holding to slightly down-trending pattern in recent months.
Elevated headline inflation and better-behaved though still high underlying inflation stand in contrast to weak economic data out of Chile. Earlier this week (see our analysis here), the INE reported a 1% y/y decline in GDP in August and an increase in the unemployment rate to 9.6% in the three months to August. While the GDP loss was driven by a massive drop in mining activity (-17.4% y/y), non-mining activity growth has also been fairly weak this year—despite improving to 1.4% y/y after a 0.3% drop in July. However, the balance of risks in the coming months is pointing to a solid improvement in growth in 2027 as temporary headwinds fade and investment strengthens, which combined with inflationary risks suggest that the BCCh should consider adopting a hawkish tone soon, as argued by our team last week.
Similarly to Brazil, the mid-month CPI release in Mexico means we already have a pretty good idea of where the full-month September CPI data will land at its Thursday release. Headline inflation is expected to pick up from 3.3% to 3.5% while core inflation is seen ticking lower to 3.8% from 3.9%. Given the balance of prices risks and the recent steep depreciation in the MXN amid risk-off trading and the divergence between the stances of Banxico and the Fed, a hotter than expected print could apply even greater pressure on Mexican officials to consider tighter policy settings.
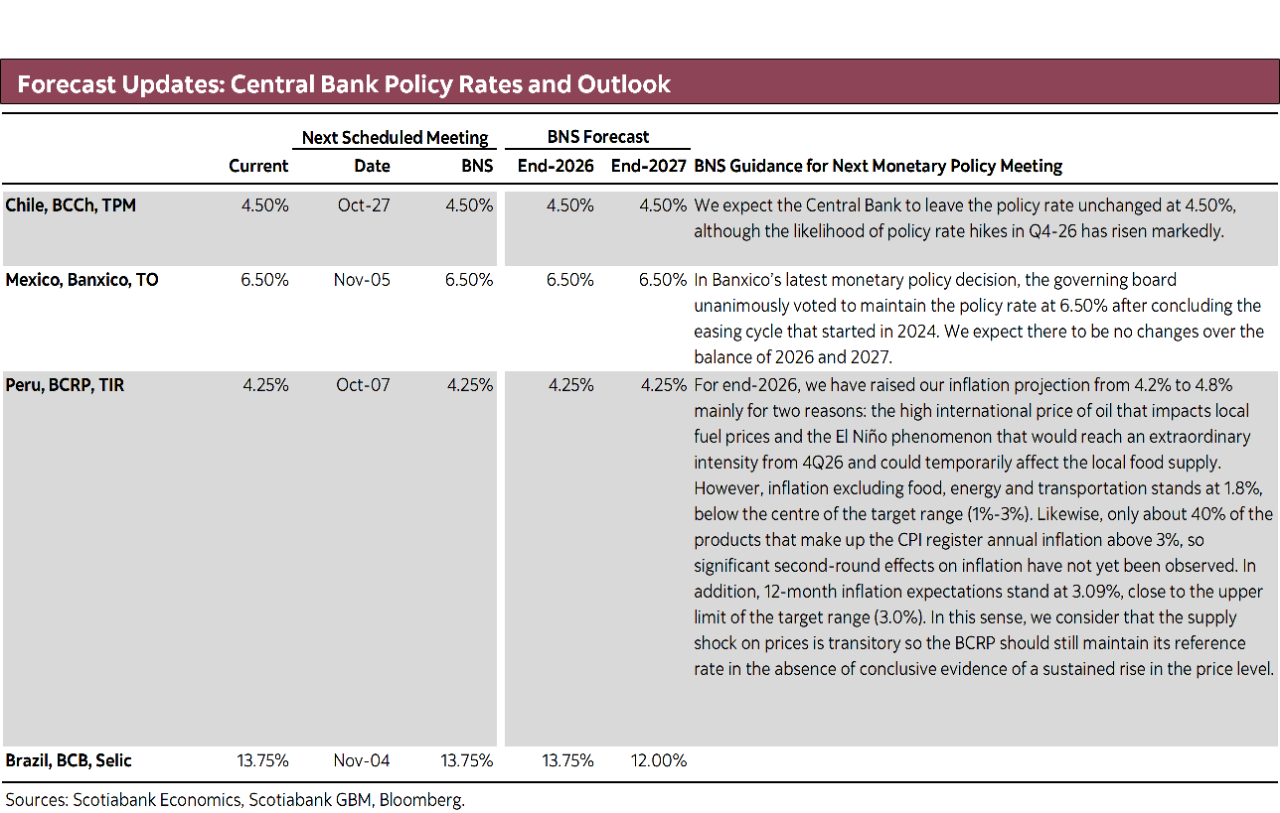
In line with the central bank’s messaging, our forecast remains that Banxico will stay put, but data and risks would favour tightening. A few hours after the CPI release, Banxico will publish the minutes to its latest rate meeting, which will be closely monitored for nuances around their assessment of how rate differentials vis-à-vis the U.S. or the behaviour of Mexican assets and financial flows could influence their own decision-making. Recall that Banxico surprisingly highlighted in its rate announcement last week that Mexican “monetary policy would not have to react mechanically to the anticipated adjustments to the federal funds rate.”
On Monday, Mexico publishes July fixed investment data that may shed some light on the state of the domestic economy, with recent macroeconomic figures having surprised to the upside, thus also arguing for a tightening of monetary conditions—though we’ll have to see how much of recent strength was temporary in relation to the FIFA World Cup or narrow-based amid a surge in imports and exports of technological goods. In today’s note, the team covers the latest formal employment data that point to a cooling in hiring, with growth of only 1.5% y/y in August.
Peru’s central bank’s policy announcement on Wednesday is a tricky one to call but we expect that officials will hold their fire and keep the reference rate unchanged at 4.25% (at writing there are only four submissions to Bloomberg, three of which project a 25bps hike). September inflation data published yesterday (see here) showed inflation a touch below expectations on a y/y basis while the 0.1% m/m increase continued the trend of monthly price gains in line or even below historical averages observed over the past few months.
Aside from large above-average overshoots in monthly inflation from February to April, monthly price increases have been fairly well behaved. Meanwhile, core inflation ex. transportation (given that bus ticket prices are highly sensitive to gasoline prices) remains a touch below the 2% target mid-point, at 1.8% y/y in August. Yesterday’s BCRP economists survey results for September also showed only a marginal rise in year-ahead inflation expectations to 3.09% from 3.05% in the August release, which should ease concerns about a runaway de-anchoring of inflation expectations in Peru.
In today’s report, the team in Peru covers fiscal developments in the country with an expectation that the government will meet its fiscal deficit target of 1.8% for the second consecutive year. In the twelve months to August, the public deficit has totaled 1% of GDP in what is a clear improvement from the 2.2% level at which it closed 2025, backed by continued gains in fiscal revenues on the back of strong domestic demand and elevated metals prices while public spending has been lower than expected.
COUNTRY UPDATES
Mexico’s Formal Labour Market Shows Signs of Cooling
Rodolfo Mitchell, Director of Economic and Sectoral Analysis
+52.55.3977.4556 (Mexico)
mitchell.cervera@scotiabank.com.mx
Miguel Saldaña, Economist
+52.55.5123.1718 (Mexico)
msaldanab@scotiabank.com.mx
Martha Cordova, Economic Research Specialist
+52.55.5435.4824 (Mexico)
martha.cordovamendez@scotiabank.com.mx
The formal employment outlook in Mexico has shown some signs of cooling. Job creation has been moderate: as of August 2026, Mexico’s Social Security Institute (IMSS) reported 22,798,473 formal workers, a monthly increase of 38,319 jobs, equivalent to annual growth of 1.5%. At the same time, the number of employers registered with the IMSS fell 2.7% that month, a monthly decline of 1,815 employers, bringing the total to 1,011,239. However, since July 2024, the decline in employers has averaged 2.2%, remaining in negative territory for 26 months; over the same period, job creation has averaged 1.0%. This suggests that the labour market adjustment is being reflected both in hiring and in the number of firms providing formal employment.
A breakdown by activity of the change in employment between 2025 and 2026 for the January–August cumulative period reveals uneven performance across sectors. Sectors such as transportation recorded gains above the cumulative figures of the past five years, with an increase of 13 million workers. Trade and professional services posted gains of 9 million and 6 million employees, respectively; although high compared with other sectors, these increases slowed relative to previous years. Meanwhile, agriculture and manufacturing recorded the steepest declines, particularly manufacturing.
Manufacturing employment fell by only 205 workers in August and by 688 thousand jobs cumulatively from January through August, equivalent to a 1.4% decline. The sector has now posted 20 consecutive months of decline, with a total of 1.5 million jobs lost over this period. The Monthly Survey of the Manufacturing Industry (EMIM) supports this assessment. Total employment in manufacturing has been declining since March 2023, with annual decreases averaging 1.6%. The most prolonged declines have occurred in subsectors such as transportation equipment manufacturing, the textile industry and, more recently, furniture manufacturing. By contrast, in recent months—and potentially owing to the boom in artificial intelligence development—the electronic equipment manufacturing subsector has recorded the strongest growth, averaging 3.6% since the beginning of the year.
At the state level, excluding Mexico City, where 134,151 jobs were created in August, the states with the strongest job creation that month were Baja California, with 87.2 thousand; Mexico State, with 59.1 thousand; and Nuevo León, with 39.6 thousand new jobs. In Sinaloa, meanwhile, employment was 19.4 thousand lower than in August 2025, marking 25 months in negative territory (excluding January and September 2025). Tamaulipas also stood out, with a decline of 15 thousand jobs and 24 months of contracting employment.
Labour informality, meanwhile, remains very high. According to INEGI’s National Survey of Occupation and Employment (ENOE), the labour informality rate reached 56.2% of the employed population in July before easing again to 55.5% in August, while the unemployment rate rose to 3.0% in August. Against this backdrop, the combination of sluggish formal job creation and a decline in the number of employers registered with the IMSS could push more workers into informal employment. In other words, with fewer firms and less formal hiring, people who lose their jobs or seek to enter the labour market have fewer opportunities in the formal sector, allowing informality to act as an absorption mechanism when alternatives are limited. This could lead not only to higher unemployment, but also to more precarious working conditions, characterized by lower incomes, no benefits and weaker social protection.
Peru on Track to Meet Fiscal Deficit Target for Second Consecutive Year
Pablo Nano, Head Economist
pablo.nano@scotiabank.com.pe
- High mineral prices and robust domestic demand are driving tax revenues.
- Current expenditure is growing faster than public investment, driven by payroll costs.
- The fiscal deficit is expected to rise gradually in the final four months of the year but remain below the official target.
Fiscal accounts have shown a positive trend so far this year (chart 1). The accumulated fiscal deficit for the 12 months ending in August 2026 stood at 1.0% of GDP, marking a significant improvement over the 2.2% deficit recorded at the end of 2025, according to Central Reserve Bank (BCR) figures. This better-than-expected performance was driven by a sustained rise in fiscal revenues—fueled by robust domestic demand and high mineral prices—and public spending that expanded less than anticipated (particularly regarding lower public investment by the national government).
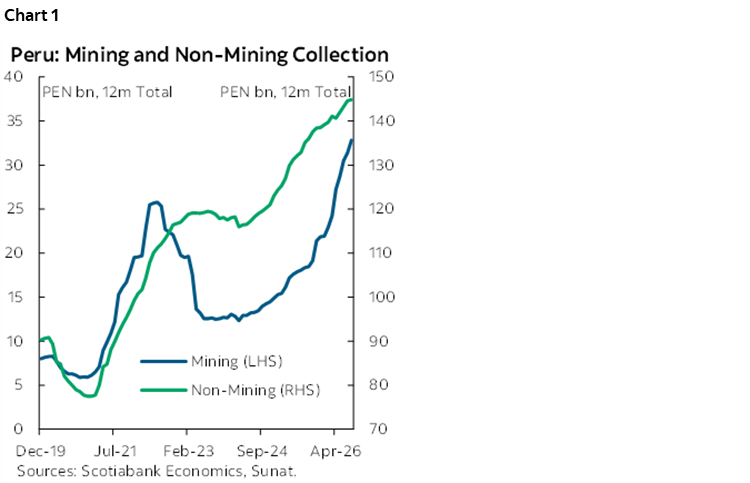
We project that the fiscal deficit will stand at approximately 1.7% of GDP by the end of 2026, thereby meeting the official target of 1.8% of GDP for the second consecutive year. It should be noted that public spending—both current expenditure and public investment—is seasonally higher in the second half of the year. This factor, combined with a request for an S/ 8 billion supplementary budget from the Executive to Congress—intended for security and prevention works related to the El Niño event—is expected to drive a gradual increase in the fiscal deficit during the final four months of the year. For its part, we anticipate continued momentum in tax revenues, driven by high copper prices—thanks to the metal's key role in the energy transition, the expansion of data centers linked to artificial intelligence, and global supply constraints—as well as sustained momentum in domestic demand, underpinned by improved business and consumer expectations.
FISCAL REVENUES
General Government current revenues (charts 2 and 3) totaled S/ 181 billion between January and August 2026, a 16.8% increase compared to the same period in 2025. This performance was primarily driven by a rise in tax revenues (+18.0%), resulting from higher payments by mining companies (income tax and special mining tax), the expansion of domestic demand (reflected in increased IGV and ISC payments), and payments associated with sports betting and digital services. Meanwhile, non-tax revenues (+12.6%) were boosted by mining royalty payments, which doubled due to the rise in mineral prices.
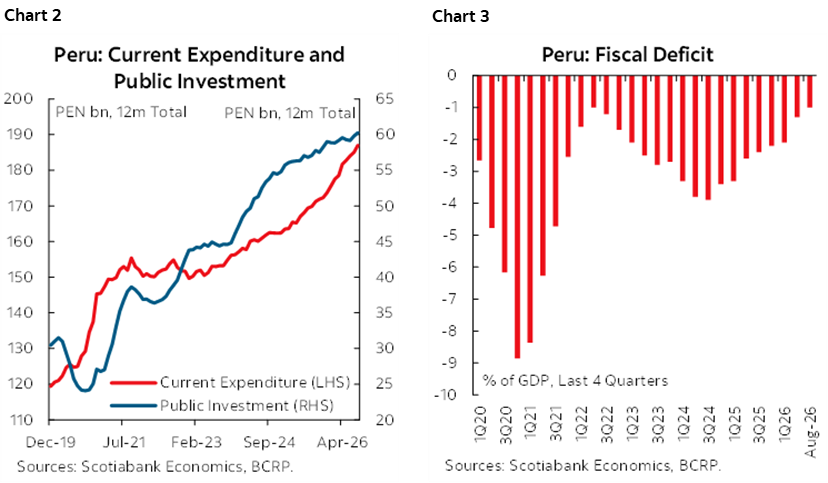
Income Tax (IR) revenues (+18.7%) were driven mainly by corporate advance payments, which reached S/ 29 billion (+38.2%). Of this amount, S/ 9.9 billion (+129.3%) came from mining companies—reflecting higher profits linked to high metal prices—and S/ 17.8 billion (+17.7%) came from companies linked to domestic demand, particularly in the commerce and services sectors. Meanwhile, personal income tax payments totaled S/ 16.5 billion (+17.9%). Notable contributors included “fifth-category” taxes paid by formal salaried employees (+11.3%)—driven by rising employment and income—and “second-category” income (+42.0%), associated with increased dividend distributions.
IGV (General Sales Tax) collection (+13.6%) was driven primarily by higher domestic IGV revenue (+14.4%), reflecting trends in private consumption that boosted retail sales in sectors such as commerce and services. Additionally, revenue from IGV on imports (+12.4%) benefited from the increased value of imports, particularly consumer and capital goods.
Revenue from the Selective Consumption Tax (ISC) (+16.2%) was driven mainly by higher sales of beer, soft drinks, and imported goods, as well as the tax applied to remote gaming and sports betting—which rose from S/ 22.5 million in August 2025 to S/ 44.2 million in August 2026.
PUBLIC EXPENDITURE
General government non-financial expenditure reached S/ 160 billion (+7.9%) between January and August 2026. This increase was driven by higher current expenditure and, to a lesser extent, increased public investment execution (chart 4).
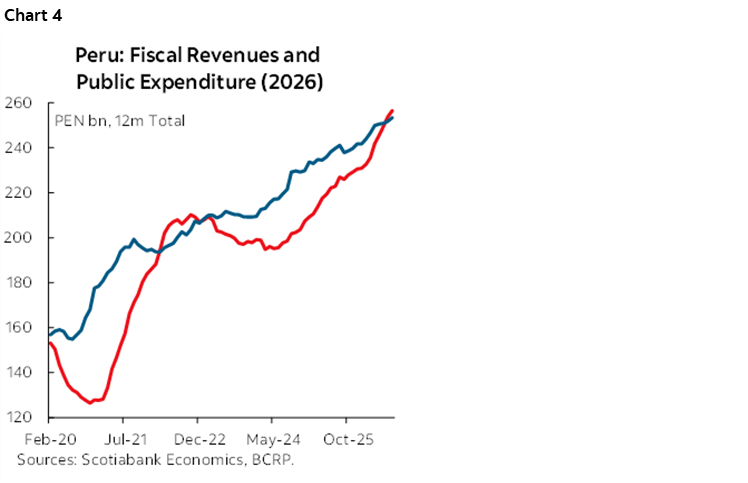
Current expenditure (+12.1%) expanded, driven primarily by higher wages and salaries payments (+11.6%), particularly for personnel in the interior, education, health, justice, and defense sectors. Higher outlays were also recorded for the purchase of goods and services (+13.0%)—especially by the National Government—notably regarding payments to personnel hired under service contracts and the procurement of medical supplies. Additionally, increased payments were made for fuel purchases. Meanwhile, the transfers category (+11.6%) grew partly due to the settlement of an arbitration award lost by the Peruvian State at ICSID against IC Power & Kenon Holdings Ltd., which entailed a payment of S/ 688 million.
Public investment (+10.4%) was driven by dynamic execution at the regional (+16.3%) and local (+13.2%) government levels, with notable contributions from projects financed via the “Works for Taxes” mechanism and projects with investment amounts exceeding S/ 10 million. This growth was partially offset by a decline in National Government investment (-13.4%), specifically regarding the Bicentennial Schools project—the first stage of which has concluded—and projects managed by the National Infrastructure Authority (ANIN). It is worth noting that, between January and August, S/ 3 billion in expenditure was accrued for disaster risk management projects and extraordinary interventions related to the El Niño event; this amount represents 58% of the Modified Institutional Budget (PIM), according to the Central Reserve Bank (BCR).
| LOCAL MARKET COVERAGE | ||
| CHILE | ||
| Website: | Click here to be redirected | |
| Subscribe: | anibal.alarcon@scotiabank.cl | |
| Coverage: | Spanish and English | |
| MEXICO | ||
| Website: | Click here to be redirected | |
| Subscribe: | estudeco@scotiacb.com.mx | |
| Coverage: | Spanish | |
| PERU | ||
| Website: | Click here to be redirected | |
| Subscribe: | siee@scotiabank.com.pe | |
| Coverage: | Spanish | |
DISCLAIMER
This report has been prepared by Scotiabank Economics as a resource for the clients of Scotiabank. Opinions, estimates and projections contained herein are our own as of the date hereof and are subject to change without notice. The information and opinions contained herein have been compiled or arrived at from sources believed reliable but no representation or warranty, express or implied, is made as to their accuracy or completeness. Neither Scotiabank nor any of its officers, directors, partners, employees or affiliates accepts any liability whatsoever for any direct or consequential loss arising from any use of this report or its contents.
These reports are provided to you for informational purposes only. This report is not, and is not constructed as, an offer to sell or solicitation of any offer to buy any financial instrument, nor shall this report be construed as an opinion as to whether you should enter into any swap or trading strategy involving a swap or any other transaction. The information contained in this report is not intended to be, and does not constitute, a recommendation of a swap or trading strategy involving a swap within the meaning of U.S. Commodity Futures Trading Commission Regulation 23.434 and Appendix A thereto. This material is not intended to be individually tailored to your needs or characteristics and should not be viewed as a “call to action” or suggestion that you enter into a swap or trading strategy involving a swap or any other transaction. Scotiabank may engage in transactions in a manner inconsistent with the views discussed this report and may have positions, or be in the process of acquiring or disposing of positions, referred to in this report.
Scotiabank, its affiliates and any of their respective officers, directors and employees may from time to time take positions in currencies, act as managers, co-managers or underwriters of a public offering or act as principals or agents, deal in, own or act as market makers or advisors, brokers or commercial and/or investment bankers in relation to securities or related derivatives. As a result of these actions, Scotiabank may receive remuneration. All Scotiabank products and services are subject to the terms of applicable agreements and local regulations. Officers, directors and employees of Scotiabank and its affiliates may serve as directors of corporations.
Any securities discussed in this report may not be suitable for all investors. Scotiabank recommends that investors independently evaluate any issuer and security discussed in this report, and consult with any advisors they deem necessary prior to making any investment.
This report and all information, opinions and conclusions contained in it are protected by copyright. This information may not be reproduced without the prior express written consent of Scotiabank.
™ Trademark of The Bank of Nova Scotia. Used under license, where applicable.
Scotiabank, together with “Global Banking and Markets”, is a marketing name for the global corporate and investment banking and capital markets businesses of The Bank of Nova Scotia and certain of its affiliates in the countries where they operate, including; Scotiabank Europe plc; Scotiabank (Ireland) Designated Activity Company; Scotiabank Inverlat S.A., Institución de Banca Múltiple, Grupo Financiero Scotiabank Inverlat, Scotia Inverlat Casa de Bolsa, S.A. de C.V., Grupo Financiero Scotiabank Inverlat, Scotia Inverlat Derivados S.A. de C.V. – all members of the Scotiabank group and authorized users of the Scotiabank mark. The Bank of Nova Scotia is incorporated in Canada with limited liability and is authorised and regulated by the Office of the Superintendent of Financial Institutions Canada. The Bank of Nova Scotia is authorized by the UK Prudential Regulation Authority and is subject to regulation by the UK Financial Conduct Authority and limited regulation by the UK Prudential Regulation Authority. Details about the extent of The Bank of Nova Scotia's regulation by the UK Prudential Regulation Authority are available from us on request. Scotiabank Europe plc is authorized by the UK Prudential Regulation Authority and regulated by the UK Financial Conduct Authority and the UK Prudential Regulation Authority.
Scotiabank Inverlat, S.A., Scotia Inverlat Casa de Bolsa, S.A. de C.V, Grupo Financiero Scotiabank Inverlat, and Scotia Inverlat Derivados, S.A. de C.V., are each authorized and regulated by the Mexican financial authorities.
Not all products and services are offered in all jurisdictions. Services described are available in jurisdictions where permitted by law.