

HIGHLIGHTS
- Chilean GDP, Peruvian CPI, and BanRep’s likely rate hold are the highlights in next week’s Latam calendar, joined by Mexican international trade data and Brazilian industrial production, with global markets anxiously awaiting Friday’s U.S. nonfarm payrolls report.
- Despite weak economic conditions in Chile, the BCCh’s stance may soon have to tilt in a hawkish direction, as our team in the country argues in today’s report, listing several reasons for why a rate hike forecast could become their baseline scenario.
- From Mexico, we cover the recent strength in economic activity, with stronger momentum than expected backed by construction and wholesale trade, while more muted consumption and labour markets limit the possibility of a broader expansion.
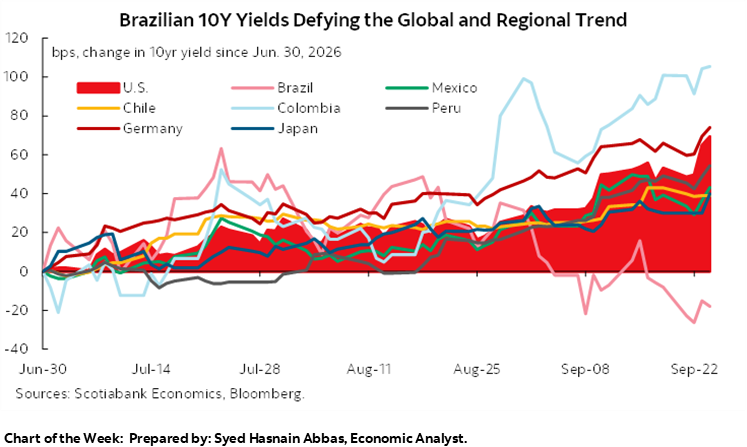
Chart of the Week
CHILE GDP, PERU CPI, BANREP DECISION
Juan Manuel Herrera, Director
+52.55.2299.6675
juanmanuel.herrera@scotiabank.com
- Chilean GDP, Peruvian CPI, and BanRep’s likely rate hold are the highlights in next week’s Latam calendar, joined by Mexican international trade data and Brazilian industrial production, with global markets anxiously awaiting Friday’s U.S. nonfarm payrolls report.
- Despite weak economic conditions in Chile, the BCCh’s stance may soon have to tilt in a hawkish direction, as our team in the country argues in today’s report, listing several reasons for why a rate hike forecast could become their baseline scenario.
- From Mexico, we cover the recent strength in economic activity, with stronger momentum than expected backed by construction and wholesale trade, while more muted consumption and labour markets limit the possibility of a broader expansion.
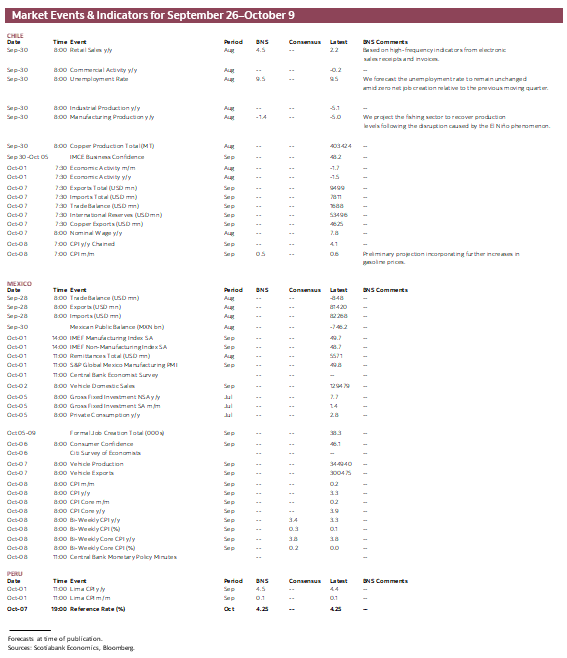
We have a packed Latam calendar in the days ahead, with something of note from all the major countries in the region in the lead up to the global week’s main event, U.S. nonfarm employment on Friday. Soaring global yields in the month to date, as most major central banks dial up the hawkishness alongside $100/bbl+ oil prices, are clearly weighing on risk sentiment. A lot hinges on next week’s U.S. jobs report (although maybe less than usual given the Fed’s greater inflation focus) with traders pricing in at least three more Fed hikes over the next twelve months, will it be a blowout that piles on anxiety in markets and puts greater pressure on some other central banks to follow suit with hikes (e.g. Banxico just as it explicitly decoupled itself from the Fed) or will it be an underwhelming reading that takes the edge off?
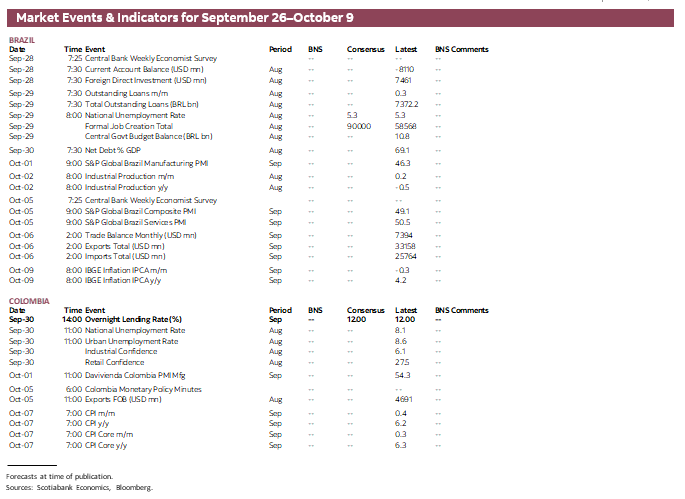
Chilean GDP and Peruvian CPI on Thursday, and BanRep’s likely rate hold on Wednesday are the highlights in next week’s Latam calendar, joined by Mexican international trade data and Brazilian industrial production. The focus for Brazilian markets will be how expectations shape up for the weekend’s general elections. The tally is expected to send incumbent Lula and his main challenger Bolsonaro to a second-round vote in late-October, with polls showing them in statistical tie territory. Aside from U.S. employment and PCE data, the G10 calendar also offers Canadian GDP, Eurozone inflation, and the RBA’s rate announcement.
Chile’s release slate is compressed over Wednesday and Thursday, first with retail sales, commercial activity, and industrial production data for July, leading into the following day’s economic activity (IMACEC, a GDP proxy) release. Economic growth in Chile has clearly been disappointing in 2026, with mining weakness and the impact of adverse weather partly to blame but also reflecting more sluggish underlying demand trends than expected.
In July, Chile’s GDP fell by 1.5% y/y for its worst monthly performance since late-2022, with the mining sector accounting for 1.3ppts of this loss, and manufacturing and the services industry acting as 0.3ppts drags each, offset only partially by the commerce sector and other goods. Mining and manufacturing declines are not a new thing for 2026, but the 0.7% y/y drop in services activity certainly was. Heavy rains and floods took a toll on practically all of the Chilean economy in July, and El Niño continued to disrupt activity in August.
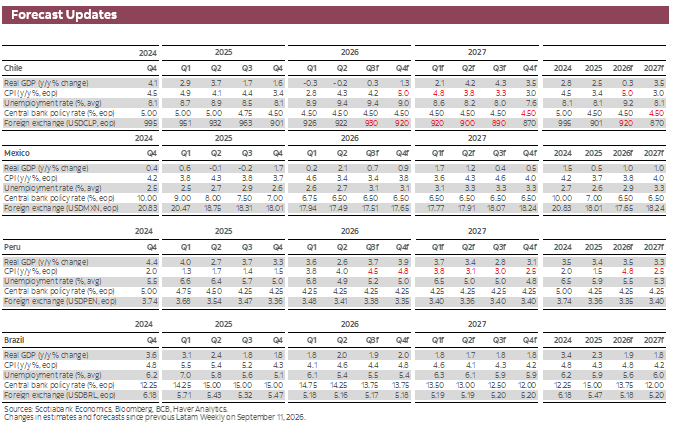
It’s tough to get a good sense of where economic activity will land without having Wednesday’s data at hand, but a recovery from the harsh July is reasonable to expect, albeit to relatively muted levels. After 0.3 and 0.2% y/y contractions in GDP in Q1 and Q2-26, we project that the country will post a soft 0.3% gain in the third quarter before closing the year on a stronger 1.3% rise with less negative weather effects and a pick up in investment. Note that on a quarter-over-quarter basis, however, Chile may still record a third straight quarterly contraction if it fails to post average monthly GDP gains of around 1% in each of August and September, with the 1.7% m/m seasonally adjusted drop in July representing a very weak starting point for Q3.
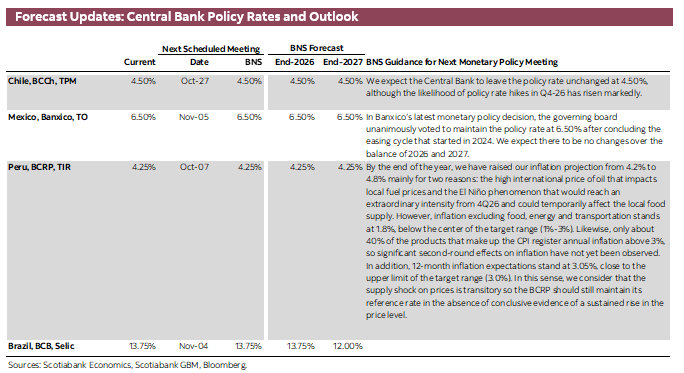
Despite weak economic conditions, the BCCh’s stance may soon have to tilt in a hawkish direction, as our team in the country argues in today’s report, listing several reasons for why a rate hike forecast could become their baseline scenario. A low real policy rate, CLP depreciation, global central banks turning hawkish, upside inflation surprises (August at 4.1% y/y) and risks to inflation expectations, and a view that domestic demand should strengthen considerably in 2027 all build a strong case for the BCCh to adopt a more restrictive monetary policy stance. At present, markets are pricing in that the BCCh will hike by 25 bps in late-2026/early-2027.
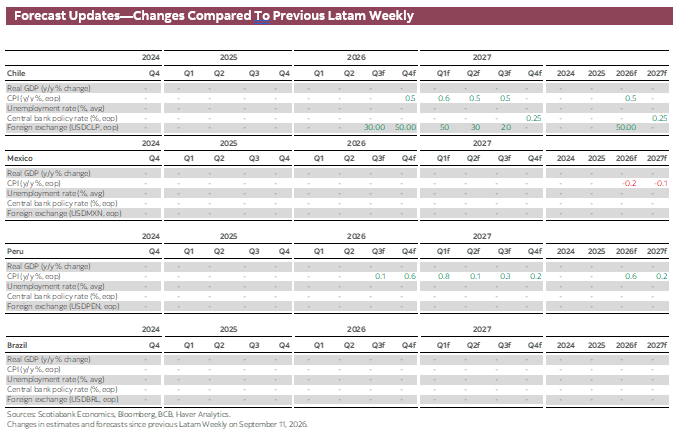
Peru is out with September CPI data on Thursday. We estimate that headline CPI rose by 4.5% y/y, thus practically identical to the 4.44% reading for August. However, this would be on the back of a modest estimated 0.1% m/m gain in line with the previous month’s 0.07% ncrease, and which compares to September 2025’s flat prices. Moderate monthly CPI gains of late notwithstanding, our team projects that inflation will average 4.5% in Q3-26 rising to 4.8% in Q4-26, to later slowing to around 3% from Q2-27.
We continue to anticipate an unchanged BCRP benchmark rate at 4.25% over the forecast horizon, though this is highly dependent on the evolution of inflation, inflation expectations, and international risks. The BCRP opened the door to the possibility of rate increases if needed at its September rate announcement, when it said that it “remains attentive to new information on inflation and its determinants with a view to making adjustments to monetary policy in the short term." So far, price pressures seem mostly confined to temporary shocks, but evidence of second round effects and a deanchoring of medium/longer-term inflation expectations could prompt a response.
Next Wednesday, we have the last of the Latam central bank decisions in the cycle, with BanRep expected to leave its policy rate at 12.00%, coming off a rate hold at its late-July announcement when most economists thought Colombian policymakers would roll out a 50bps increase. BanRep’s 275bps in hikes in the year-to-date have taken the policy rate to its highest level since Q2-24, but remaining 125bps below the 13.25% peak where it sat for most of May-December 2023. BanRep will likely stick to a hawkish tone that keeps additional tightening on the table, with a minority on the board opting for a rate increase. Markets are leaning towards additional rate increases, but likely not until year-end, by which time BanRep’s highly restrictive stance should be clearer in slowing economic activity.
Mexico’s calendar highlight is the release of August international trade data at the start of the week, followed on Thursday by August remittances data and Banxico’s economists survey. In today’s note, our economists in Mexico go over the July economic activity reading, with an acceleration in real GDP growth from 1.1% to 2.8% y/y suggesting that the economy is maintaining stronger momentum than anticipated only a few months ago thanks to construction and wholesale trade, while a persistent moderation in consumption and formal employment continue to limit the possibility of a broader and more sustained expansion.
Mexican exports are having a blowout year, growing to a year-to-July total of USD 471bn, or ~USD 100bn above its USD 369bn total over the same period last year. However, a great deal of this exports increase has been fed by a surge in imports of intermediate goods that are then assembled into final products to be shipped abroad—mainly concerning technology goods (servers) exported to the U.S. In the year-to-date, imports add up to USD 462bn, up from USD368 bn in Jan-July 2025.
So, Mexico actually ran a bigger cumulative trade deficit in the first seven months of 2026 than in 2025. The picture looks very different depending on the country one looks at, of course, as Mexico’s trade surplus with the U.S. added up to USD238 bn in the year-to-date, compared to USD162bn twelve months ago. At face value, this is of course terrible news for U.S.-Mexico trade negotiations from Mexico’s point of view, with a ballooning trade surplus with the U.S. making it easier for the latter to claim it is losing in the relationship if simply measured by goods trade imbalances.
Now, it’s important to highlight that this surge in exports and imports is by and large in technology goods that are key for the buildout of AI data centres in the U.S., so it would be against the U.S.’s best interests to curb these shipments (note also that Mexican input imports mostly originate from Taiwan and Asia ex. China). Yet, it still weakens Mexico’s negotiating hand in trade talks with the U.S. whose next round was scheduled for late-September, but has now been postponed again to an indefinite, possibly October, date.
COUNTRY UPDATES
Chile—Time to Reassess the Central Bank’s Neutral Stance?
Anibal Alarcón, Senior Economist
+56.2.2619.5465 (Chile)
anibal.alarcon@scotiabank.cl
A POLICY RATE HIKE ACCOMPANIED BY A HAWKISH TONE WOULD QUICKLY BECOME OUR BASELINE SCENARIO
There are several reasons to argue why the Central Bank should adopt a more restrictive monetary policy stance than at present. We outline the key arguments below:
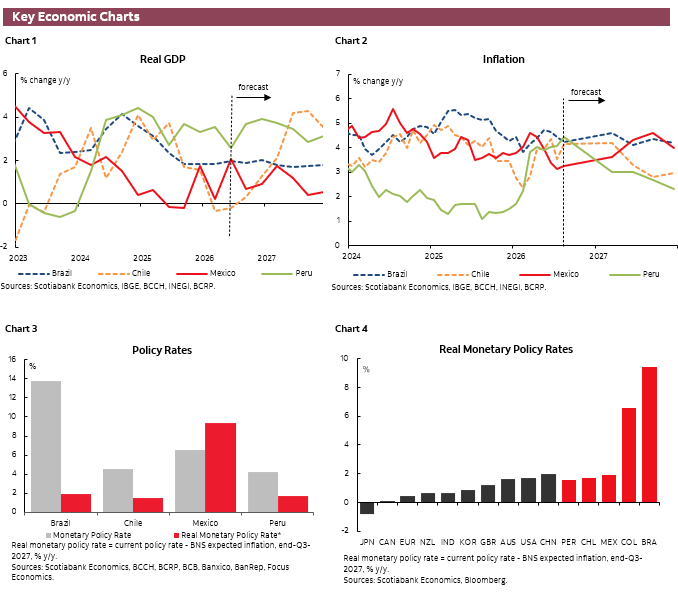
- The real policy rate is among the lowest globally. With the policy rate at 4.5% and December 2026 inflation projected at 4.8–5.0%, the ex-post real policy rate would move into negative territory by year-end, placing Chile among the economies with the most expansionary monetary settings worldwide (alongside Japan, Canada, the Eurozone, and New Zealand). This situation would become even more pronounced by Q1-27, when inflation would exceed 5%, according to market pricing and our baseline projections.
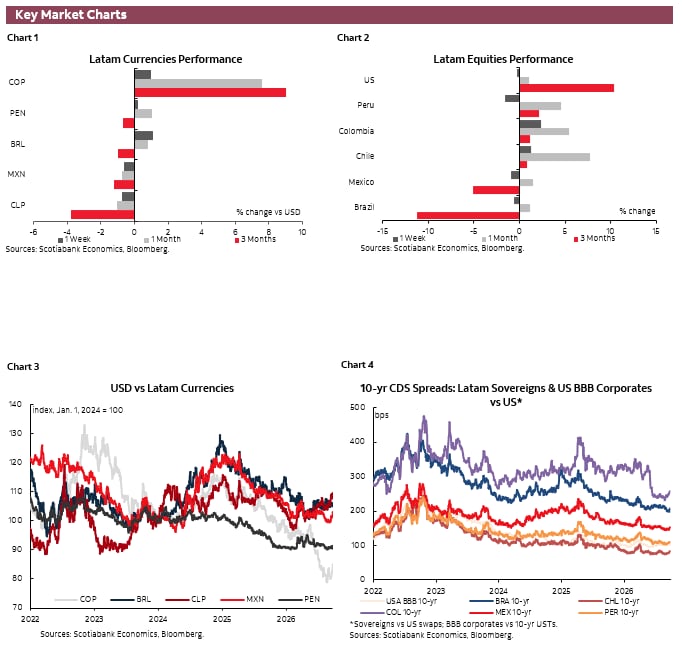
- The Chilean peso has experienced a highly idiosyncratic real and multilateral depreciation. The real exchange rate (RER) currently stands near 110 points, well above the Central Bank’s estimated equilibrium range of 94–106 points (1986=100 index), reaching levels not seen since March 2024 or during 2022. Likewise, the Multilateral Exchange Rate Index has depreciated by 11% since the onset of the conflict in the Middle East. It is worth noting that the exchange rate pass-through to inflation is estimated at 2.5% when the shock is idiosyncratic and only 0.5% when it is global in nature (September 2021 Monetary Policy Report). The characteristics of the recent peso depreciation suggest a clear idiosyncratic component, implying stronger inflationary pressures than those that could be offset by the currently projected weakness in consumption.
- Central banks worldwide are adopting a more restrictive stance. In the case of the Fed, this is compounded by the lack of forward guidance, reinforcing the need for an “insurance” approach among emerging markets. A rise in short-term rates beyond that implied by the Fed’s dot plot has become a more plausible scenario, particularly as the Fed’s narrative continues to emphasize economic resilience and stronger growth.
- August CPI surprised both market and Central Bank projections to the upside. For September, the market expects inflation of 0.5% m/m, which, if realized, would imply a cumulative surprise of 0.3 ppts relative to the September Monetary Policy Report scenario. We reiterate our December 2026 inflation forecast of 5.0% y/y, above the Central Bank’s projection of 4.3%, which did not incorporate the August CPI release.
- Risk of inflation expectations becoming unanchored and damage to Central Bank credibility. The latest Financial Traders Survey showed inflation expectations at the 13–24-month horizon rising to 3.1%. While the August Economic Expectations Survey remained at 3.0% for the same horizon, additional short-term inflation surprises could push expectations higher, ultimately forcing the Central Bank into a hawkish stance that would likely be perceived as “behind the curve.” This risk would be significantly reduced if the Central Bank moved away from its neutral stance in the near term.
- The oil price shock has proven more persistent than expected. Moreover, the intensification of the global conflict has pushed crude oil prices higher once again in international markets, ensuring another upward adjustment in domestic fuel prices next week. As a result, the risk of cost increases being passed on to final consumer prices continues to rise amid an environment of narrowing profit margins. These are precisely the factors that would justify the policy rate moving toward the upper bound of the rate corridor outlined in the September Monetary Policy Report. According to recent Fed research, oil price shocks of around 50% exhibit persistence of 12 to 24 months, pushing inflation and inflation expectations higher for up to two years before stabilizing once monetary policy becomes more restrictive.
- Chile’s neutral real policy rate has increased again in 2026. Starting from the Central Bank’s current revised nominal neutral policy rate range of 3.75–4.75%, prevailing geopolitical risks, wider fiscal deficits in advanced economies (a key driver behind the recent rise in long-term rates), and the broader adoption of AI suggest that the upper bound of the nominal neutral rate may now stand at or above 5%. Supporting this view, the Fed recently raised its longer-run policy rate estimate to 3.2% from 3.0% in December 2025. Consequently, the current policy rate level of 4.5% appears inconsistent with the latest external developments since the last revision in the December 2025 Monetary Policy Report.
- Domestic demand is projected to grow above 4% in 2027 under the latest Monetary Policy Report baseline scenario, providing room for higher policy rates. Domestic demand has expanded by more than 4% in only two of the past ten years (excluding the pandemic period). Furthermore, the expected 2027 expansion would be driven primarily by investment (8.1% according to the Central Bank) rather than consumption, which would be the component most adversely affected by higher interest rates. In other words, an upward adjustment in the policy rate would likely have a limited impact on investment materialization.
- Public spending could grow faster than assumed in the Central Bank’s baseline scenario. Following the upward revision of long-term fiscal parameters by independent experts, public expenditure could expand by as much as 2.5% in 2027, exceeding the 1.0% working assumption embedded in the September Monetary Policy Report. In addition, fiscal consolidation efforts have been concentrated in capital expenditure rather than current spending, the latter once again being on track for over-execution in 2026. Altogether, this could generate stronger inflationary pressures than those considered in the baseline scenario.
- “The economy is too weak to support policy rate hikes” remains the key argument for staying on hold. That may be true; however, some additional moderation in consumption would likely be needed to mitigate second-round effects. The earlier the adjustment in the policy rate is implemented, the smaller its impact on the 2027–2028 horizon.
- A policy rate hike ahead of market expectations would be highly surprising and could have significant effects. Swap rates currently price in policy rate increases beginning only toward the end of Q1-27. Bringing forward the tightening cycle, without necessarily changing the terminal rate implied by the swap curve, would have meaningful effects through a lower cumulative degree of monetary stimulus. Nevertheless, it cannot be ruled out that markets may ultimately reprice toward a higher terminal rate.
Mexico—Economic Activity Enters the Third Quarter with Greater Resilience, Though Challenges Persist
Rodolfo Mitchell, Director of Economic and Sectoral Analysis
+52.55.3977.4556 (Mexico)
mitchell.cervera@scotiabank.com.mx
Miguel Saldaña, Economist
+52.55.5123.1718 (Mexico)
msaldanab@scotiabank.com.mx
Martha Cordova, Economic Research Specialist
+52.55.5435.4824 (Mexico)
martha.cordovamendez@scotiabank.com.mx
During a week marked by Banxico’s meeting and the USDMXN depreciation, the July print of the Global Indicator of Economic Activity (IGAE) provided a favorable signal for economic activity at the start of the third quarter. The acceleration in annual real growth from 1.1% to 2.8% suggests that the economy is maintaining stronger momentum than anticipated only a few months ago, supported mainly by improved investment and a partial recovery in some segments linked to domestic demand. Although consumption continues to post moderate gains, the latest information points to more resilient activity during the second half of the year.
At the sector level, services continue to account for most of the annual growth in economic activity. However, a significant share of this advancement stems from the recovery in wholesale trade, which posted average annual growth of 11.2% during the second quarter, following a prolonged contraction that began in August 2024. Despite this rebound, the sector remains below the peak levels observed in September of that year. In our view, part of the recovery may be associated with an inventory rebuilding process, consistent with the recent improvement in the machinery and equipment components of investment. Similarly, construction continues to consolidate a favourable trend, growing by an average of 5.0% year-on-year during the second quarter, in line with the gradual recovery in investment observed since late 2025.
Nevertheless, the strength observed in wholesale trade and construction contrasts with the more moderate performance of some consumption-related indicators. In particular, several market-oriented service subsectors showed signs of relative stagnation in July. Although retail grew by 2.0% year-on-year during the month, its cumulative growth so far this year stands at only 0.9% YTD, reflecting weaker momentum in the formal labour market and still-contained growth in household spending. This divergence suggests that the recent rebound in activity remains concentrated in specific sectors rather than reflecting a broad-based acceleration in domestic demand.
Looking ahead, the available information provides a stronger starting point for growth in the third quarter, and we therefore expect another round of upward revisions to economic forecasts, which currently stand near 1.3% for this year according to the latest surveys. However, the improvement observed around midyear is unlikely to be sufficient to materially alter the structural growth outlook. In this context, Moody’s recent assessment is relevant: it acknowledged the possibility of upward adjustments to economic growth forecasts while maintaining the view that growth will remain below its long-term potential. Under this scenario, the economy could deliver a stronger cyclical performance in the short term, but without addressing the structural challenges that continue to constrain its growth capacity and the fiscal consolidation.
In our view, the July reading reinforces the narrative of a gradual recovery in economic activity during the second half of the year, albeit with still-significant differences across sectors. Stronger investment, construction, and some components associated with inventory replenishment suggest that growth could come in above the level expected at the beginning of the quarter. However, the persistent moderation in consumption and the formal labour market continue to limit the possibility of a broader and more sustained expansion. Thus, although growth expectations are likely to be revised upward further in the coming months, we believe the pace of expansion will remain moderate and below its long-term potential, which will continue to limit progress on fiscal consolidation and strengthening public finances.
DISCLAIMER
This report has been prepared by Scotiabank Economics as a resource for the clients of Scotiabank. Opinions, estimates and projections contained herein are our own as of the date hereof and are subject to change without notice. The information and opinions contained herein have been compiled or arrived at from sources believed reliable but no representation or warranty, express or implied, is made as to their accuracy or completeness. Neither Scotiabank nor any of its officers, directors, partners, employees or affiliates accepts any liability whatsoever for any direct or consequential loss arising from any use of this report or its contents.
These reports are provided to you for informational purposes only. This report is not, and is not constructed as, an offer to sell or solicitation of any offer to buy any financial instrument, nor shall this report be construed as an opinion as to whether you should enter into any swap or trading strategy involving a swap or any other transaction. The information contained in this report is not intended to be, and does not constitute, a recommendation of a swap or trading strategy involving a swap within the meaning of U.S. Commodity Futures Trading Commission Regulation 23.434 and Appendix A thereto. This material is not intended to be individually tailored to your needs or characteristics and should not be viewed as a “call to action” or suggestion that you enter into a swap or trading strategy involving a swap or any other transaction. Scotiabank may engage in transactions in a manner inconsistent with the views discussed this report and may have positions, or be in the process of acquiring or disposing of positions, referred to in this report.
Scotiabank, its affiliates and any of their respective officers, directors and employees may from time to time take positions in currencies, act as managers, co-managers or underwriters of a public offering or act as principals or agents, deal in, own or act as market makers or advisors, brokers or commercial and/or investment bankers in relation to securities or related derivatives. As a result of these actions, Scotiabank may receive remuneration. All Scotiabank products and services are subject to the terms of applicable agreements and local regulations. Officers, directors and employees of Scotiabank and its affiliates may serve as directors of corporations.
Any securities discussed in this report may not be suitable for all investors. Scotiabank recommends that investors independently evaluate any issuer and security discussed in this report, and consult with any advisors they deem necessary prior to making any investment.
This report and all information, opinions and conclusions contained in it are protected by copyright. This information may not be reproduced without the prior express written consent of Scotiabank.
™ Trademark of The Bank of Nova Scotia. Used under license, where applicable.
Scotiabank, together with “Global Banking and Markets”, is a marketing name for the global corporate and investment banking and capital markets businesses of The Bank of Nova Scotia and certain of its affiliates in the countries where they operate, including; Scotiabank Europe plc; Scotiabank (Ireland) Designated Activity Company; Scotiabank Inverlat S.A., Institución de Banca Múltiple, Grupo Financiero Scotiabank Inverlat, Scotia Inverlat Casa de Bolsa, S.A. de C.V., Grupo Financiero Scotiabank Inverlat, Scotia Inverlat Derivados S.A. de C.V. – all members of the Scotiabank group and authorized users of the Scotiabank mark. The Bank of Nova Scotia is incorporated in Canada with limited liability and is authorised and regulated by the Office of the Superintendent of Financial Institutions Canada. The Bank of Nova Scotia is authorized by the UK Prudential Regulation Authority and is subject to regulation by the UK Financial Conduct Authority and limited regulation by the UK Prudential Regulation Authority. Details about the extent of The Bank of Nova Scotia's regulation by the UK Prudential Regulation Authority are available from us on request. Scotiabank Europe plc is authorized by the UK Prudential Regulation Authority and regulated by the UK Financial Conduct Authority and the UK Prudential Regulation Authority.
Scotiabank Inverlat, S.A., Scotia Inverlat Casa de Bolsa, S.A. de C.V, Grupo Financiero Scotiabank Inverlat, and Scotia Inverlat Derivados, S.A. de C.V., are each authorized and regulated by the Mexican financial authorities.
Not all products and services are offered in all jurisdictions. Services described are available in jurisdictions where permitted by law.