Welcome to the first edition of Duty Calls, a new newsletter from Scotiabank Economics. This monthly report will detail trade shifts in North America, highlight what we’re seeing in today’s dynamic trade environment, and identify what it might mean for growth going forward.
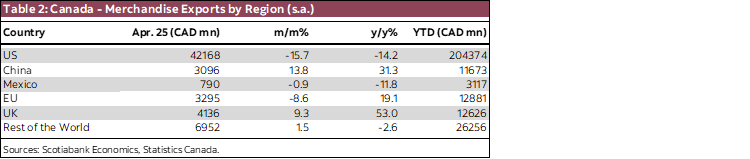
- April data showed the bite of tariffs, although declines are likely partially due to both the end of front-loading to pre-empt US tariffs, and exchange rate effects. Canadian exports dropped by 10.8% in April, following a 2.2% decline in March. Similar to March, exports to the US declined (-15.7%), while exports outside the US grew (+2.9%). US-bound exports declined for goods across the board, slowing in 10 of 11 product categories.
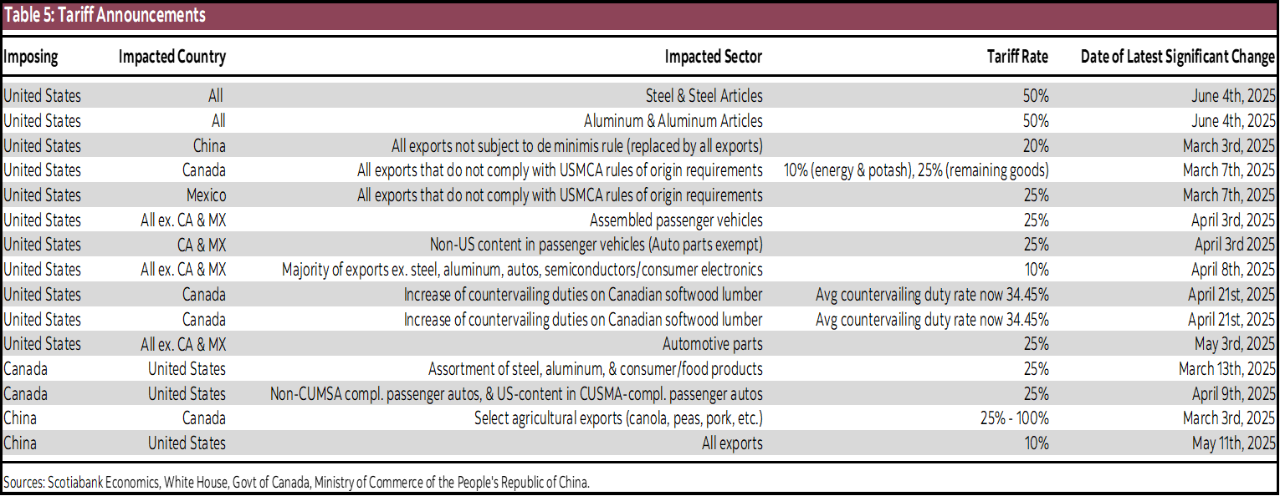
- For Canada, April marked the first full month with tariffs on non-CUSMA compliant goods, steel and aluminum, and autos. Canadian CUSMA compliance rates increased to 89%, while compliance for Mexican export to the US declined to 82%.
- The US trade outlook was even less favourable. US Census Bureau data indicates US imports declined by 16.3%, and goods imports declined by 19.1% (similarly impacted by frontloading). Large contributors to declines include imports of pharmaceuticals, finished metals, and passenger cars.
- For the US, recall that April figures reflect a different trade environment. At points that month, the US effective tariff rate on imports was 27%, and Chinese imports faced a 145% tariff. The current effective tariff rate on US imports is roughly 12%. Despite high export volumes, trade-related uncertainty data (which is out for May) declined from April levels, likely as a result of tariff reductions.
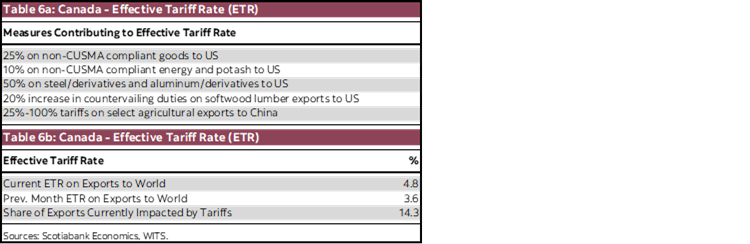
- Even if trade flows somewhat rebound next month, slowdowns could persist due to both policy and uncertainty. Measures in place currently avoid worst-case scenarios for Canada and Mexico (but are still significant). Carve-outs for automotive parts and USMCA compliance lessen effects, and the two countries currently face an effective tariff rate of <5% each. These levels, which were unthinkably high a year ago, align with more recent optimistic assumptions.
- Optimism is not solely a US trend. Exemptions offered by Canada’s government apply to roughly 30% of goods affected by import tariffs, reducing the impact of retaliatory efforts to an effective 1.6% rate on Canadian imports. These levels offer upside risks for growth if further climb downs occur, and intensification is avoided.
- Uncertainty remains high, given the number of variables. Upholding the repeal of IEEPA tariffs (which would see effective tariffs on US imports fall to roughly 4%, and Canadian and Mexican export rates decline to 2–2.3%) could be paired with (further) increasing/expanding Section 232 tariffs as substitutes. Repeal would still be favourable for Canada, even if Section 232 tariff remain, given easing of headwinds to global growth offers greater overseas export opportunities.
- In short: April data appears to represent a significant drop, but are also likely distorted by the end of frontloading as tariffs take effect. In the coming months, as the effects of tariffs continue to be felt, impacts on demand, inflation, investment and household spending should become clearer, as should their implications for the broader economic outlook.


DISCLAIMER
This report has been prepared by Scotiabank Economics as a resource for the clients of Scotiabank. Opinions, estimates and projections contained herein are our own as of the date hereof and are subject to change without notice. The information and opinions contained herein have been compiled or arrived at from sources believed reliable but no representation or warranty, express or implied, is made as to their accuracy or completeness. Neither Scotiabank nor any of its officers, directors, partners, employees or affiliates accepts any liability whatsoever for any direct or consequential loss arising from any use of this report or its contents.
These reports are provided to you for informational purposes only. This report is not, and is not constructed as, an offer to sell or solicitation of any offer to buy any financial instrument, nor shall this report be construed as an opinion as to whether you should enter into any swap or trading strategy involving a swap or any other transaction. The information contained in this report is not intended to be, and does not constitute, a recommendation of a swap or trading strategy involving a swap within the meaning of U.S. Commodity Futures Trading Commission Regulation 23.434 and Appendix A thereto. This material is not intended to be individually tailored to your needs or characteristics and should not be viewed as a “call to action” or suggestion that you enter into a swap or trading strategy involving a swap or any other transaction. Scotiabank may engage in transactions in a manner inconsistent with the views discussed this report and may have positions, or be in the process of acquiring or disposing of positions, referred to in this report.
Scotiabank, its affiliates and any of their respective officers, directors and employees may from time to time take positions in currencies, act as managers, co-managers or underwriters of a public offering or act as principals or agents, deal in, own or act as market makers or advisors, brokers or commercial and/or investment bankers in relation to securities or related derivatives. As a result of these actions, Scotiabank may receive remuneration. All Scotiabank products and services are subject to the terms of applicable agreements and local regulations. Officers, directors and employees of Scotiabank and its affiliates may serve as directors of corporations.
Any securities discussed in this report may not be suitable for all investors. Scotiabank recommends that investors independently evaluate any issuer and security discussed in this report, and consult with any advisors they deem necessary prior to making any investment.
This report and all information, opinions and conclusions contained in it are protected by copyright. This information may not be reproduced without the prior express written consent of Scotiabank.
™ Trademark of The Bank of Nova Scotia. Used under license, where applicable.
Scotiabank, together with “Global Banking and Markets”, is a marketing name for the global corporate and investment banking and capital markets businesses of The Bank of Nova Scotia and certain of its affiliates in the countries where they operate, including; Scotiabank Europe plc; Scotiabank (Ireland) Designated Activity Company; Scotiabank Inverlat S.A., Institución de Banca Múltiple, Grupo Financiero Scotiabank Inverlat, Scotia Inverlat Casa de Bolsa, S.A. de C.V., Grupo Financiero Scotiabank Inverlat, Scotia Inverlat Derivados S.A. de C.V. – all members of the Scotiabank group and authorized users of the Scotiabank mark. The Bank of Nova Scotia is incorporated in Canada with limited liability and is authorised and regulated by the Office of the Superintendent of Financial Institutions Canada. The Bank of Nova Scotia is authorized by the UK Prudential Regulation Authority and is subject to regulation by the UK Financial Conduct Authority and limited regulation by the UK Prudential Regulation Authority. Details about the extent of The Bank of Nova Scotia's regulation by the UK Prudential Regulation Authority are available from us on request. Scotiabank Europe plc is authorized by the UK Prudential Regulation Authority and regulated by the UK Financial Conduct Authority and the UK Prudential Regulation Authority.
Scotiabank Inverlat, S.A., Scotia Inverlat Casa de Bolsa, S.A. de C.V, Grupo Financiero Scotiabank Inverlat, and Scotia Inverlat Derivados, S.A. de C.V., are each authorized and regulated by the Mexican financial authorities.
Not all products and services are offered in all jurisdictions. Services described are available in jurisdictions where permitted by law.