This monthly report will detail trade shifts in North America, highlight what we’re seeing in today’s dynamic trade environment, and identify what it might mean for growth going forward.
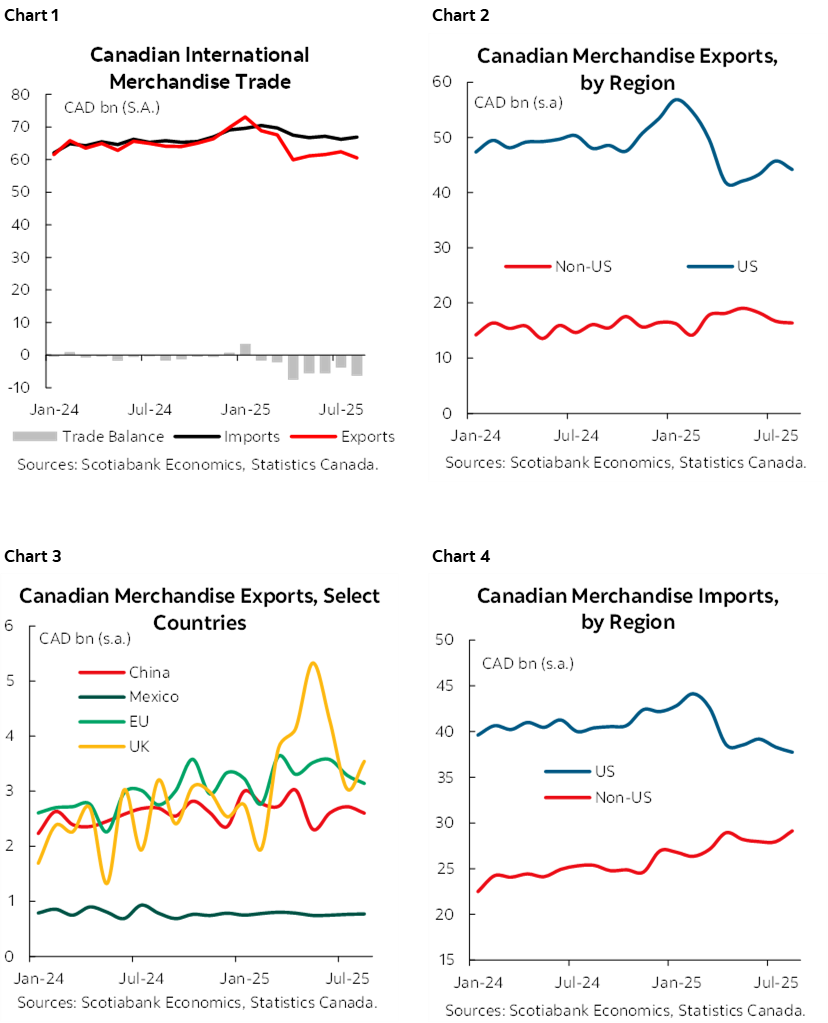
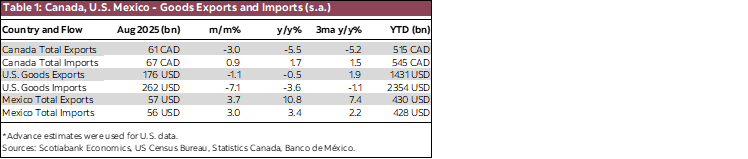
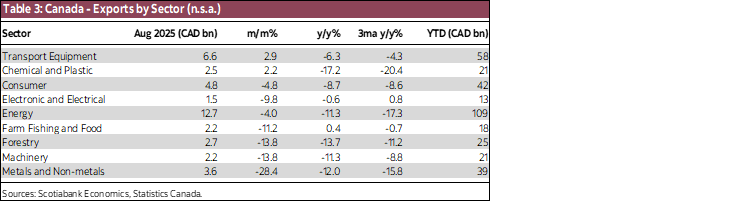
- Canada’s goods exports fell back again in August, after having improved slightly in the previous three months following the large drop in April. Exports fell by 3.0% and imports increased by 0.9%, increasing the goods trade deficit to $6.3 bn. The export categories with the largest declines in August were metals (led by unwrought gold), industrial machinery and parts, forestry products, and motor vehicles and parts.
- On a year-over-year basis, Canadian goods exports were down 5.5% in August, and down 5.2% on average over the last three months (Jun–Aug)—with the largest percentage declines in industrial chemicals, metals, energy products, and forestry products. Imports were up 1.7% in August, and up 1.5% on average since June.
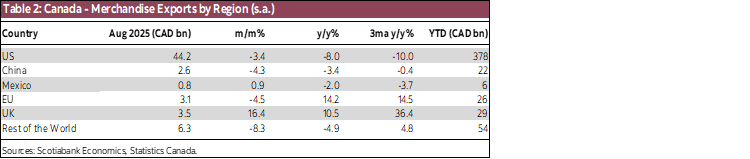
- The share of Canadian exports bound for US declined from 76% in 2024 to 72% in August, driven by a marked decline in exports to the US in 2025 and only modest growth in exports to other countries. Exports to the US were down 3.4% m/m and 8.0% y/y. Exports to other countries fell 2.0% m/m but were up 1.8% y/y.
- Canada’s trade in services with the US is much smaller than trade in goods, but has been much more stable. It has even improved from a small deficit at the end of 2024 to a surplus of $0.3 bn as of August, thanks to further growth in commercial services exports and a 10% decline in travel imports (i.e., international vacations).
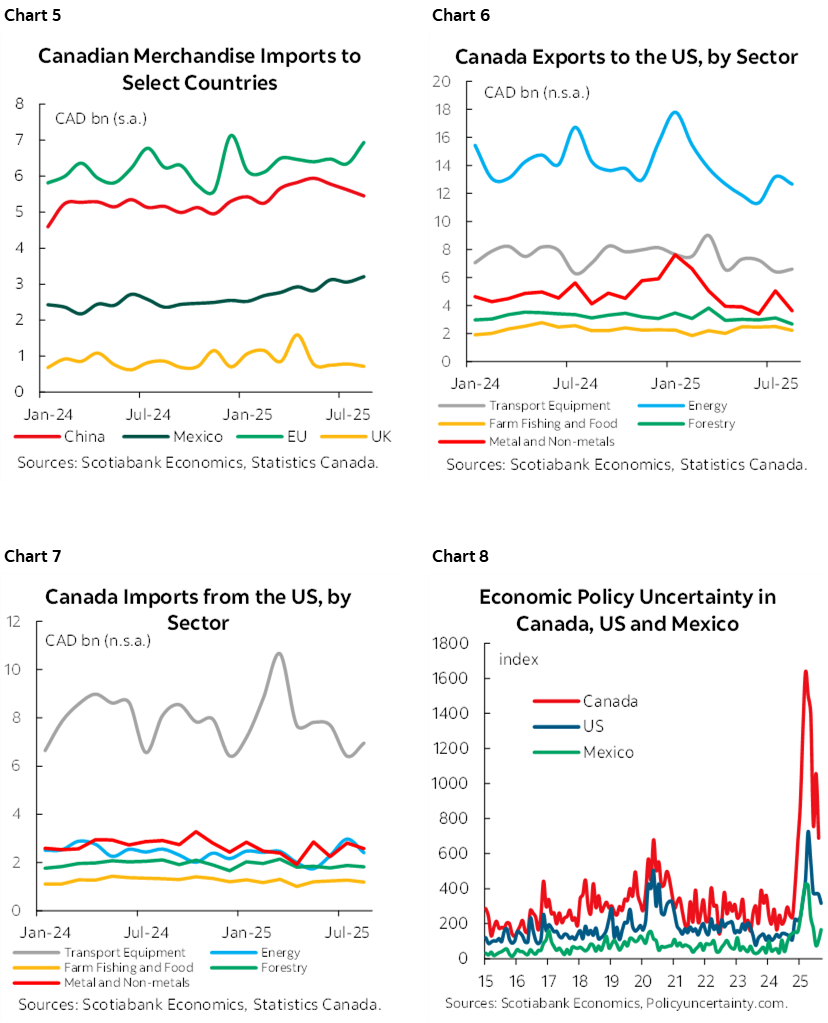
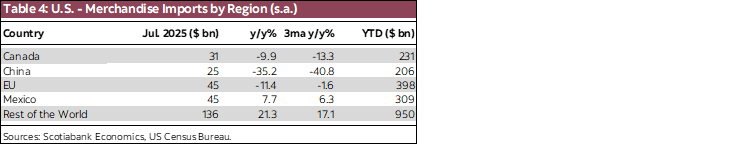
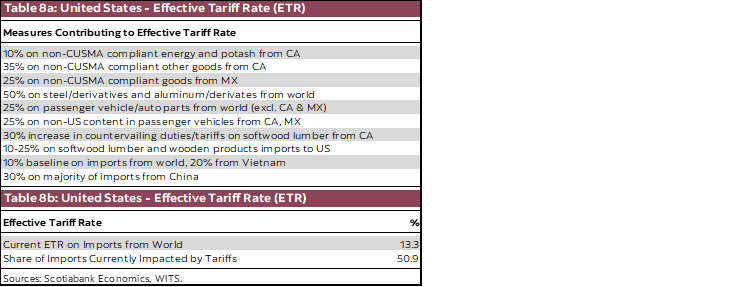
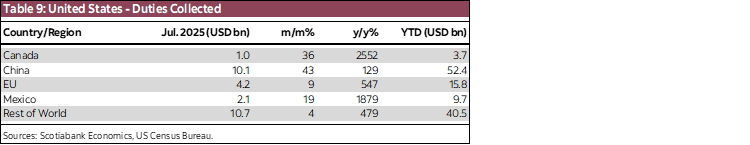
- After widening drastically early in the year on tariff-front-running imports, the US trade deficit has returned to roughly its 2024 level. However, there have been compositional changes to US trade flows. As of July, US imports were running significantly lower y/y from Canada (-10%), the EU (-11%), and China (-35%), and higher from Mexico (+11%) and the rest of the world (+21%).
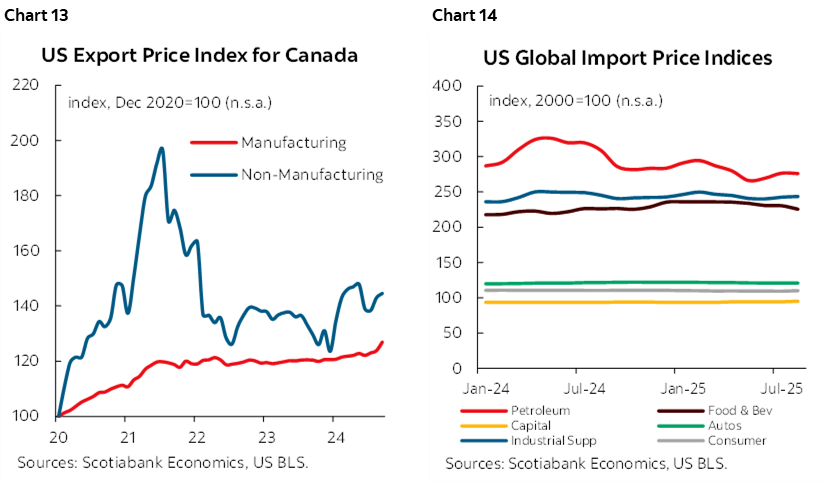
- US customs data show that the proportion of Canadian goods imported into the US facing tariffs has stabilized at around 10%, down from 20% (due to the increased incentive for firms to submit CUSMA compliance paperwork).
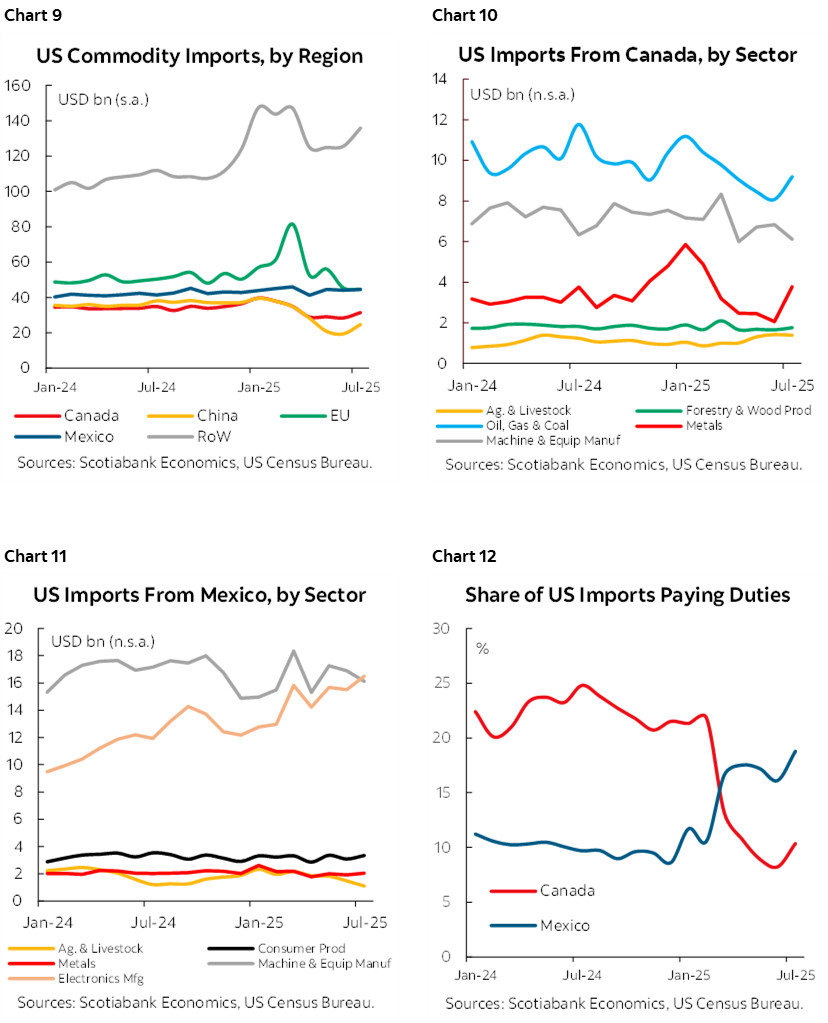
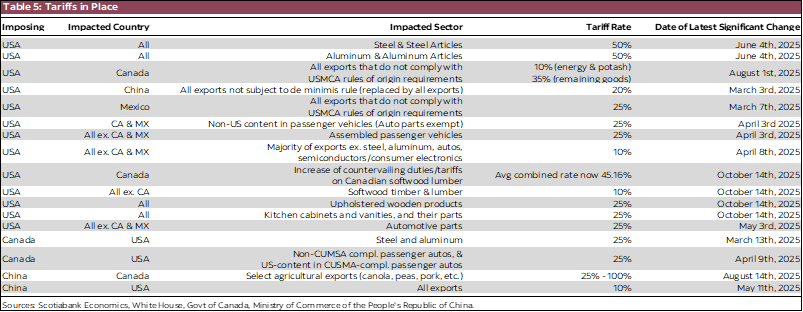
- While uncertainty and effective tariff rates have come down from the peaks of the spring, they remain elevated and continue to weigh on growth around the world. In addition, new US tariff announcements on pharmaceuticals, furniture, and heavy trucks demonstrate the continued fluidity of the global trade landscape.
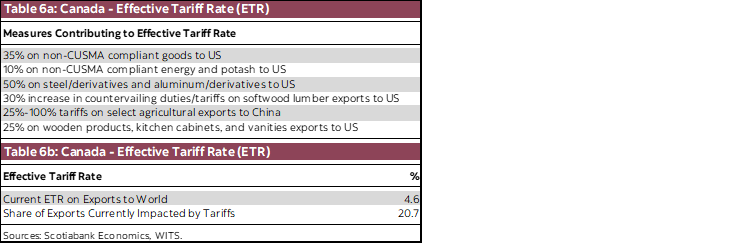
- Canada continues to benefit from a low effective tariff rate on exports (4.6% is our estimate) thanks to most of our trade continuing on a free-trade basis under CUSMA. However, most of the Canadian industries impacted by the sectoral tariffs have seen clear export declines—especially steel, aluminum, and forestry products.
- Some relief for Canada from some of the sectoral tariffs—as is apparently under discussion—would provide a welcome boost to these industries, but it is difficult to be very confident that the relief would be permanently maintained and/or not offset by new tariffs. As a result, we expect that US tariffs will continue to weigh on growth for the foreseeable future.

DISCLAIMER
This report has been prepared by Scotiabank Economics as a resource for the clients of Scotiabank. Opinions, estimates and projections contained herein are our own as of the date hereof and are subject to change without notice. The information and opinions contained herein have been compiled or arrived at from sources believed reliable but no representation or warranty, express or implied, is made as to their accuracy or completeness. Neither Scotiabank nor any of its officers, directors, partners, employees or affiliates accepts any liability whatsoever for any direct or consequential loss arising from any use of this report or its contents.
These reports are provided to you for informational purposes only. This report is not, and is not constructed as, an offer to sell or solicitation of any offer to buy any financial instrument, nor shall this report be construed as an opinion as to whether you should enter into any swap or trading strategy involving a swap or any other transaction. The information contained in this report is not intended to be, and does not constitute, a recommendation of a swap or trading strategy involving a swap within the meaning of U.S. Commodity Futures Trading Commission Regulation 23.434 and Appendix A thereto. This material is not intended to be individually tailored to your needs or characteristics and should not be viewed as a “call to action” or suggestion that you enter into a swap or trading strategy involving a swap or any other transaction. Scotiabank may engage in transactions in a manner inconsistent with the views discussed this report and may have positions, or be in the process of acquiring or disposing of positions, referred to in this report.
Scotiabank, its affiliates and any of their respective officers, directors and employees may from time to time take positions in currencies, act as managers, co-managers or underwriters of a public offering or act as principals or agents, deal in, own or act as market makers or advisors, brokers or commercial and/or investment bankers in relation to securities or related derivatives. As a result of these actions, Scotiabank may receive remuneration. All Scotiabank products and services are subject to the terms of applicable agreements and local regulations. Officers, directors and employees of Scotiabank and its affiliates may serve as directors of corporations.
Any securities discussed in this report may not be suitable for all investors. Scotiabank recommends that investors independently evaluate any issuer and security discussed in this report, and consult with any advisors they deem necessary prior to making any investment.
This report and all information, opinions and conclusions contained in it are protected by copyright. This information may not be reproduced without the prior express written consent of Scotiabank.
™ Trademark of The Bank of Nova Scotia. Used under license, where applicable.
Scotiabank, together with “Global Banking and Markets”, is a marketing name for the global corporate and investment banking and capital markets businesses of The Bank of Nova Scotia and certain of its affiliates in the countries where they operate, including; Scotiabank Europe plc; Scotiabank (Ireland) Designated Activity Company; Scotiabank Inverlat S.A., Institución de Banca Múltiple, Grupo Financiero Scotiabank Inverlat, Scotia Inverlat Casa de Bolsa, S.A. de C.V., Grupo Financiero Scotiabank Inverlat, Scotia Inverlat Derivados S.A. de C.V. – all members of the Scotiabank group and authorized users of the Scotiabank mark. The Bank of Nova Scotia is incorporated in Canada with limited liability and is authorised and regulated by the Office of the Superintendent of Financial Institutions Canada. The Bank of Nova Scotia is authorized by the UK Prudential Regulation Authority and is subject to regulation by the UK Financial Conduct Authority and limited regulation by the UK Prudential Regulation Authority. Details about the extent of The Bank of Nova Scotia's regulation by the UK Prudential Regulation Authority are available from us on request. Scotiabank Europe plc is authorized by the UK Prudential Regulation Authority and regulated by the UK Financial Conduct Authority and the UK Prudential Regulation Authority.
Scotiabank Inverlat, S.A., Scotia Inverlat Casa de Bolsa, S.A. de C.V, Grupo Financiero Scotiabank Inverlat, and Scotia Inverlat Derivados, S.A. de C.V., are each authorized and regulated by the Mexican financial authorities.
Not all products and services are offered in all jurisdictions. Services described are available in jurisdictions where permitted by law.