HIGHLIGHTS
- The note provides some estimates of the impacts of the U.S. tariffs on growth and employment in Canada’s provinces, derived from our macroeconometric model.
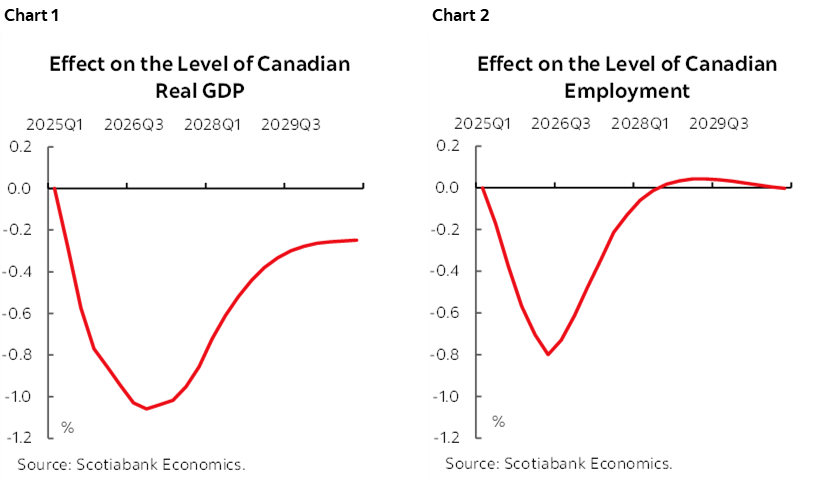
- We first estimate the impacts of the tariffs on the total Canadian economy, including that the level of GDP will be 1.1% lower by the end of 2026 compared to a non-tariff scenario.
- We then decompose these estimates into provincial impacts, in line with each province’s estimated effective tariff rate and U.S. exports as a share of GDP.
- Using this approach, we find that Ontario and Quebec will face the largest impacts, including through GDP being 1.4% lower by the end of 2026 compared to a non-tariff scenario. New Brunswick and Alberta follow with declines of 1.0% and 0.9% respectively.
- This approach takes into account some of the structural differences between the provincial economies, including differing industrial composition and U.S. trade exposures. However, it does not have granular assumptions or estimates for each sector or good. As a result, judgement is required in incorporating these estimates to our provincial outlook.
MODEL ESTIMATE OF TARIFF IMPACTS
We have published a number of pieces that outline estimates from our macroeconomic model of the impacts of the U.S. tariffs on the Canadian economy under different scenarios, including this and this.
Tariffs reduce potential GDP as they distort optimal allocation of resources, increase the cost of imported inputs for production, and create supply bottlenecks and supply chain disruptions. This reduces potential GDP and creates inflationary pressures. The inflationary pressures are further amplified by the direct price effects of tariffs in the event of a retaliation. Tariffs also generate a fall of aggregate demand because of the elevated uncertainty related to trade policies and potentially a fall of net exports.
The U.S. tariffs have weakened economic growth in its own economy, while also putting upward pressure on inflation. Lower demand from the United States combined with the negative effects of uncertainty in our economy has slowed the rate of growth in Canada.
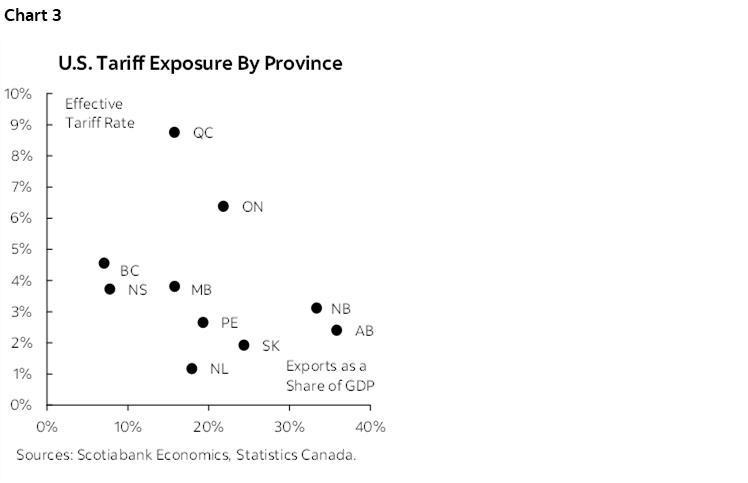
Based on our latest calculations of the effective tariff rates facing Canadian exports to the United States and Canadian imports from the United States, our model indicates that the impact on the level of Canadian GDP will peak at around -1.1% at the end of 2026 (chart 1), and cause the level of the GDP to be lower by 0.4% on average in 2025 and 1.0% in both 2026 and 2027 compared to a non-tariff scenario. Looking at employment impacts, the model indicates that impacts on Canadian employment will peak at -0.8% in mid-2026 (chart 2), and that the level of employment in Canada will be 0.3% lower this year and 0.7% lower next year.
PROVINCIAL TRADE EXPOSURES
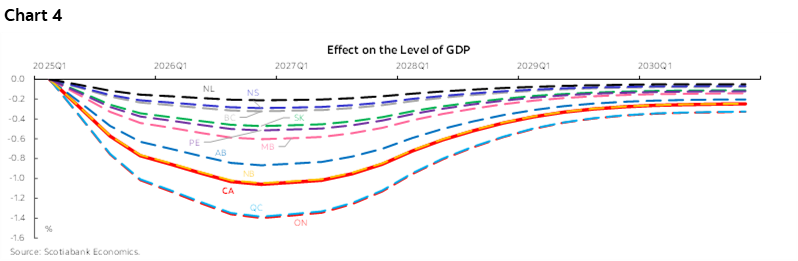
Canada’s provinces face varying levels of exposure to U.S. trade risks. Each provincial economy has its own unique composition, and therefore faces a different proportion of its exports that are directly impacted by the U.S. tariffs, as well as a different average tariff rate given the multiple tariff rates. The provinces with large sectors targeted by the Section 232 sectoral tariffs (e.g., steel and aluminum, auto manufacturing, etc.) face the highest estimated effective tariff rates, as most other Canada-U.S. trade is continuing on a mainly tariff-free basis. Quebec and Ontario fare the worst on this metric, given their large steel and aluminum sectors. The provinces that export mainly energy products to the U.S. face the lowest effective tariff rates, given that energy products are either exempt under CUSMA or face lower tariffs than other goods.
Provinces are also more exposed to tariff risk if they are accustomed to exporting significant amounts of their economic output to the U.S. market. Exports to the U.S. represent more than 30% of the annual economic output of Alberta and New Brunswick, though most of this is energy exports, which face a much lower tariff rate than steel and aluminum. In contrast, U.S. exports have comprised less than 10% of provincial GDP in British Columbia and Nova Scotia, reducing the expected impacts of U.S. tariffs in these provinces.
The combined effect of these two variables (chart 3) helps us estimate the overall U.S. tariff exposure of each province.
We decompose the estimated national impacts into provincial impacts in line with the combination of the two U.S. tariff exposure variables for each province. This approach provides a straightforward avenue to take into account some of the structural differences between the provincial economies, including differing industrial structures and U.S. trade exposures. However, it does not have granular assumptions or estimates for each sector or good.
RESULTS
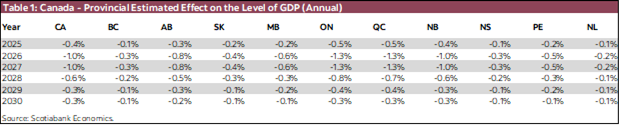
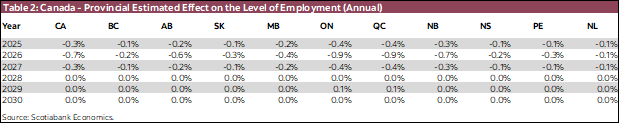
The result indicate that Ontario and Quebec will face the largest impacts. The level of GDP in these provinces is estimated to be 1.4% lower by the end of 2026 (chart 4), and be lower on average by 1.3% for calendar years 2026 and 2027 (table 1). Employment around 1% lower is expected in these provinces by mid-2026, with 2026 as a whole averaging 0.9% lower (table 2). New Brunswick is estimated to face impacts in line with the estimates for the Canadian economy as a whole. Other provinces are estimated to feel impacts below the national average.
The results require some caveats. The approach in this exercise assumes that all industries behave the same at a given level of tariff and trade exposure. As a result, some judgement is required in incorporating these estimates into our provincial economic outlook. For example, it may be reasonable to assume that a manufacturing plant may have a larger elasticity of supply than an oil well, given that it faces a higher marginal cost of production. As a result, the impacts on Ontario and Quebec could reasonably be expected to be even larger than the modeling estimates.
Some provinces are also facing impacts from China’s tariffs on canola and seafood products. While outside the scope of this exercise, we anticipate the largest impacts on Saskatchewan, Manitoba, and Nova Scotia, given their higher exposure to these tariffs.
In addition to impacts through trade channels, provinces are also dealing with varying underlying situations in their domestic economies. Housing markets at different stages of growth or consolidation, household balance sheets with different average levels of leverage, etc., are also driving differentiated growth paths across provinces during this trade and uncertainty shock.
Our latest provincial economic forecasts can be found here.
DISCLAIMER
This report has been prepared by Scotiabank Economics as a resource for the clients of Scotiabank. Opinions, estimates and projections contained herein are our own as of the date hereof and are subject to change without notice. The information and opinions contained herein have been compiled or arrived at from sources believed reliable but no representation or warranty, express or implied, is made as to their accuracy or completeness. Neither Scotiabank nor any of its officers, directors, partners, employees or affiliates accepts any liability whatsoever for any direct or consequential loss arising from any use of this report or its contents.
These reports are provided to you for informational purposes only. This report is not, and is not constructed as, an offer to sell or solicitation of any offer to buy any financial instrument, nor shall this report be construed as an opinion as to whether you should enter into any swap or trading strategy involving a swap or any other transaction. The information contained in this report is not intended to be, and does not constitute, a recommendation of a swap or trading strategy involving a swap within the meaning of U.S. Commodity Futures Trading Commission Regulation 23.434 and Appendix A thereto. This material is not intended to be individually tailored to your needs or characteristics and should not be viewed as a “call to action” or suggestion that you enter into a swap or trading strategy involving a swap or any other transaction. Scotiabank may engage in transactions in a manner inconsistent with the views discussed this report and may have positions, or be in the process of acquiring or disposing of positions, referred to in this report.
Scotiabank, its affiliates and any of their respective officers, directors and employees may from time to time take positions in currencies, act as managers, co-managers or underwriters of a public offering or act as principals or agents, deal in, own or act as market makers or advisors, brokers or commercial and/or investment bankers in relation to securities or related derivatives. As a result of these actions, Scotiabank may receive remuneration. All Scotiabank products and services are subject to the terms of applicable agreements and local regulations. Officers, directors and employees of Scotiabank and its affiliates may serve as directors of corporations.
Any securities discussed in this report may not be suitable for all investors. Scotiabank recommends that investors independently evaluate any issuer and security discussed in this report, and consult with any advisors they deem necessary prior to making any investment.
This report and all information, opinions and conclusions contained in it are protected by copyright. This information may not be reproduced without the prior express written consent of Scotiabank.
™ Trademark of The Bank of Nova Scotia. Used under license, where applicable.
Scotiabank, together with “Global Banking and Markets”, is a marketing name for the global corporate and investment banking and capital markets businesses of The Bank of Nova Scotia and certain of its affiliates in the countries where they operate, including; Scotiabank Europe plc; Scotiabank (Ireland) Designated Activity Company; Scotiabank Inverlat S.A., Institución de Banca Múltiple, Grupo Financiero Scotiabank Inverlat, Scotia Inverlat Casa de Bolsa, S.A. de C.V., Grupo Financiero Scotiabank Inverlat, Scotia Inverlat Derivados S.A. de C.V. – all members of the Scotiabank group and authorized users of the Scotiabank mark. The Bank of Nova Scotia is incorporated in Canada with limited liability and is authorised and regulated by the Office of the Superintendent of Financial Institutions Canada. The Bank of Nova Scotia is authorized by the UK Prudential Regulation Authority and is subject to regulation by the UK Financial Conduct Authority and limited regulation by the UK Prudential Regulation Authority. Details about the extent of The Bank of Nova Scotia's regulation by the UK Prudential Regulation Authority are available from us on request. Scotiabank Europe plc is authorized by the UK Prudential Regulation Authority and regulated by the UK Financial Conduct Authority and the UK Prudential Regulation Authority.
Scotiabank Inverlat, S.A., Scotia Inverlat Casa de Bolsa, S.A. de C.V, Grupo Financiero Scotiabank Inverlat, and Scotia Inverlat Derivados, S.A. de C.V., are each authorized and regulated by the Mexican financial authorities.
Not all products and services are offered in all jurisdictions. Services described are available in jurisdictions where permitted by law.