CANADA HOUSING MARKET: ALL WE WANT FOR CHRISTMAS IS MORE SUPPLY!
SUMMARY
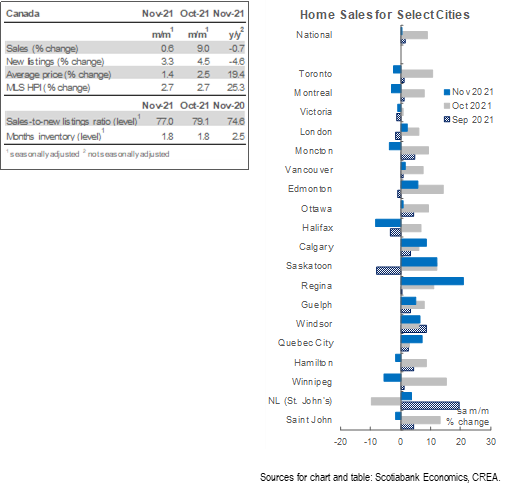
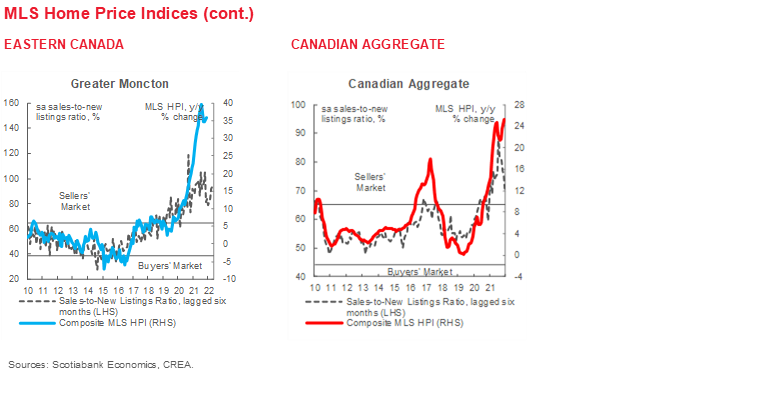
Canadian home sales rose by 0.6% (sa m/m) in November, while listings recorded a welcome 3.3% (sa m/m) gain. The larger increase in listings lowered the sales-to-new listings ratio, an indicator of how tight the market is, to 77%—still significantly higher than its long-term average of 54.5%. As a result of these historically tight market conditions, the composite MLS Home Price Index (HPI) rose by 2.7% (sa m/m), maintaining its October pace. November’s price gain seems to have been equally driven by all home-type segments.
Movements in the market were less broad-based in November, with sales gains in parts of the country somewhat offsetting declines elsewhere. Sales went up in 18 of 31 local markets we track. Regina recorded the largest increase (21% sa m/m) followed by Saskatoon, PEI, Okanagan-Mainline, and Calgary—all recording increases of 9% or over (sa m/m). St. Catharines and Thunder Bay recorded the biggest declines (over 14% sa m/m), with the primary Toronto and Montreal markets slowing by around 3% (sa m/m). Despite what looks like a small monthly increase, the sales volumes remain at a record high. Indeed, November’s national level of sales is historically strong—the second highest on record for November after November 2020, and a remarkable 41% (sa) higher than the 2000–2019 November-average.
The increase in listings was also fairly evenly split among the different local markets, but was stronger than sales. Of our 31 markets, listings went up in 19, of which 10 also saw sales gains. The negligible resulting reduction in the sales-to-new listings ratio did not reduce the number of our local centres in sellers’ market territory, which remain at 25. Months of inventory continued to decline, falling to 1.8 months in November—matching their lowest level on record that was reached in March 2021, far below their long-term average of 5 months. Months of inventory were at record lows in British Colombia, Ontario, Quebec, and New Brunswick.
All home types contributed relatively equally to this month’s price gains, with townhouses experiencing the biggest acceleration compared to October. The MLS HPI for the segment increased by 2.8% (sa m/m), while single family homes increased by 2.7% and apartments by 2.6% (sa m/m)—roughly the same as their October paces. On the whole, the composite MLS HPI for all homes in Canada was 25.3% (nsa y/y) higher in November 2021 compared to the same month last year—the largest year-over-year increase on record.
IMPLICATIONS
Canadian home sales continued the upward climb they started in September, increasing by 0.6% in November—while a small increase on the surface, this follows a 9% increase in October, the largest since July 2020. With the rises of the past couple of months, 2021 level of sales so far has already broken last year’s record. This comes after a reprieve during the summer months, which we warned would be short-lived as buyers were expected to return to the fall market after having taken a well-needed break from losing brutal bidding wars to enjoy the double-vaccinated summer and, for some, to save for a larger down payment to qualify under the new stress testing rules. Similarly, the housing market is also slower this time of year as people focus on celebrating the holidays, so don’t be fooled by a calmer December and January.
The increase in sales is backed by strong demand fundamentals, rooted in a strong economic recovery, a labour market that has more than recovered its COVID-19 losses, and an acceleration in immigration. While immigration numbers lag a month, they continue to point to a doubling down on the government’s efforts to meet its immigration target for the year. October’s admissions broke the record set just the month before as Canada welcomed 46,315 new immigrants, the highest in Canada’s modern history, bringing forward the progress toward meeting the year’s target from 67% to 78%.
However, another factor is clearly at play in this year’s housing rally—investors. The increase in immigration and return of international students have at least partly stimulated investors’ demand who look to rent to these segments of the population. Multiple data points suggest a significant pick-up in investors’ activity this year. Data from the Bank of Canada breaking down the year-over-year increase in the number of new mortgages by purchaser type point to an influx of investors to the market in 2021Q2. Compared to the same time last year, new home purchases by investors were 100% higher, compared to 65% by repeat-home buyers and around 50% by first-time home buyers. This is consistent with data from Equifax, which show the number of people with more than 4 mortgages in 2021Q2 was 7.7% higher than last year, whereas those with 1 mortgage were 3% higher. Data from Teranet show that as of August of this year, 25% of Ontario buyers were multiple property owners, making it the largest buyer segment and setting a record.
Overall, there are more mortgages being taken out today compared to pre-pandemic, regardless of who is taking them out, and those mortgages are increasingly fatter too. Overall new mortgage volumes increased by 60% in 2021Q2 compared to the same time last year—reaching their highest level ever recorded in a single quarter. The average loan amount for new mortgages simultaneously increased by 22% over the same period. At these higher mortgage amounts, borrowers are more sensitive to rate hikes which translate into relatively large increases in interest payments over the term of the mortgage. The Bank of Canada is expected to raise rates multiple times next year, starting as soon as April. The more hawkish stance taken by the Bank in the face of rising inflationary pressures and persistent supply bottlenecks have pushed bond yields further and with them the closely tied fixed mortgage rates. While these higher fixed rates should slow borrowing activity, they are equally likely to create a short-term surge in borrowing as borrowers rush to lock in lower rates—new mortgage originations and sales data over the next few months will help assess the extent of this unintended consequence of rising rates.
We currently have the Bank raising its rate by a total of 100 bps in 2022, and another 100 bps in 2023. Calculations with Brett House show that for those who will be renewing their five-year term mortgages in 2022 and 2023, this will translate to an average increase in their mortgage rates by 36 and 45 bps. Luckily, the rates at which these borrowers had to qualify were well above current and likely future market rates.
Another aspect of rising rates worth keeping an eye on in the next little while is their impact on investors’ activity, which is more speculative in nature and more sensitive to expectations of higher borrowing costs and lower profitability. With a larger share of investors in the buyers’ pool, rate increases may result in a disproportionate fall in demand, alleviating some of the pressure off the market. However, as this pandemic taught us, you can’t be sure of the housing market’s mood until you see the data, and with robust labour market outcomes and immigration levels, demand fundamentals remain strong.
The other side of the coin has generally borne little to no good news this year, with listings typically not keeping up in the face of ongoing rising demand. Although listings happily went up in November, it was a far cry from what is needed to catch up to sales, which continued to sustain tight market conditions and push prices upwards. A survey by Mustel Group and Sotheby’s International Realty Canada last week reported that over 80% of 18–28-year-old Canadians are worried they will never be able to afford purchasing their first home in their city of choice due to the continuous increase in prices, with the top barrier being the ability to save for a down payment while covering current living expenses. 50% reported fully giving up on their dream of owning a single-family home. While the sample size is quite small, it is not hard to believe this sentiment is shared among many young Canadians who have been watching the action from the sidelines. For many, their best bet is finding a nicely wrapped down payment under the tree. Since the housing market is typically slower during this time a year, we will likely have to wait until the spring to see how many made it onto the housing Santa’s good buyers’ list.
DISCLAIMER
This report has been prepared by Scotiabank Economics as a resource for the clients of Scotiabank. Opinions, estimates and projections contained herein are our own as of the date hereof and are subject to change without notice. The information and opinions contained herein have been compiled or arrived at from sources believed reliable but no representation or warranty, express or implied, is made as to their accuracy or completeness. Neither Scotiabank nor any of its officers, directors, partners, employees or affiliates accepts any liability whatsoever for any direct or consequential loss arising from any use of this report or its contents.
These reports are provided to you for informational purposes only. This report is not, and is not constructed as, an offer to sell or solicitation of any offer to buy any financial instrument, nor shall this report be construed as an opinion as to whether you should enter into any swap or trading strategy involving a swap or any other transaction. The information contained in this report is not intended to be, and does not constitute, a recommendation of a swap or trading strategy involving a swap within the meaning of U.S. Commodity Futures Trading Commission Regulation 23.434 and Appendix A thereto. This material is not intended to be individually tailored to your needs or characteristics and should not be viewed as a “call to action” or suggestion that you enter into a swap or trading strategy involving a swap or any other transaction. Scotiabank may engage in transactions in a manner inconsistent with the views discussed this report and may have positions, or be in the process of acquiring or disposing of positions, referred to in this report.
Scotiabank, its affiliates and any of their respective officers, directors and employees may from time to time take positions in currencies, act as managers, co-managers or underwriters of a public offering or act as principals or agents, deal in, own or act as market makers or advisors, brokers or commercial and/or investment bankers in relation to securities or related derivatives. As a result of these actions, Scotiabank may receive remuneration. All Scotiabank products and services are subject to the terms of applicable agreements and local regulations. Officers, directors and employees of Scotiabank and its affiliates may serve as directors of corporations.
Any securities discussed in this report may not be suitable for all investors. Scotiabank recommends that investors independently evaluate any issuer and security discussed in this report, and consult with any advisors they deem necessary prior to making any investment.
This report and all information, opinions and conclusions contained in it are protected by copyright. This information may not be reproduced without the prior express written consent of Scotiabank.
™ Trademark of The Bank of Nova Scotia. Used under license, where applicable.
Scotiabank, together with “Global Banking and Markets”, is a marketing name for the global corporate and investment banking and capital markets businesses of The Bank of Nova Scotia and certain of its affiliates in the countries where they operate, including; Scotiabank Europe plc; Scotiabank (Ireland) Designated Activity Company; Scotiabank Inverlat S.A., Institución de Banca Múltiple, Grupo Financiero Scotiabank Inverlat, Scotia Inverlat Casa de Bolsa, S.A. de C.V., Grupo Financiero Scotiabank Inverlat, Scotia Inverlat Derivados S.A. de C.V. – all members of the Scotiabank group and authorized users of the Scotiabank mark. The Bank of Nova Scotia is incorporated in Canada with limited liability and is authorised and regulated by the Office of the Superintendent of Financial Institutions Canada. The Bank of Nova Scotia is authorized by the UK Prudential Regulation Authority and is subject to regulation by the UK Financial Conduct Authority and limited regulation by the UK Prudential Regulation Authority. Details about the extent of The Bank of Nova Scotia's regulation by the UK Prudential Regulation Authority are available from us on request. Scotiabank Europe plc is authorized by the UK Prudential Regulation Authority and regulated by the UK Financial Conduct Authority and the UK Prudential Regulation Authority.
Scotiabank Inverlat, S.A., Scotia Inverlat Casa de Bolsa, S.A. de C.V, Grupo Financiero Scotiabank Inverlat, and Scotia Inverlat Derivados, S.A. de C.V., are each authorized and regulated by the Mexican financial authorities.
Not all products and services are offered in all jurisdictions. Services described are available in jurisdictions where permitted by law.