CANADA HOUSING MARKET: HELLO SPRING (MARKET)
SUMMARY
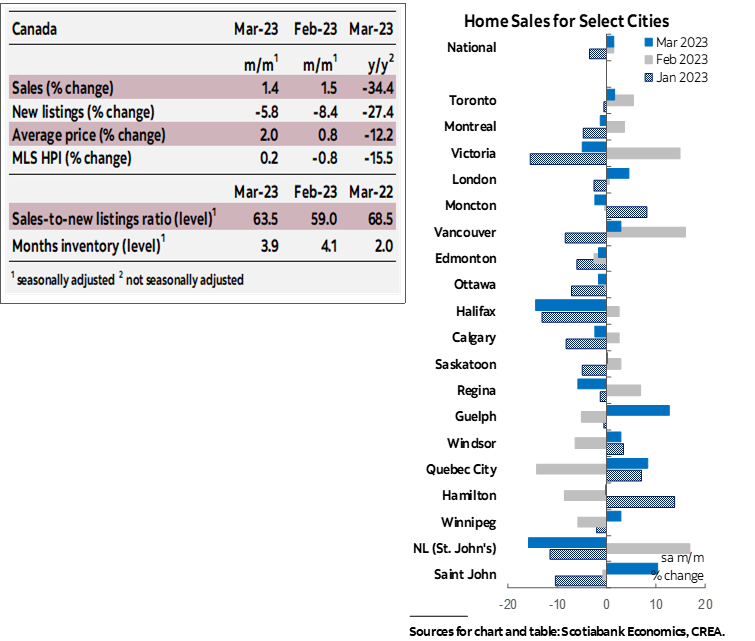
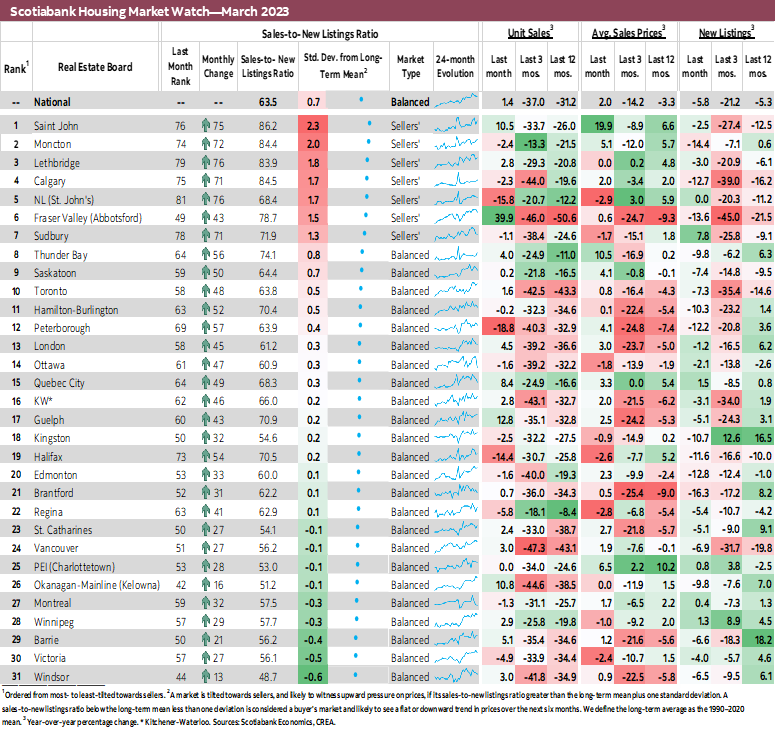
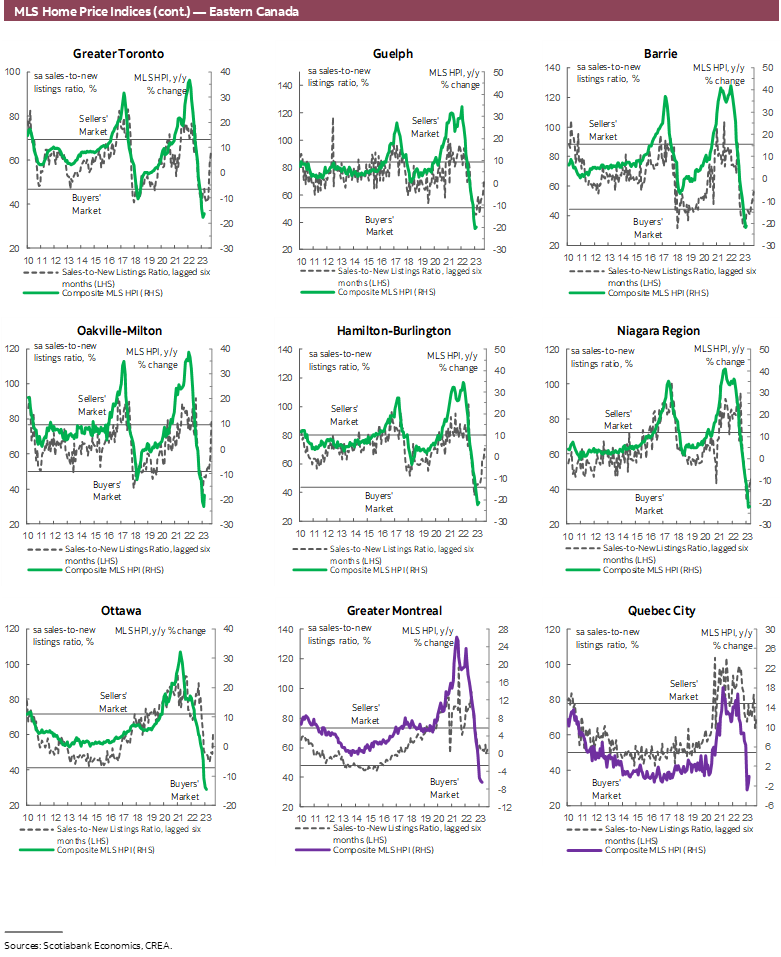
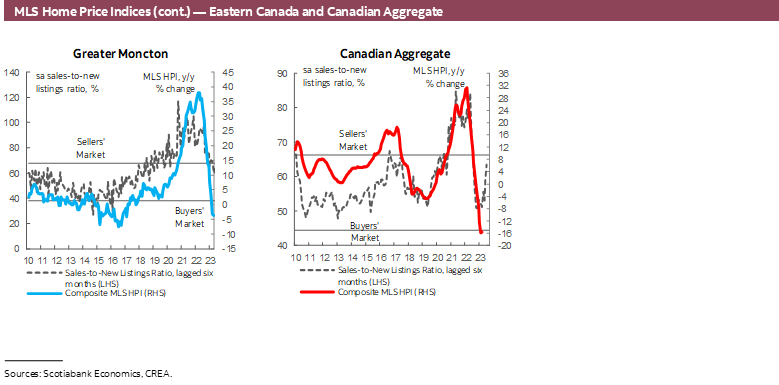
Canadian home sales rose 1.4% (sa m/m) in March, despite listings dropping by 5.8%, having declined by almost 8% in the previous month. Two consecutive months of sales increases of the same size combined with two consecutive months of significantly larger declines in listings pushed the sales-to-new listings ratio, an indicator of how tight the market is, to 63.5%—the tightest since last April and above the long-term average of 55.1%. However, the national housing market remained in balanced territory. Months of inventory declined for the second month in a row, reversing an easing trend that had been in motion since the fall of 2021 and dropped to 3.9 months—more than a full month below its long-term average.
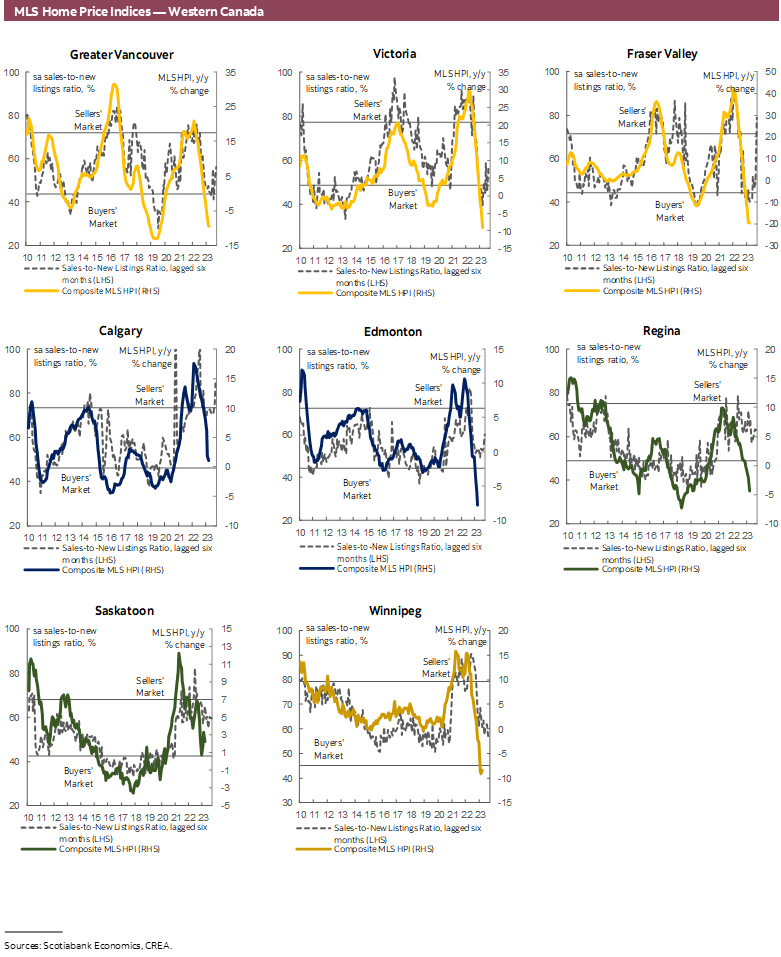
It was a fairly even split between markets that saw sales increase and those where sales declined, while the drop in listings was more widespread. Sales increased in 17 of the 31 local markets we track, with a particularly significant increase in BC’s Fraser Valley and double-digit increases in Saint John, Okanagan-Mainline and Guelph, more than offsetting declines elsewhere. Sales increased in most of Ontario large urban centers, making BC and Ontario the drivers of March’s national activity. On the other hand, listings declined in 26 of the local markets, with 9 of them being in double digits.
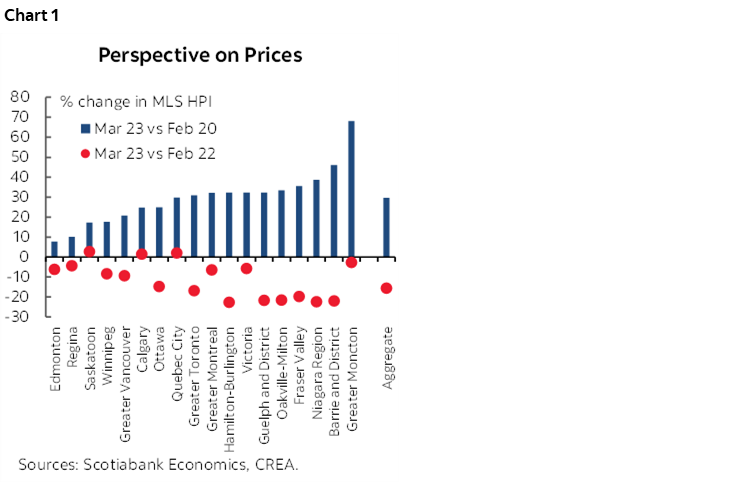
Prices increased in March, albeit by a very small amount, that may be wiped out when data are revised next month. Still, it would be a month where prices, as measured by the MLS Home Price Index (HPI), at least did not decline for the first time since February 2022. The MLS HPI edged up 0.2% (sa m/m), driven by the single-family home segments as the HPI for apartments and townhouses fell again in March, but by the smallest amount since October 2022. With this month’s results, the MLS HPI is still 30% above pre-pandemic levels while being 16% below its February 2022 peak.
IMPLICATIONS
National home sales increased again in March, by a similar amount as in the previous month—the first two consecutive monthly increases since the housing market began its correction stage in February 2022. This coincided with two consecutive, and relatively large, monthly declines in listings, which added tightness to the market and supported prices—leaving the MLS Home Price Index (HPI) relatively unchanged (edging up by 0.2%) from the previous month after consistently declining each month since February 2022.
Back in October 2022, when home sales ticked up after 7 months of consecutive declines, we wondered whether this would mark the beginning of the end of the housing market correction triggered by buyers interpreting the month’s uptick as the dip. But we cautioned against over-inferring from a single data point. Since then, additional signs of a possible reversal have emerged, with sales increasing in 3 of the 5 months following October. March’s uptick in prices, while small, increases the likelihood that this may mark the beginning of the ‘recovery’ stage. As buyers see signs of an increase in activity and prices, they may be enticed to rush back to the market before prices go up any further, in turn adding more pressure on activity and prices. If this trend continues, it would be best described as a reversal rather than a recovery with a return of demand that is not coinciding with a meaningful increase in supply. With only one side of the ledger recovering, this would reintroduce imbalances to the market and reverse some of the improvements we have seen over the past year towards a more balanced and sustainable market and conditions. The needed improvement in housing affordability conditions will therefore be again delayed.
While we continue to believe that prices will go down a bit more, we are less confident of this given signs of a rebound in demand with still-low inventory. On one hand, there is still room for prices to decline in response to lagged impacts of higher rates—while we expect the Bank of Canada to hold its policy rate at 4.5% through this year, the projected decline in the inflation rate means the real—inflation adjusted—policy rate, which is what matters for economic conditions, will continue to increase through this year (see here). This and the projected economic slowdown later this year (remember, we’re still trying to engineer a mild recession to bring inflation down to the 2% target!) would dampen activity relative to what it otherwise would be given pent-up demand for housing and strong population growth owing to high immigration targets. On the other hand, this pent-up demand and the retightening in conditions as the sales-to-listing ratio rises rapidly combined with the decline in fixed-rate mortgage rates may cause prices to resume their increase earlier than we had expected.
Despite the potential additional declines, prices will remain above pre-pandemic levels (see here). In fact, despite the decline in prices since February 2022, the MLS HPI remains 30% above its pre-pandemic levels (chart 1). And, with the eventual easing in financial conditions expected next year, combined with the reduction of prices that has already occurred, affordability will likely improve at a time when there is pent-up demand from both the erosion of affordability up to this point (with higher mortgage rates more than offsetting declines in prices) and strong population growth. This again points to a stabilization in housing market activity, which is supported by recent data, and an eventual uptick in demand and prices as we look onto next year.
DISCLAIMER
This report has been prepared by Scotiabank Economics as a resource for the clients of Scotiabank. Opinions, estimates and projections contained herein are our own as of the date hereof and are subject to change without notice. The information and opinions contained herein have been compiled or arrived at from sources believed reliable but no representation or warranty, express or implied, is made as to their accuracy or completeness. Neither Scotiabank nor any of its officers, directors, partners, employees or affiliates accepts any liability whatsoever for any direct or consequential loss arising from any use of this report or its contents.
These reports are provided to you for informational purposes only. This report is not, and is not constructed as, an offer to sell or solicitation of any offer to buy any financial instrument, nor shall this report be construed as an opinion as to whether you should enter into any swap or trading strategy involving a swap or any other transaction. The information contained in this report is not intended to be, and does not constitute, a recommendation of a swap or trading strategy involving a swap within the meaning of U.S. Commodity Futures Trading Commission Regulation 23.434 and Appendix A thereto. This material is not intended to be individually tailored to your needs or characteristics and should not be viewed as a “call to action” or suggestion that you enter into a swap or trading strategy involving a swap or any other transaction. Scotiabank may engage in transactions in a manner inconsistent with the views discussed this report and may have positions, or be in the process of acquiring or disposing of positions, referred to in this report.
Scotiabank, its affiliates and any of their respective officers, directors and employees may from time to time take positions in currencies, act as managers, co-managers or underwriters of a public offering or act as principals or agents, deal in, own or act as market makers or advisors, brokers or commercial and/or investment bankers in relation to securities or related derivatives. As a result of these actions, Scotiabank may receive remuneration. All Scotiabank products and services are subject to the terms of applicable agreements and local regulations. Officers, directors and employees of Scotiabank and its affiliates may serve as directors of corporations.
Any securities discussed in this report may not be suitable for all investors. Scotiabank recommends that investors independently evaluate any issuer and security discussed in this report, and consult with any advisors they deem necessary prior to making any investment.
This report and all information, opinions and conclusions contained in it are protected by copyright. This information may not be reproduced without the prior express written consent of Scotiabank.
™ Trademark of The Bank of Nova Scotia. Used under license, where applicable.
Scotiabank, together with “Global Banking and Markets”, is a marketing name for the global corporate and investment banking and capital markets businesses of The Bank of Nova Scotia and certain of its affiliates in the countries where they operate, including; Scotiabank Europe plc; Scotiabank (Ireland) Designated Activity Company; Scotiabank Inverlat S.A., Institución de Banca Múltiple, Grupo Financiero Scotiabank Inverlat, Scotia Inverlat Casa de Bolsa, S.A. de C.V., Grupo Financiero Scotiabank Inverlat, Scotia Inverlat Derivados S.A. de C.V. – all members of the Scotiabank group and authorized users of the Scotiabank mark. The Bank of Nova Scotia is incorporated in Canada with limited liability and is authorised and regulated by the Office of the Superintendent of Financial Institutions Canada. The Bank of Nova Scotia is authorized by the UK Prudential Regulation Authority and is subject to regulation by the UK Financial Conduct Authority and limited regulation by the UK Prudential Regulation Authority. Details about the extent of The Bank of Nova Scotia's regulation by the UK Prudential Regulation Authority are available from us on request. Scotiabank Europe plc is authorized by the UK Prudential Regulation Authority and regulated by the UK Financial Conduct Authority and the UK Prudential Regulation Authority.
Scotiabank Inverlat, S.A., Scotia Inverlat Casa de Bolsa, S.A. de C.V, Grupo Financiero Scotiabank Inverlat, and Scotia Inverlat Derivados, S.A. de C.V., are each authorized and regulated by the Mexican financial authorities.
Not all products and services are offered in all jurisdictions. Services described are available in jurisdictions where permitted by law.