CANADA HOUSING MARKET: TREADING LIGHTLY
SUMMARY
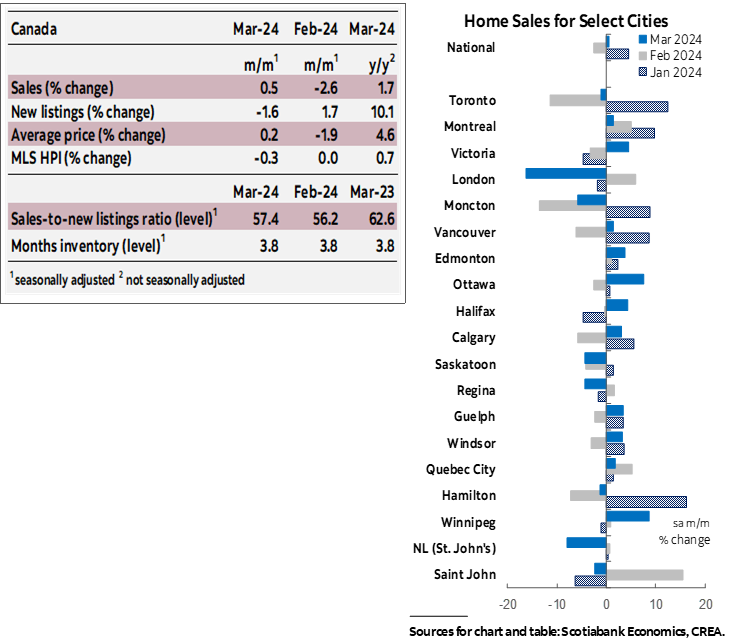
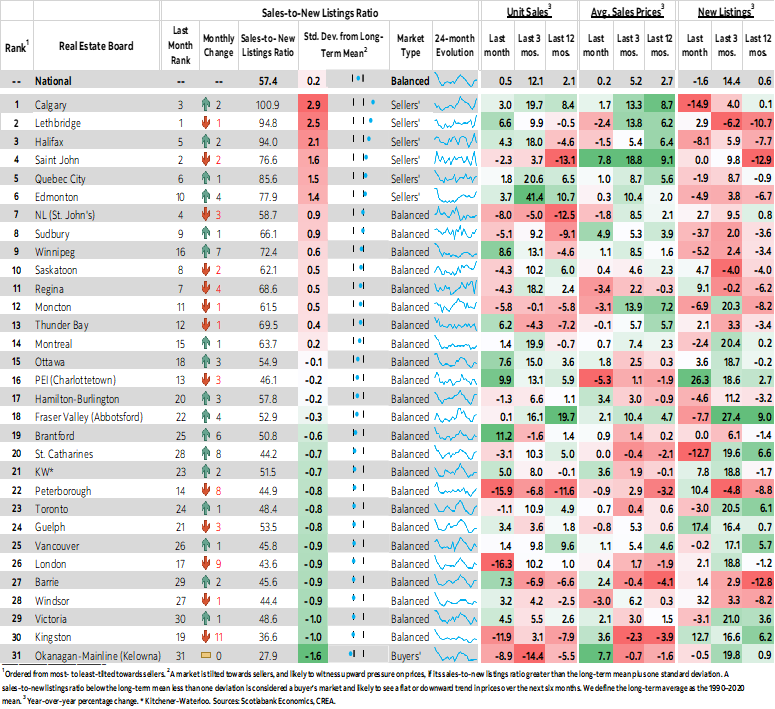
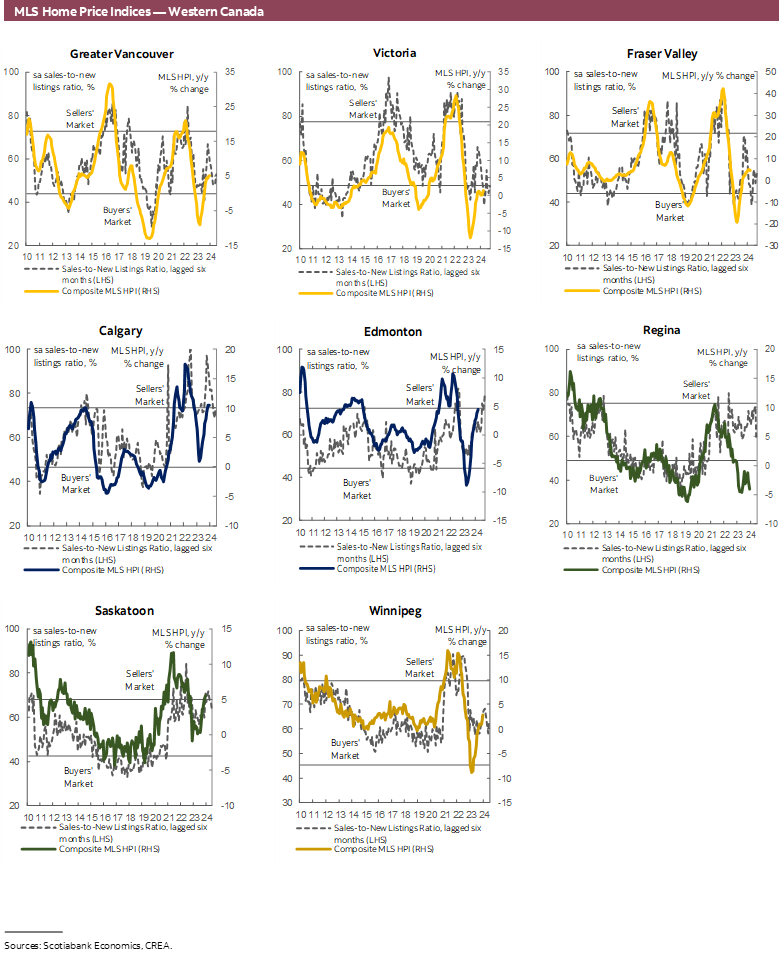
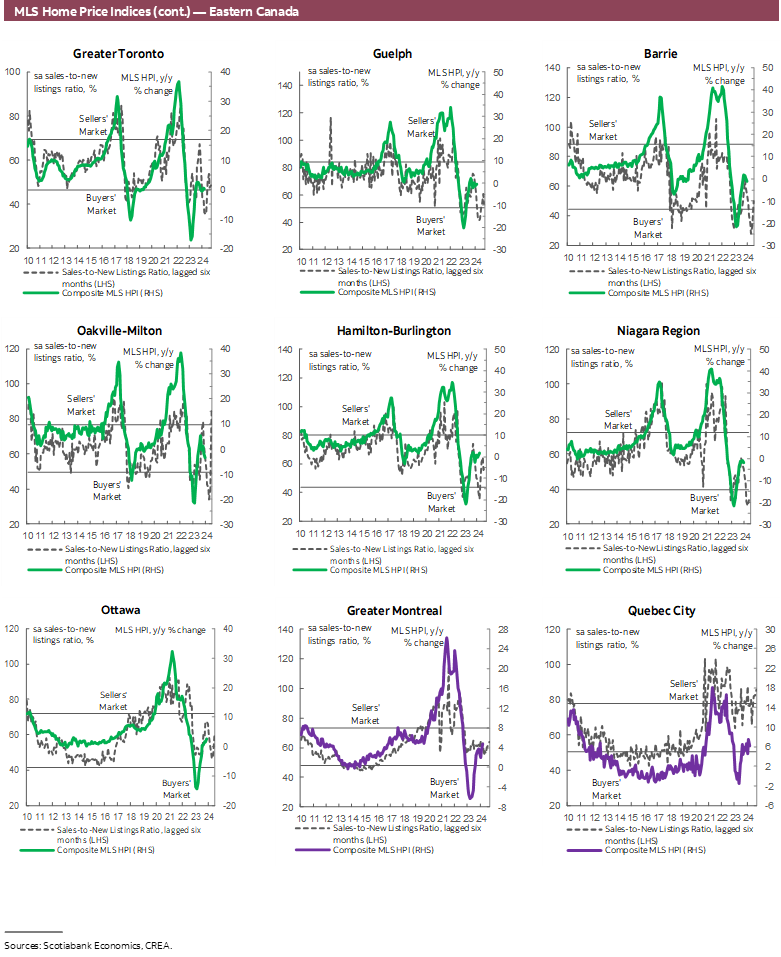
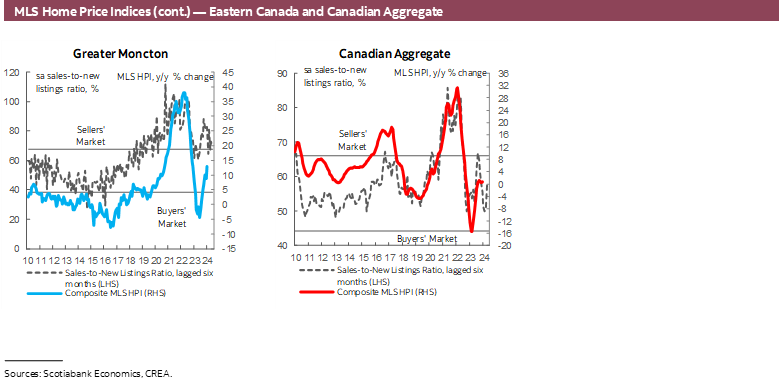
Canadian home sales edged up by 0.5% (sa m/m) in March, while new listings reversed February’s increase, declining by 1.6%. This tightened the sales-to-new listings ratio, an indicator of how tight the market is, to 57.4%. Still within the bound that is consistent with the national market being in “balanced” territory (at least based on long-term averages and standard deviations), but slightly above its long-term average of 55%. There were 3.8 months of inventory—holding steady from February, which is over a month below its long-term average of around five months. Months of inventory in New Brunswick, Nova Scotia, and Newfoundland and Labrador still are 5 months below their long-term averages, while in BC and Ontario months of inventory have dipped to 0.2 below their long-term averages.
Sales increased in over half of the 31 local markets we track. Brantford led the increase in sales, reversing all of its February decline at 11.2% (sa m/m), followed by Charlottetown and Winnipeg with increases of 10% and 9%, and smaller increases elsewhere. This ever so slightly offset declines in the remaining 13 markets, with London and Peterborough registering declines of 16% while Kingston saw sales decline by 12%.
The first quarter of 2024 recorded an over 8% increase in sales relative to the previous quarter (sa q/q), and was 12% higher compared to the same quarter last year. The quarter’s increase was largely led by a 24% increase in Fraser Valley in BC and significant double-digit increases in many Ontario markets. This, alongside issues of affordability and supply, perhaps explains the slower pace seen towards the end of the quarter in those provinces.
There was a fairly even split between markets where listings increased and where they declined. The number of newly listed properties increased by 26% (sa m/m) in Charlottetown and between 10% and 17% in Peterborough, Kingston, and Guelph. However, this was more than offset by declines elsewhere, with new listings in Calgary and St. Catharines taking the lead, falling by 15% and 13%. Given the movements in sales and listings, 24 markets were in balanced territory in March relative to 19 in February, 5 were in sellers’ territory relative to 8 in February, and only 1 market remained in buyers’ territory relative to 4 in February.
For the quarter on the whole, 2024Q1 saw listings decline by 2% compared to the previous quarter but was 14% higher than the same quarter last year.
Prices, as measured by the MLS Home Price Index (HPI), fell by a rather small 0.3% (sa m/m) in March. March’s decline was driven by a 0.7% decline in apartments’ HPI and 0.1% in townhouses, while the single family home segment recorded no change. However, looking more closely at this segment, one-storey single family homes increased by 0.4% which was offset by a 0.3% decline in two-storey homes.
IMPLICATIONS
Let’s face it, everyone seems unsure. Things are moving one way one month and another for two (here and south of the border, which very much impacts here). Growth forecasts keep getting revised (the Bank of Canada themselves just boosted their 2024 growth forecast by almost double). Expectations for rates keep changing with everything from the US economic performance, our wage growth, to the housing market itself impacting the rate outlook. It’s not exactly a very easy economic environment to make a very, very, big financial (and emotional) decision. It’s stressful on a normal day in regular times.
There is no question there is demand for homes, where are you reading this now from? Think home sales below long-term averages while population growth at record highs. But it is certainly not a surprise that people are not jumping into the housing market en masse right now. So small increases (or declines) here and there are to be expected. And let’s remember, when we say sales increased or decreased from one month to another, it is the case that thousands of sales are still happening each month (see here on regular monthly volatility in the housing market). It is likely that the uncertainty is however muting some demand that would have otherwise been there making monthly increases a bit larger given population growth (not pandemic crazy larger though, those times are behind us, where they should stay).
Moreover, March has been a special month this year as it confused seasonal adjustment equations, with easter weekend falling in March this year instead of April as it does typically. Seasonal adjustments attempt to control for variations in monthly data due to things that reoccur at the same time each year, such as the weather and holidays. This might’ve distorted March’s data (towards the weaker side) given that you can’t properly seasonally adjust something that occurs once every 4 or 5 years.
Having said this, CREA did note that weekly tracking showed more strength towards the end of March. Listings bounced in the second week of March which was followed the next week by a pick-up in sales. Weekly tracking of a jump in listings in the first week of April as reported by CREA may then point towards a pick-up in sales activity later in April as buyers absorb new supply that is hitting a market. April’s numbers relative to March might be further boosted by leftover easter seasonal adjustments that will be applied to April’s data.
DISCLAIMER
This report has been prepared by Scotiabank Economics as a resource for the clients of Scotiabank. Opinions, estimates and projections contained herein are our own as of the date hereof and are subject to change without notice. The information and opinions contained herein have been compiled or arrived at from sources believed reliable but no representation or warranty, express or implied, is made as to their accuracy or completeness. Neither Scotiabank nor any of its officers, directors, partners, employees or affiliates accepts any liability whatsoever for any direct or consequential loss arising from any use of this report or its contents.
These reports are provided to you for informational purposes only. This report is not, and is not constructed as, an offer to sell or solicitation of any offer to buy any financial instrument, nor shall this report be construed as an opinion as to whether you should enter into any swap or trading strategy involving a swap or any other transaction. The information contained in this report is not intended to be, and does not constitute, a recommendation of a swap or trading strategy involving a swap within the meaning of U.S. Commodity Futures Trading Commission Regulation 23.434 and Appendix A thereto. This material is not intended to be individually tailored to your needs or characteristics and should not be viewed as a “call to action” or suggestion that you enter into a swap or trading strategy involving a swap or any other transaction. Scotiabank may engage in transactions in a manner inconsistent with the views discussed this report and may have positions, or be in the process of acquiring or disposing of positions, referred to in this report.
Scotiabank, its affiliates and any of their respective officers, directors and employees may from time to time take positions in currencies, act as managers, co-managers or underwriters of a public offering or act as principals or agents, deal in, own or act as market makers or advisors, brokers or commercial and/or investment bankers in relation to securities or related derivatives. As a result of these actions, Scotiabank may receive remuneration. All Scotiabank products and services are subject to the terms of applicable agreements and local regulations. Officers, directors and employees of Scotiabank and its affiliates may serve as directors of corporations.
Any securities discussed in this report may not be suitable for all investors. Scotiabank recommends that investors independently evaluate any issuer and security discussed in this report, and consult with any advisors they deem necessary prior to making any investment.
This report and all information, opinions and conclusions contained in it are protected by copyright. This information may not be reproduced without the prior express written consent of Scotiabank.
™ Trademark of The Bank of Nova Scotia. Used under license, where applicable.
Scotiabank, together with “Global Banking and Markets”, is a marketing name for the global corporate and investment banking and capital markets businesses of The Bank of Nova Scotia and certain of its affiliates in the countries where they operate, including; Scotiabank Europe plc; Scotiabank (Ireland) Designated Activity Company; Scotiabank Inverlat S.A., Institución de Banca Múltiple, Grupo Financiero Scotiabank Inverlat, Scotia Inverlat Casa de Bolsa, S.A. de C.V., Grupo Financiero Scotiabank Inverlat, Scotia Inverlat Derivados S.A. de C.V. – all members of the Scotiabank group and authorized users of the Scotiabank mark. The Bank of Nova Scotia is incorporated in Canada with limited liability and is authorised and regulated by the Office of the Superintendent of Financial Institutions Canada. The Bank of Nova Scotia is authorized by the UK Prudential Regulation Authority and is subject to regulation by the UK Financial Conduct Authority and limited regulation by the UK Prudential Regulation Authority. Details about the extent of The Bank of Nova Scotia's regulation by the UK Prudential Regulation Authority are available from us on request. Scotiabank Europe plc is authorized by the UK Prudential Regulation Authority and regulated by the UK Financial Conduct Authority and the UK Prudential Regulation Authority.
Scotiabank Inverlat, S.A., Scotia Inverlat Casa de Bolsa, S.A. de C.V, Grupo Financiero Scotiabank Inverlat, and Scotia Inverlat Derivados, S.A. de C.V., are each authorized and regulated by the Mexican financial authorities.
Not all products and services are offered in all jurisdictions. Services described are available in jurisdictions where permitted by law.