Next Week's Risk Dashboard
- Tracking holiday shopping
- There is less holiday discounting this year
- Will OPEC+ curtail output?
- Canadian GDP will be weak, with an asterisk
- Will this year’s massive Canadian job gains continue?
- Canadian wage growth will continue to outpace productivity
- Canadian bank earnings season
- Four central banks expected to hold: RBNZ, BoT, BoK, Israel
- Is core Eurozone inflation still ebbing?
- US core PCE could undershoot core CPI
- China’s PMIs to inform Q4 growth tracking
- CPI: Aussie, Indonesia, Peru
- Global Macro
Chart of the Week
MARKETS NEED A LITTLE HOLIDAY CHEER
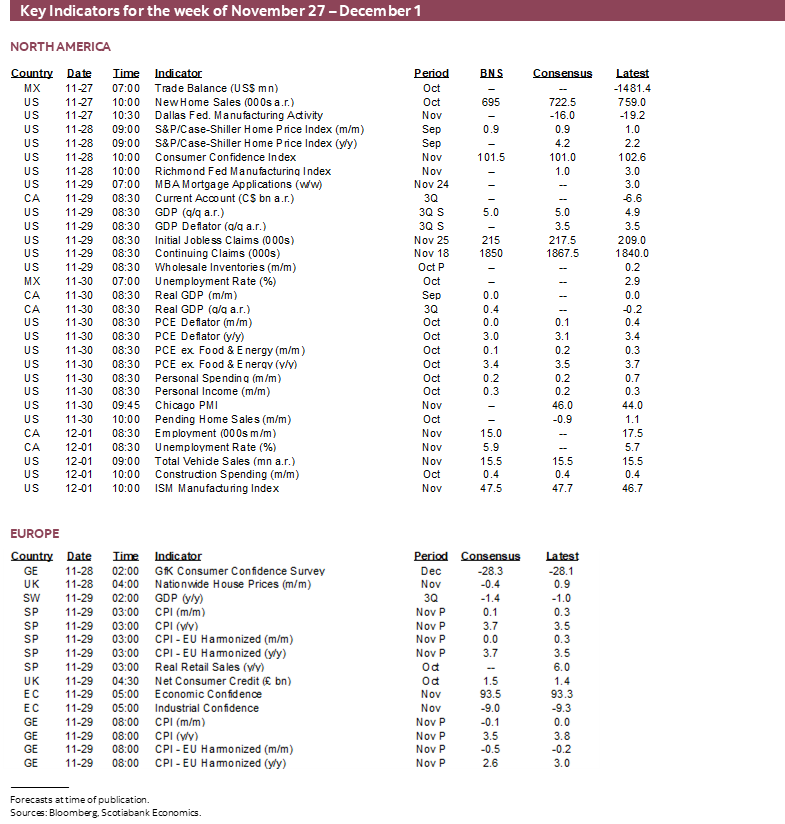
A lot will be packed into developments this coming week as global trading desks return to being fully staffed for the push toward bidding adieu to 2023.
How US and Canadian consumers are performing will involve tracking high frequency gauges of spending and price discounting at a pivotal time of year for retailers. Whether oil markets will add heat to inflation markets could be informed by what OPEC+ decides later in the week. The Fed’s and ECB’s key measures of inflation will be updated. Canadian markets will take down a wave of bank earnings, GDP growth estimates, plus fresh readings on jobs and wages. Major global central banks will sit things out this week, and four regional ones are likely to twiddle their thumbs. Throughout it all, the line-up of global macro indicators will inform our thinking on Chinese economic momentum, how total US consumer spending is performing, and a panoply of readings from all corners of the world economy.
Let’s dive in and tackle them all one at a time.
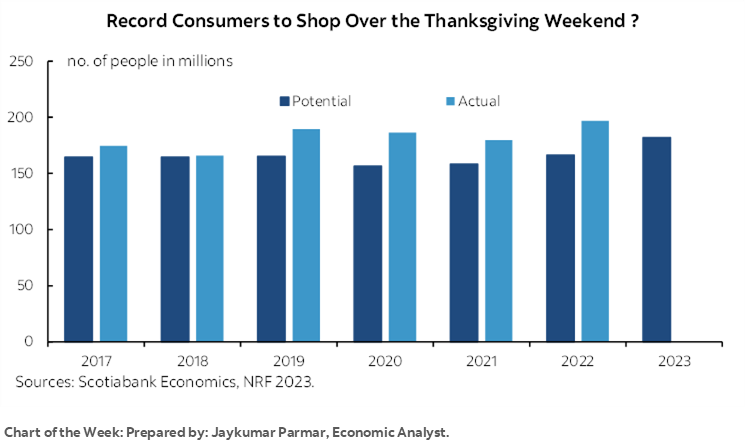
HOLIDAY SHOPPING—TESTING CONSUMER RESILIENCE
How the holiday shopping and travel season is kicking off in earnest will be a focal point at a broad macro and individual company level this week. High frequency gauges for sales and prices will be relied upon through a series of measures.
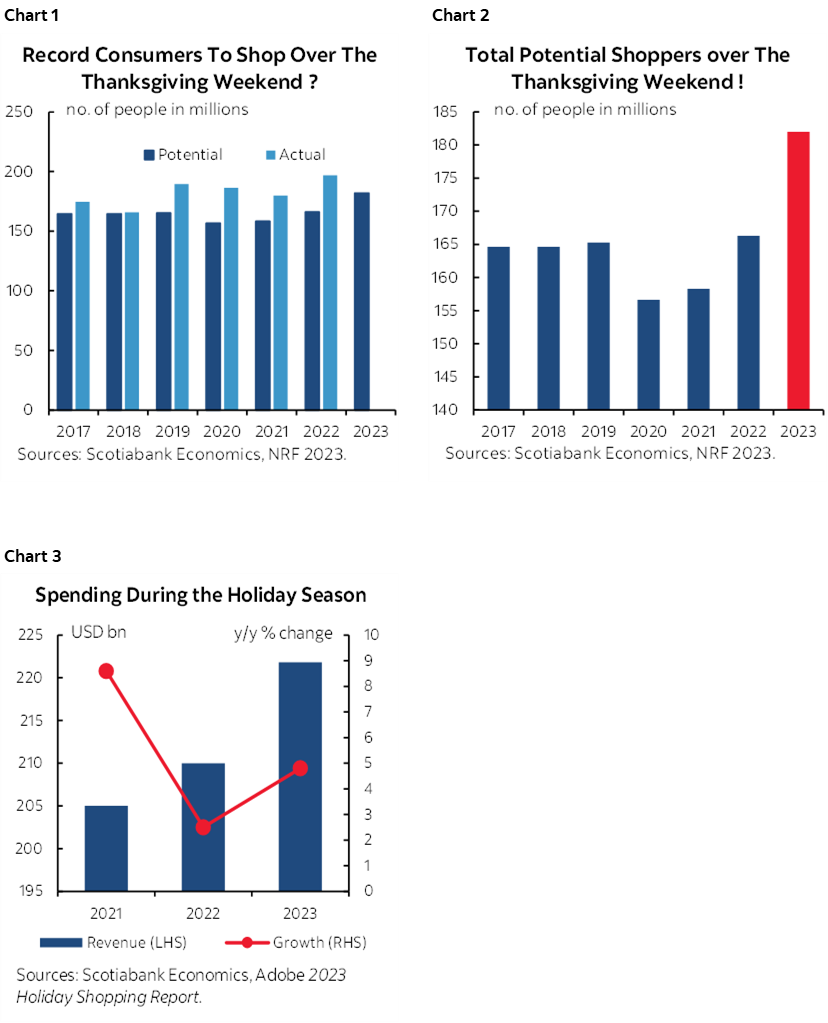
There are high hopes for how it all pans out. US retailers are forecasting the strongest US kick off in years and they have tended to underestimate sales in prior years (chart 1). Whether they are blowing smoke or not is also informed by other forecast sources that are expecting strength (chart 2, 3). 2023 is so far tracking 2022 spending over October and November to date but key will be this weekend and especially Cyber Monday that accounts for the largest single-day share of spending.
In Canada, over 400,000 jobs created this year, accompanied by strong wage gains, still high home equity and a rebound in equity markets while 60% of Canadian households don’t have a mortgage and the tail of 10–15% of them with the greatest challenge are managing while consumer bankruptcies remain at a record low.
High frequency readings will be watched as reports come in from credit card processing companies, e-payment sources, online retailers, data analytics firms, and individual companies.
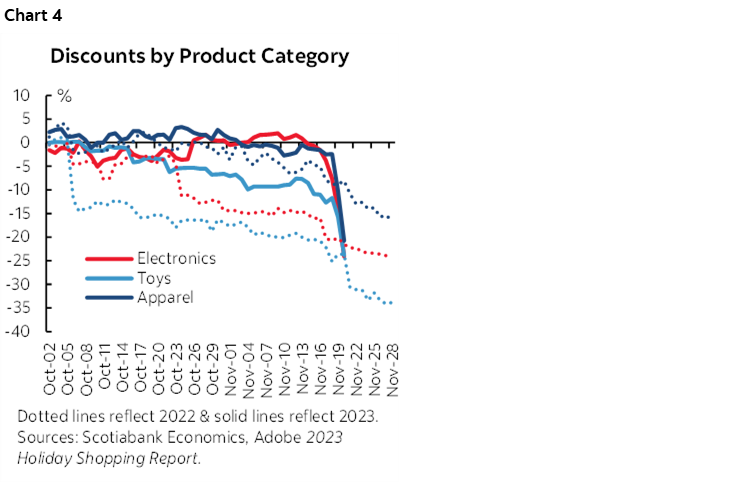
For inflation watchers, of note is that this year’s discounting appears to be materially less—so far—than last year (chart 4). That could also explain some of why the dollar value of sales this season is expected to be higher than last year.
Travel is also running at more elevated levels than we’ve seen in years in both the US and Canada (charts 5, 6). Tracking how that continues relative to forecasts such as the ones from the American Automobile Association will be key (charts 7, 8).

INFLATION—EYES ON THE EUROZONE AND US
US and Eurozone inflation gauges are often impactful to markets, but perhaps less so this time around on signals from each respective central bank that they are at least on pause if not done hiking outright. Peru (Friday) and Indonesia (Thursday) will also update inflation figures.
Fed’s Preferred Inflation Gauge—Weaker than CPI?
The price deflator for total consumer expenditures during the month of October lands on Friday. It’s preferred partly because it is a broader measure that dynamically adjusts to changes in the spending basket alongside several other methodological differences.
I’ve estimated a softer core PCE inflation reading of 0.1% m/m SA than the 0.2% m/m SA rise in CPI excluding food and energy. Part of the reason is the lower weight on shelter in PCE than CPI which means that the CPI shelter rise of 0.3% m/m probably won’t be as big of an effect on PCE. By way of comparison, the Cleveland Fed’s ‘nowcast’ for core PCE is 0.2% m/m which matches the median consensus call as my estimate and a few others are a little lighter.
Eurozone—More Than Just Gas?
Eurozone CPI will be updated for November on Thursday along with figures from Italy and France. Germany and Spain will report the day before. Most expect headline CPI to dip in month-over-month seasonally unadjusted terms significantly due to falling gasoline prices.
The bigger question is whether core inflation will continue to ebb. Most expect it to do so on year-ago base effects alone. Whether it builds upon recent evidence of a soft patch in m/m terms is a bigger uncertainty (chart 9).
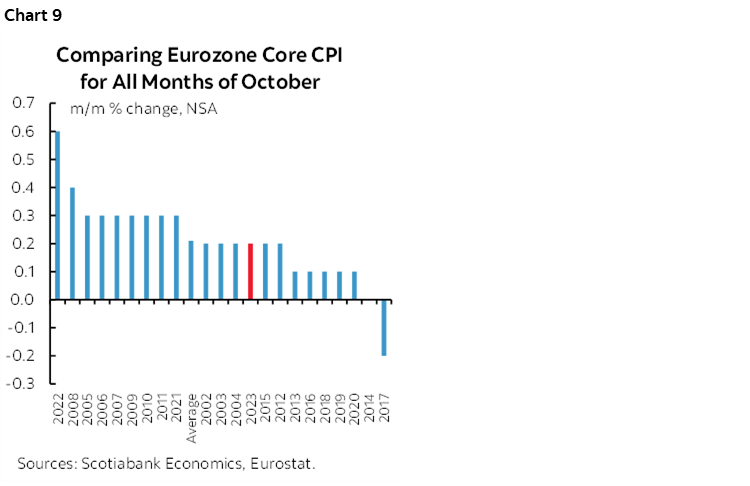
It’s important to caution against ringing the all-clear on Eurozone inflation. Inflation expectations remain elevated (chart 10) and so does wage growth (chart 11).

CANADA’S ECONOMY—WEAK*
Canada updates GDP figures for Q3, the month of September and the month of October on Thursday. We’ll have a good sense of underlying momentum in the economy including the hand-off effects into Q4. Weakness with an asterisk is expected.
In what follows, I’ll argue that the numbers mask resilience. It’s amazing that the economy isn’t really tanking after massive rate hikes, the toll imposed by crippling strikes, and the effects of wildfires that disrupted multiple sectors of the economy. One-third of Canada’s workforce is unionized versus 10% in the US and so the collective bargaining exercises that have followed surging inflation are having a more negative effect on Canada’s economy than the US.
That’s the glass half full counterweight to the overly negative ones out there. Nevertheless, recall that at the end of the day the entire purpose of the exercise to tighten monetary policy is to break a few teacups, that is, to damage growth in order to bring down the insidious, regressive inflation tax with its demand and supply drivers.
Statcan guided back on October 31st that September GDP was tracking “essentially unchanged” in m/m terms. I get about the same using a simple regression model against higher frequency indicators but with less information than Statcan would have probably had internally at the time.
Q3 GDP growth is likely to be weak, but how weak and even what sign is in front the number are highly uncertain. It doesn’t take much to get estimates between about -1% q/q SAAR and +1%. Our last formal published forecast back on October 23rd anticipated 0.7%. The BoC’s MPR on October 25th forecast 0.8%. Various nowcasts (ours and others) are between -0.1% and about +½%.
Using monthly GDP I’m tracking 0% q/q SAAR for Q3. Monthly GDP measures the production side of the economy without asking so much about how output was achieved. Quarterly expenditure-based GDP does consider the ‘how’ part. How net trade and inventory investment unfolded can drive deviations between quarterly expenditure-based GDP and quarterly GDP using the monthly accounts.
Part of the problem is that there are a lot of missing components or readings that are difficult to estimate. Service sector output is one. We have an incomplete picture of inventories, but it’s looking like they will be a drag at least for manufacturing and wholesale absent reliable retail and farm inventories (chart 12). Net trade is likely to be an addition to growth based upon volume proxies (chart 13). To control for both of these effects will entail having a look at final domestic demand that excludes inventory investment and net trade effects on growth. That will provide a cleaner understanding of what’s going on in the domestic economy before controlling for unusual shocks. For instance, it’s not necessarily a negative if companies were disinvesting inventory positions.

Overall, I stayed on the plus side, but marginally so at +¼% q/q SAAR.
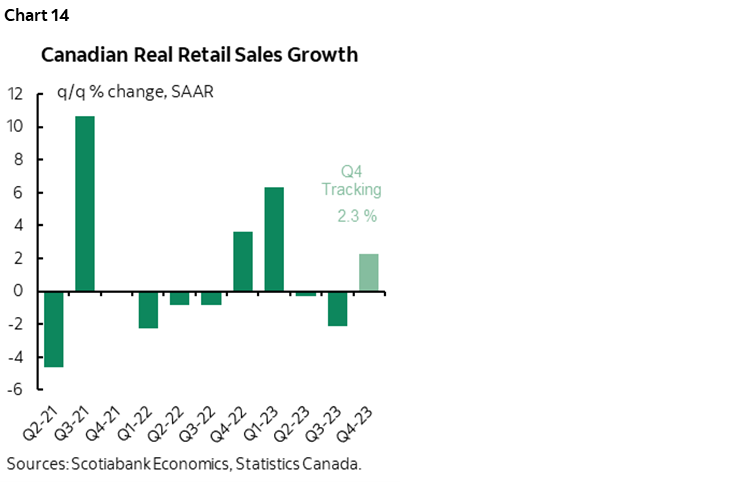
As for October, Statcan will provide a preliminary estimate absent firm details and at best accompanied by loose verbal guidance. Based on very little by way of inputs, I’m tentatively expecting a slight gain. So far, retail sales volumes are poised for their best quarter since the start of the year (chart 14).
As for that asterisk on the weakness—especially if it’s a back-to-back slight contraction following the -0.2% q/q SAAR dip in Q2—it has to do with factors that are holding back growth that are likely transitory. Some factors are not transitory, but some are and are significant.
Chart 15 provides a depiction of one of them. Canada lost a tonne of hours worked due to strikes in Q3. In fact, the number of hours of work lost to strikes in Q3 was bigger than any of the quarters during which pandemic restrictions were imposed except for at the start in 2020Q2 when basically most of the economy was forced to shut for a period. 2023Q3’s hours lost were equal to two-thirds of that initial shutdown quarter’s lost hours.
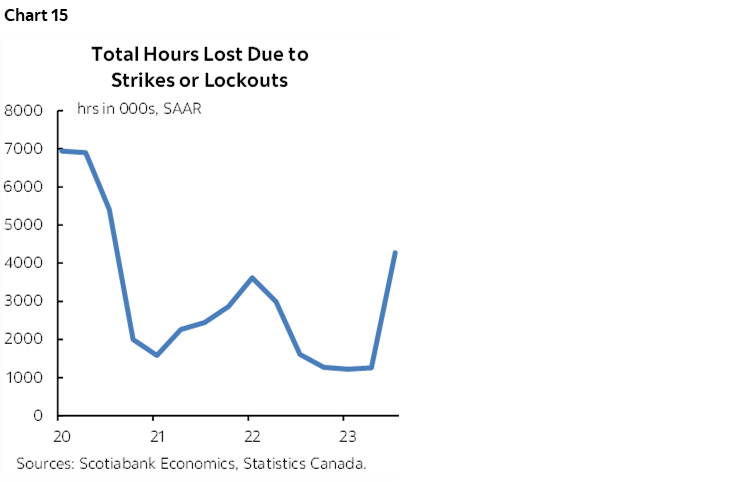
Those lost hours due to strikes have extended into Q4. July was the biggest month for lost hours to strikes when the BC port strike hit among others, August was a close second, but lost hours have continued since and picked up again in October with the auto strike’s effects that rippled through supply chains.
Since GDP is total hours worked times labour productivity, a strike-induced hit to hours worked as folks stood out on picket lines or did something else is not reflective of the impact of higher borrowing costs. It’s more of a reflection of the costs of high inflation that motivated folks to seek higher pay. Then layer on the effects of an awful summer for crippling wildfires. We could very well wind up adding back those factors going forward.
CANADA’S JOB MARKET—KEY IS WAGE GROWTH
Canada also updates jobs, wages and broader labour market readings for the month of November on Friday. Canada’s economy has created over 400,000 jobs so far this year and is experiencing among the fastest wage gains in excess of inflation that you will find anywhere.
I went with +15k for jobs and a higher unemployment rate (5.9% from 5.7%) as the born in Canada and recent immigrant categories are driving faster entry into the workforce than the pace at which jobs are being created.
Canada’s Labour Force Survey has a 95% confidence interval of +/-57k and so there is an enormous amount of statistical noise around the estimates. Having said that, multiple readings are starting to show that the labour market may be coming back into better balance, but trend wage growth remains hot thus far.
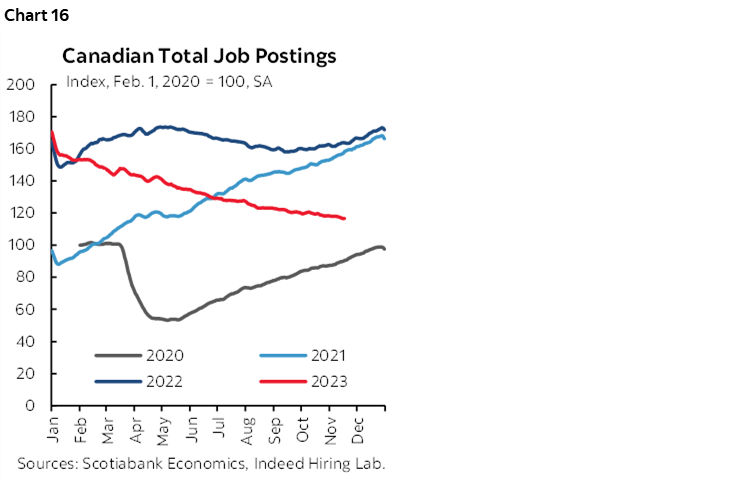
For instance, job postings are on a declining trend and weaker than the powerful rebound years of 2021 and 2022 but still fairly elevated (chart 16).
Job vacancies are well off their peak that occurred during the rebound phase of the pandemic-era, but still materially higher than pre-pandemic levels (chart 17).

The so-called Beveridge Curve portrays the relationship between job vacancies and unemployment (chart 18). Here too Canada’s labour market is making progress toward being somewhat less tight, but it remains a considerable distance from being characterized as having material slack.

Enter wages and productivity that always have to be taken together. Wage growth stumbled a touch in the month of November, but at 3.7% m/m SAAR remained well above the BoC’s 2% inflation target. The peak rates of wage growth were in July and August in the 10–12% m/m SAAR range, before September’s 8% and then October’s softening. November’s reading will further inform trend wage gains.
Nevertheless, when Governor Macklem quotes wage growth in the 4–5% range he’s using year-over-year figures. That understates recent momentum at the margin. Regardless, whichever measure one chooses arrives at a similar conclusion that wage growth is far above the BoC’s 2% target. How far above depends upon which measure is used. One way around this is to simply index average hourly earnings in nominal terms and CPI to the Spring of 2022 and compare the trends; charts 19 and 20 show that wage growth is strongly outpacing inflation.

A fair portion of this is driven by the wage gains being earned through collective bargaining exercises in the unionized sector. One-third of Canadian workers are unionized versus 10% in the US and so the lagging effects of collective bargaining wage adjustments is a more powerful effect north of the border in a very different and much less productive labour force due to various influences (chart 21).

CANADIAN BANK EARNINGS—A SOFTER SEASON
Canadian banks report Q4 and full year earnings this week. A generally softer season is expected compared to the prior seasonally unadjusted Q4 (chart 22). How they perform relative to expectations and their overall guidance could inform much of the tone to domestic credit and equity markets given their sizeable role in the Canadian market.

BNS (my employer) kicks it off on Tuesday and will be followed by CIBC, TD and RBC on Thursday and then BMO and National on Friday.
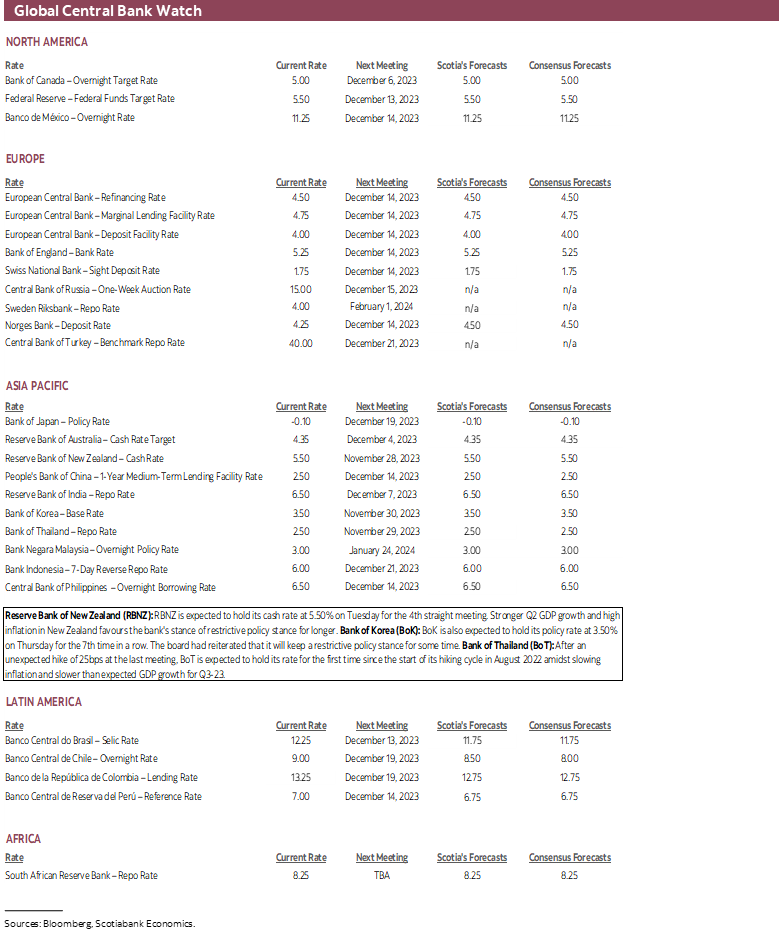
CENTRAL BANKS—FOUR WAYS TO SAY ‘HOLD’
Only four regional central banks will weigh in with fresh decisions this week. Their guidance may impact local markets but have no effect abroad.
- Bank of Israel (Monday): An expected hold at 4.75% is widely expected to be extended given unwillingness to add to pressures on the shekel in light of the ongoing war.
- RBNZ (Tuesday): New Zealand’s central bank is expected to hold its official cash rate at 5.5% for a fourth straight meeting on Wednesday night (ET). Still high Q3 inflation readings will keep it warning about a prolonged restrictive stance.
- Bank of Thailand (Wednesday): The BoT is widely expected to hold its benchmark rate at 2.5% after a surprise hike at its prior meeting. Inflation is slowing and Q3 GDP growth disappointed.
- Bank of Korea (Thursday): One of the earliest hiking central banks is widely expected to extend its policy rate hold that has been ongoing since January and deliver guidance toward further extending this bias into the new year.
GLOBAL MACRO—OPEC+ AND CHINA MACRO WILL BE KEY
Most of the rest of the global line-up will focus upon whether OPEC+ can strike an agreement that impresses oil markets, key China data, and a series of other US macro reports. The rest of the line-up is also highlighted below.
Oil market observers and those focused upon petro-currencies will want to keep one eye on the delayed OPEC+ meeting that will be held online on Thursday. It was originally to be held this coming Monday but was delayed in order to give more time to strike a possible agreement with African producers that seems close at hand as this publication is being finalized. Whether to extend production cuts of 1 million bpd by the biggest producers into early 2024 and possibly add to them in order to buoy oil prices are the issues in light of the decline in oil prices since September. WTI is still elevated at roughly US$77/barrel, but well off the prior peak of just under $94.
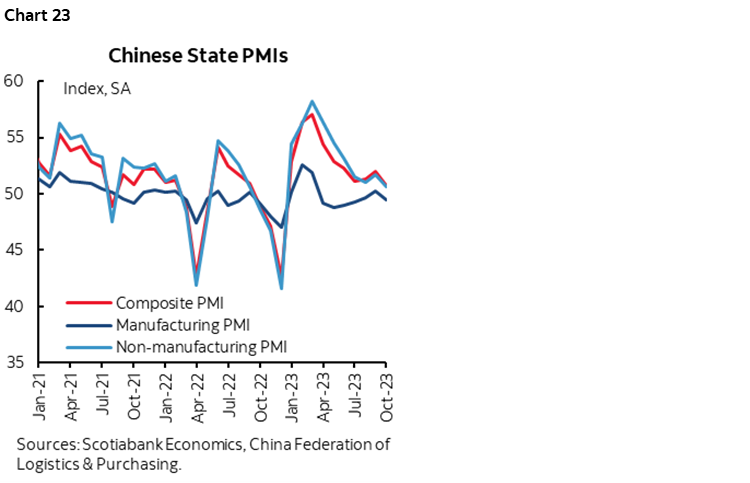
China updates the state’s purchasing managers’ indices for November on Wednesday and then the private sector’s manufacturing PMI the next day. They may inform growth momentum in Q4, as well as the decision by OPEC+. The composite gauge has been hovering barely above 50 with the support of the non-manufacturing sector of the economy (chart 23).
The US indicator line-up for this week will include a few other gems beyond the aforementioned PCE inflation figures. Nonfarm payrolls won’t arrive on Friday despite the first day of the month and will instead be updated the following Friday.
- New home sales (Monday): October’s reading is expected to give back some of the large 12% m/m SA rise the prior month, assuming it isn’t revised in either direction. Model home foot traffic is a leading indicator and it has been falling since a surge up to July.
- Repeat sale home prices (Tuesday): September’s measure will shoot for the seventh consecutive month-over-month seasonally adjusted gain. This measure that tracks a similar housing benchmark over time is less susceptible to compositional shifts in the demand for housing and it is currently running at a record high. Ergo, one reason for soft existing home sales is reticence to give up juicy 30-year fixed mortgage rates in a move, but the other reason is that prices remain elevated in part as a reflection of supply challenges with months’ supply of resales at just 3.5 months but trending higher.
- Consumer confidence (Tuesday): November’s reading could be relatively supported by solid job markets, a surging S&P500 since the recent bottom in late October and falling gasoline prices. Any downside to confidence that consensus expects may be limited and I can’t rule out upside.
- Q3 GDP Revisions (Wednesday): Most expect little revision risk to the second swing at estimating Q3 GDP growth. A figure close to the original 4.9% is likely based upon the tone of data since the first estimate was reported on October 26th.
- Personal income & spending (Thursday): I’ve estimated a 0.3% m/m SA rise in incomes during October that could slightly outpace a gain in personal spending given what we know about retail sales that slipped by -0.1% m/m but were up 0.2% m/m in terms of the narrower reading that flows into total consumption.
- ISM-manufacturing (Friday): November’s reading will partly depend upon Tuesday’s estimates for the Richmond Fed’s and Dallas Fed’s manufacturing gauges. The other regional surveys available thus far suggest that the pace of sub-50 contraction in the overall ISM gauge might ebb somewhat.
- Vehicle sales (Friday): Industry guidance points to an expect flat reading of 15.5 million vehicles sold at a seasonally adjusted and annualized rate. Sales in both the US and Canada have been firm.
Other US readings will include the Fed’s Beige Book of regional conditions (Wednesday), advance merchandise trade figures for October (Wednesday), weekly jobless claims (Thursday), pending home sales for October (Thursday) and construction spending in October (Friday).
Latin America’s calendar will be light. Chile updates October’s monthly economic activity index (Friday) and it has been posting no growth in y/y terms. Chile also updates industrial output for October the day before and year-over-year growth has been gently rising toward 1½%. Brazil updates industrial output in October, its manufacturing PMI for November and trade during November all on Friday.
European macro releases will be light other than Eurozone CPI. Consumer spending figures from France (Thursday), Spain (Wednesday) and Germany (tbc) will be the highlights. Sweden’s economy probably posted another mild contraction in Q3 (Wednesday) that may reinforce the Riksbank’s decision to stay on hold this past week against consensus expectations for a hike.
Down Under might report a small gain in retail sales during October (Monday) and slightly softer year-over-year CPI inflation for the same month due to gasoline prices but it will be the rest of the underlying details that will matter more (Tuesday).
India’s economy will be in the spotlight when Q3 GDP growth is released on Thursday. The year-over-year rate is expected to ease further toward 7% or perhaps lower.
Japan updates a series of readings for October including expected gains in retail sales and industrial output (Wednesday), little change in housing starts (Thursday), stable consumer confidence (Thursday) and the low jobless rate (Thursday).
South Korea updates retail sales for October sometime this week, along with industrial output (Wednesday), trade figures (Thursday) and a series of business and consumer surveys and PMIs.


DISCLAIMER
This report has been prepared by Scotiabank Economics as a resource for the clients of Scotiabank. Opinions, estimates and projections contained herein are our own as of the date hereof and are subject to change without notice. The information and opinions contained herein have been compiled or arrived at from sources believed reliable but no representation or warranty, express or implied, is made as to their accuracy or completeness. Neither Scotiabank nor any of its officers, directors, partners, employees or affiliates accepts any liability whatsoever for any direct or consequential loss arising from any use of this report or its contents.
These reports are provided to you for informational purposes only. This report is not, and is not constructed as, an offer to sell or solicitation of any offer to buy any financial instrument, nor shall this report be construed as an opinion as to whether you should enter into any swap or trading strategy involving a swap or any other transaction. The information contained in this report is not intended to be, and does not constitute, a recommendation of a swap or trading strategy involving a swap within the meaning of U.S. Commodity Futures Trading Commission Regulation 23.434 and Appendix A thereto. This material is not intended to be individually tailored to your needs or characteristics and should not be viewed as a “call to action” or suggestion that you enter into a swap or trading strategy involving a swap or any other transaction. Scotiabank may engage in transactions in a manner inconsistent with the views discussed this report and may have positions, or be in the process of acquiring or disposing of positions, referred to in this report.
Scotiabank, its affiliates and any of their respective officers, directors and employees may from time to time take positions in currencies, act as managers, co-managers or underwriters of a public offering or act as principals or agents, deal in, own or act as market makers or advisors, brokers or commercial and/or investment bankers in relation to securities or related derivatives. As a result of these actions, Scotiabank may receive remuneration. All Scotiabank products and services are subject to the terms of applicable agreements and local regulations. Officers, directors and employees of Scotiabank and its affiliates may serve as directors of corporations.
Any securities discussed in this report may not be suitable for all investors. Scotiabank recommends that investors independently evaluate any issuer and security discussed in this report, and consult with any advisors they deem necessary prior to making any investment.
This report and all information, opinions and conclusions contained in it are protected by copyright. This information may not be reproduced without the prior express written consent of Scotiabank.
™ Trademark of The Bank of Nova Scotia. Used under license, where applicable.
Scotiabank, together with “Global Banking and Markets”, is a marketing name for the global corporate and investment banking and capital markets businesses of The Bank of Nova Scotia and certain of its affiliates in the countries where they operate, including; Scotiabank Europe plc; Scotiabank (Ireland) Designated Activity Company; Scotiabank Inverlat S.A., Institución de Banca Múltiple, Grupo Financiero Scotiabank Inverlat, Scotia Inverlat Casa de Bolsa, S.A. de C.V., Grupo Financiero Scotiabank Inverlat, Scotia Inverlat Derivados S.A. de C.V. – all members of the Scotiabank group and authorized users of the Scotiabank mark. The Bank of Nova Scotia is incorporated in Canada with limited liability and is authorised and regulated by the Office of the Superintendent of Financial Institutions Canada. The Bank of Nova Scotia is authorized by the UK Prudential Regulation Authority and is subject to regulation by the UK Financial Conduct Authority and limited regulation by the UK Prudential Regulation Authority. Details about the extent of The Bank of Nova Scotia's regulation by the UK Prudential Regulation Authority are available from us on request. Scotiabank Europe plc is authorized by the UK Prudential Regulation Authority and regulated by the UK Financial Conduct Authority and the UK Prudential Regulation Authority.
Scotiabank Inverlat, S.A., Scotia Inverlat Casa de Bolsa, S.A. de C.V, Grupo Financiero Scotiabank Inverlat, and Scotia Inverlat Derivados, S.A. de C.V., are each authorized and regulated by the Mexican financial authorities.
Not all products and services are offered in all jurisdictions. Services described are available in jurisdictions where permitted by law.