Next Week's Risk Dashboard
- US economic resilience: benefits, costs and global effects
- US GDP to showcase solid growth
- Why is the US economy so resilient to rate hikes?
- Fed’s favoured inflation gauge is likely to be too hot again
- BoJ forecasts may reinforce expectations for further tightening
- Japanese core inflation continues to fall
- BoC’s Macklem sounded uber data dependent
- Bank Indonesia might resume hiking
- Turkey’s central bank may not be done either
- Chinese banks are expected to leave lending rates unchanged
- Russia’s central bank: break a leg!
- A massive week for US, Canadian earnings
- Global PMIs to inform tracking of growth, inflation, hiring
- Canadian retail sales will update consumer tracking
- Australian inflation could impact RBA pricing
- Will progress on Eurozone inflation expectations stall?
Chart of the Week
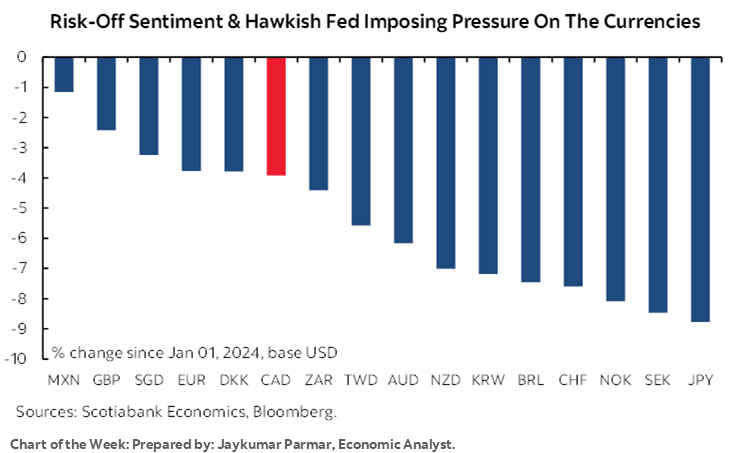
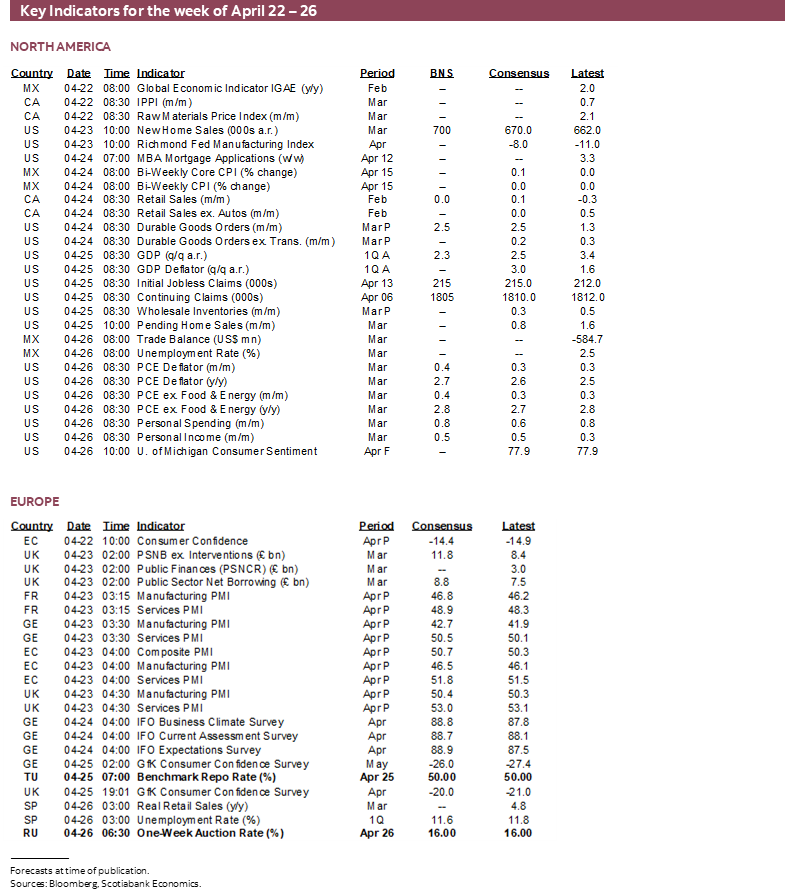
Developments across the Middle East may continue to present off-calendar risk through the weekend and into what is a week that will principally focus upon guidance from the Bank of Japan plus the state of the US economy. Inflation updates from the US and Australia will be key to the Federal Reserve and RBA. Several regional central banks will weigh in alongside other macro data. Recent BoC guidance indicated more emphasis upon data dependence into the June meeting than Governor Macklem had previously guided.
US ECONOMY—WHAT LANDING??
The first estimate for Q1 US GDP growth arrives on Thursday. It is likely to extend the streak of beats to seven quarters in a row. Ever since 2022Q3, consensus has come into the start of each consecutive quarter saying ‘this is the one!’ when the economy will tank, only to have to chase the numbers higher into the release (chart 1). The U.S. economy has proven to be much more resilient than anyone anticipated.
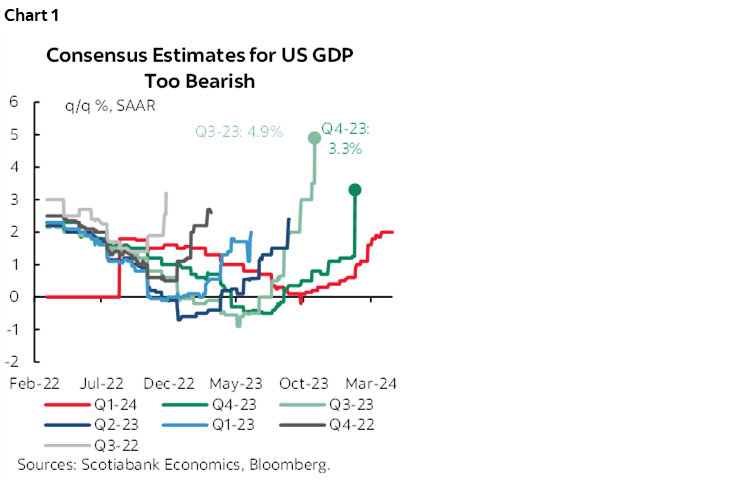
Inflation-adjusted growth of around 2¼% q/q SAAR is expected and with the consensus range mostly spread between about just under 2% to the upper 2s. The Atlanta Fed’s ‘nowcast’ is tracking 2.9% growth and hence toward the high end of consensus. I guess you can say that’s a slowing trajectory, but it’s all relative. Growth was supercharged in Q3 at 4.9% q/q SAAR but that was partly a blip with solid drivers that were also aided by a 1.3 ppt contribution from investment in inventories. Growth then slowed to ‘only’ 3.4% in Q4 despite a mild drag from inventories, and if estimates are anywhere close to the mark on Thursday, then growth may moderate a little further.
And yet we’re about two-and-a-half years into the period in which bond markets began tightening in anticipation of Federal Reserve rate hikes that began in March 2022 and the economy remains highly resilient. Why?
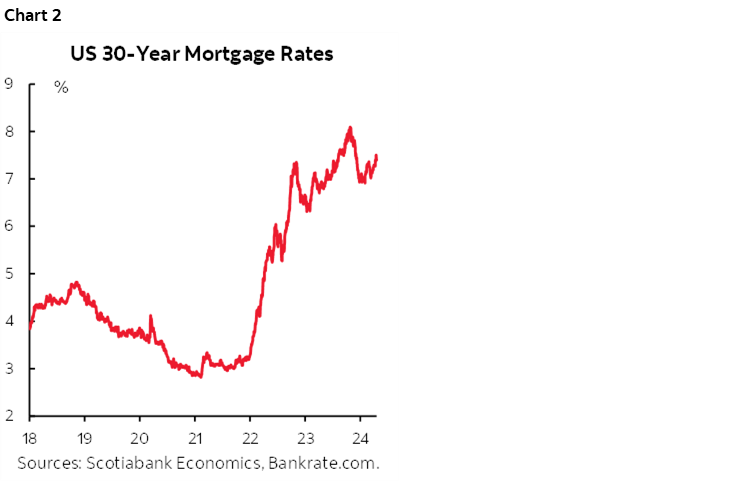
I think there is some credence to the argument that markets clear information and form expectations much more readily around endless central bank communications today. For instance, most of the rise in the two-year and 10-year Treasury yields was baked in by late 2022 and well ahead of the (likely) peak for the fed funds target rate that was hit last summer. That should have been a long enough period of time to assess the impact of tightened financial conditions. The lags are long and variable and the US economy is not out of the woods yet particularly given the surge in mortgage rates (chart 2), but the economy has had significant time to adjust to higher market yields.
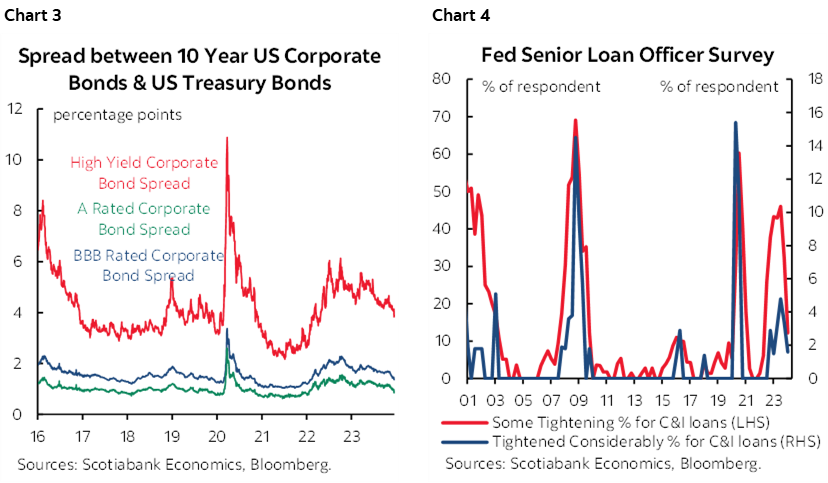
And yet financial conditions have not tightened as much across other measures. Credit spreads remain tight (chart 3) and the S&P500 has only moved slightly off the all-time peak in late March. Lending conditions have been tightening, but at an ebbing incremental pace (chart 4).
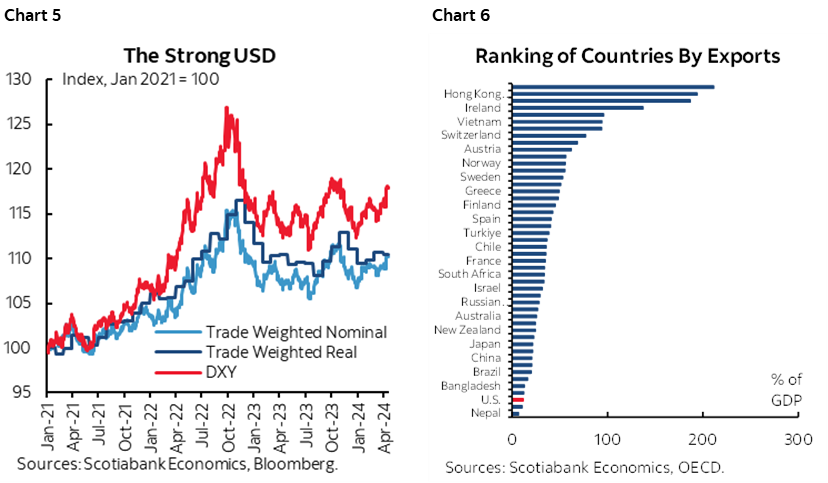
The dollar’s appreciation has been significant across any measure from the DXY to the broad trade weighted nominal and real indexes (chart 5), but the US economy is among the least open economies using exports as a share of GDP (chart 6) and the dollar’s strength is like a pay hike for consumers by raising the purchasing power for imported goods.
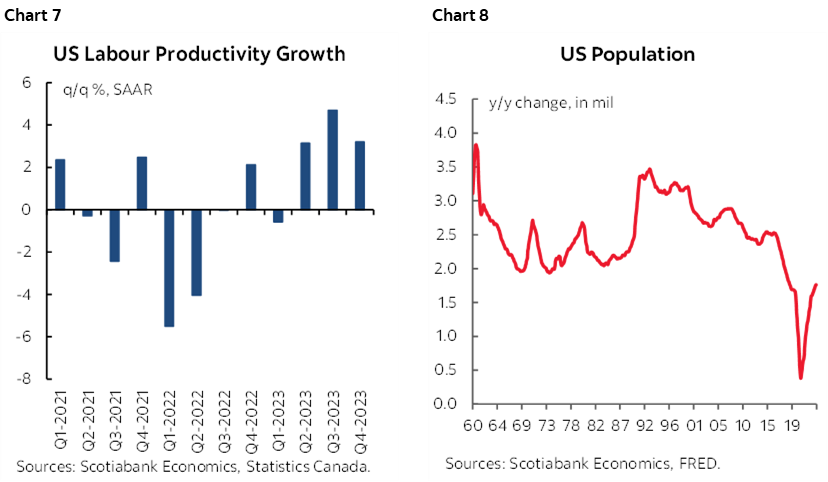
But the reasons for resilience run deeper. Surging productivity growth has provided the ability to do more with the same or fewer inputs amid debate over how sustainable this may be (chart 7). Population growth remains weak, but not as abysmally poor as it was at the worst point while nevertheless facing high post-election uncertainty particularly under a Trump scenario (chart 8). This one-two punch of supply-side improvements faces risks but has been supportive of late.
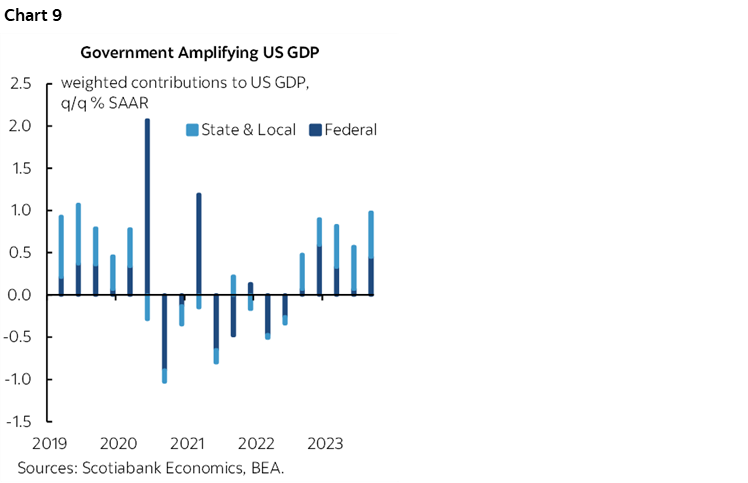
Government spending has been a notable contributor to US economic growth as well (chart 9), although on a net basis may be losing its lustre. There was a time when we used to beseech governments to chip in and help central banks prop up the economy, like after the GFC, but now we can’t stop them!
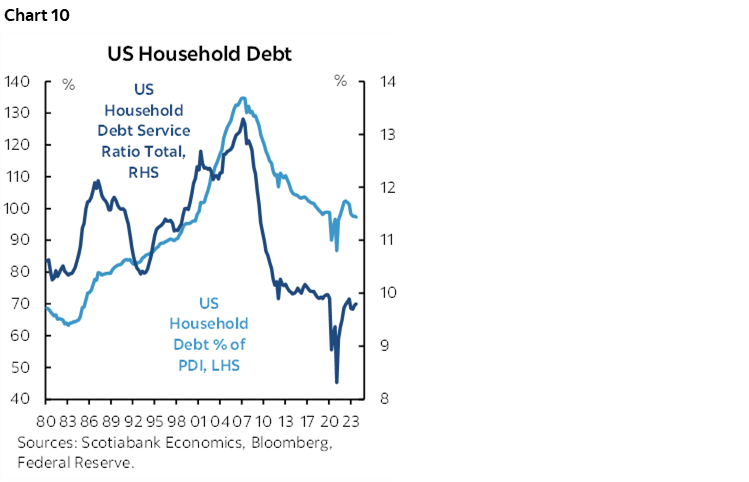
But key has been the US consumer. Given half a chance, they’ll always spend with cash being king, and they have the conditions to keep doing so. Delinquency rates are going up for several credit categories but across the lending products much of this has been more about normalization toward pre-pandemic patterns compared to when extreme policy supports and very low rates meant little to no default activity in the pandemic.
A twenty-three year low in the debt-to-disposable income ratio and still toward record low debt service payments to incomes remain supportive of spending and lessen rate sensitivity compared to, say, strained measures into the GFC (chart 10).
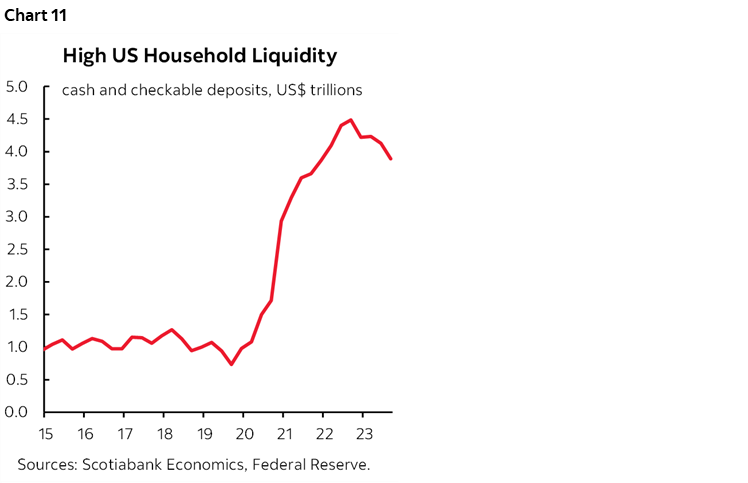
The personal saving rate has normalized, but the stock of outstanding cash and checkable deposits on US household balance sheets remains very elevated (chart 11).
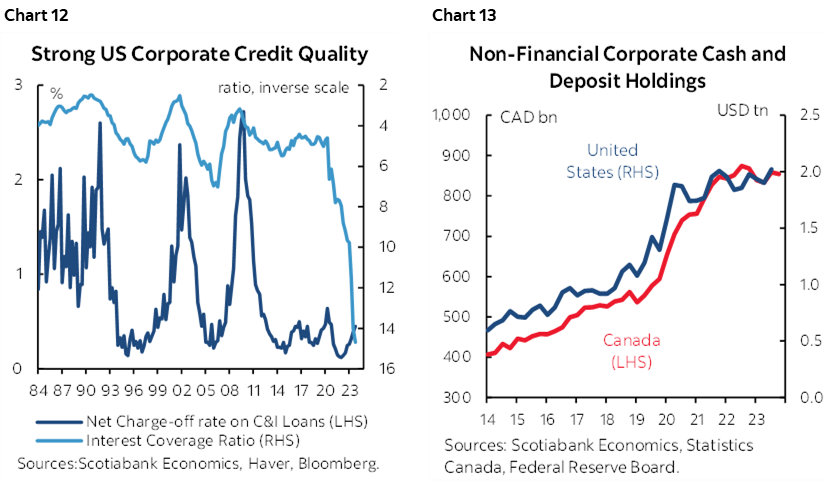
The same generally holds true for corporate finances. Interest coverage remains very high as plotted on a reverse scale to show the correlations with low loan charge-off rates (chart 12). Corporate cash war chests remain high (chart 13).
So resilience may have further to run. Scotia Economics has always been in the soft landing camp and we continue to think the US economy is fundamentally different today—as long as politics doesn’t scuttle it all.
US INFLATION—RESILIENT ECONOMY, RESILIENT PRICE PRESSURES
The Fed’s preferred inflation reading will be updated for the month of March on Friday. The price deflator for total consumption expenditures differs in its methodology compared to CPI for numerous reasons.
Federal Reserve Chair Powell noted that Fed economists expect the reading to land at 2.8% y/y and hence unchanged from February. If so, and barring material revisions, that would imply that March would be 0.35% m/m SA higher than February and hence on the bubble between 0.3–0.4%. Most estimates in consensus are at 0.3% m/m SA.
That, in turn, would be higher than some economists’ attempts that have suggested core PCE could be lower than the already known 0.4% m/m rise in core CPI for the same month of March. The result could raise the three-month moving average to 0.35% m/m SA, or 4.3% m/m at a seasonally adjusted and annualized rate and be a marked departure from the glimmer of a soft patch that was appearing over 2023Q4.
A complication could arise if revisions are implied in the Q1 core PCE estimate that lands the day before, but we can’t tell in which direction such revisions might go. We also won’t be able to tell which month(s) may have been revised within the quarter which could affect the jumping off point for the month-over-month estimates for March.
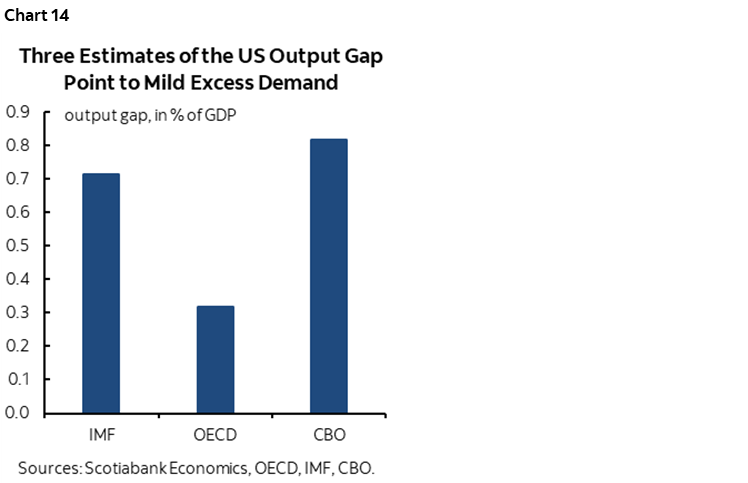
In any event, a resilient US economy partly explains resilient inflation as the US economy has yet to take a step toward opening any disinflationary slack. Estimates from each of the IMF, OECD and CBO point to the US economy being in a mild state of excess demand (chart 14).
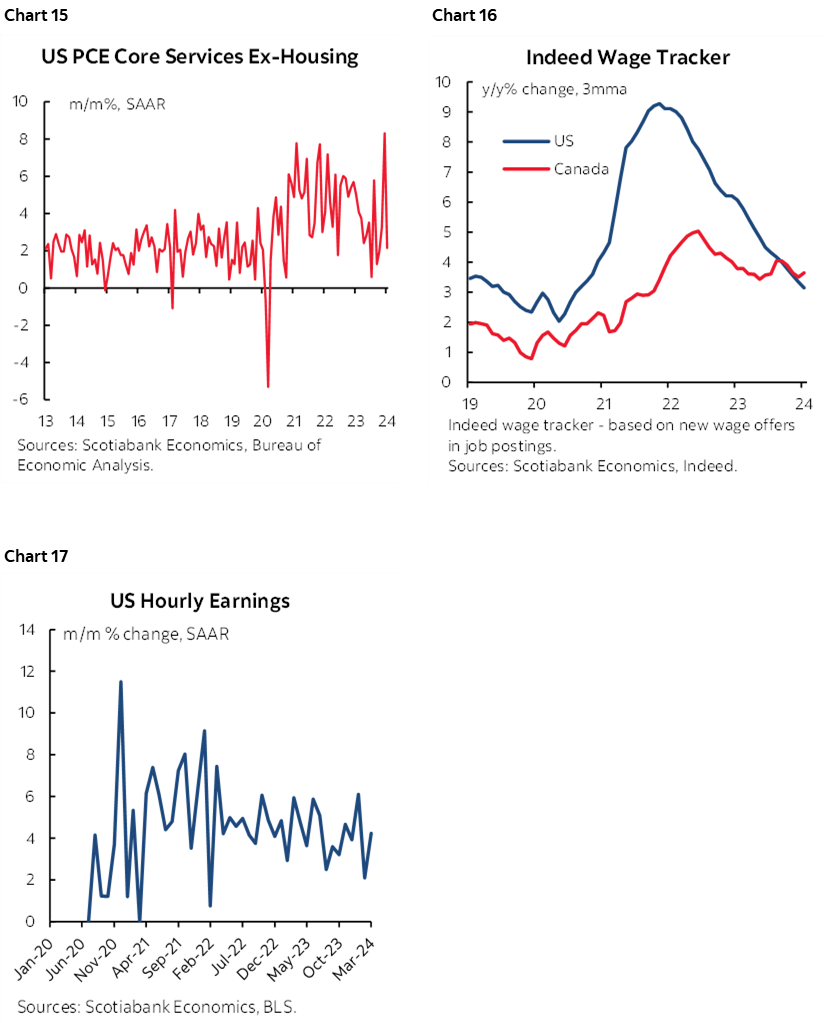
There are some disinflationary signs, like the aforementioned productivity and population signals on the supply side. Core goods prices continue to fall but core services prices remain hot and this raises the risk that if the post-pandemic normalization of goods prices runs its course to give way to firmer core goods prices while joining resilient services inflation then total inflation could even accelerate (chart 15). Wage growth for new job postings has ebbed while remaining above the 2% inflation target (chart 16) alongside durable growth in average wages (chart 17).
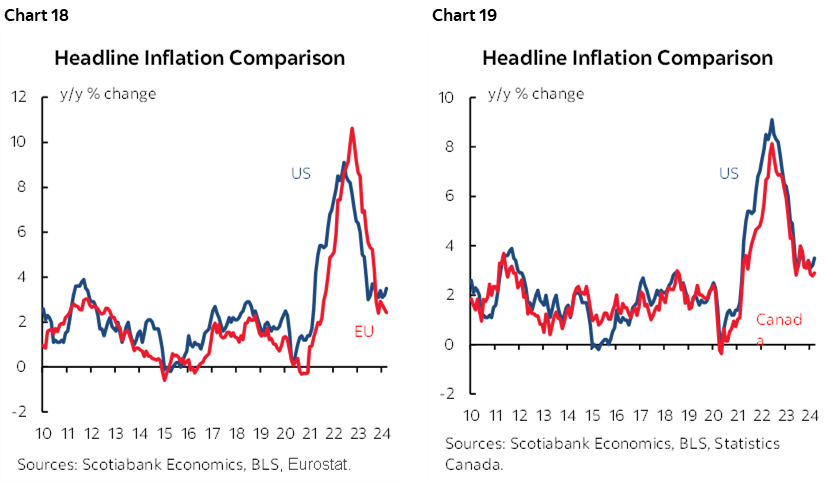
And lest any other central banks get ahead of themselves, it’s fair to note that what happens in Vegas doesn’t stay in Vegas when it comes to inflation. US inflation is highly correlated with Canadian and Eurozone inflation as two examples (charts 18–19). Just as the US entered a temporary inflation soft patch over 2023Q4 before the Q1 surge, countries like Canada may have done the exact opposite but over time converge upon one another.
Overall, with resilient growth and resilient inflation alongside Chair Powell’s show-me-the-money bias over reliance upon forecast models, the Fed appears to be in no rush to cut while the fringes on the FOMC muse aloud about whether tightening is indeed over. It would take a lot to bring Chair Powell back to hiking, but anywhere from no cuts to as much as -50bps this year is a reasonable range of expectations at this point.
Furthermore, time may be running out for the Fed to ease more this year if it feels it has a case to do so barring major shocks. There are four meetings before the US election on November 5th and there is no appetite to go on May 1st and probably little appetite to go on June 12th. A cut later than the July 31st meeting starts to come up against the US election either by cutting on September 18th right before the election, or two days after the election on November 7th. Will the FOMC do what it thinks is right independent of politics? Probably. After all, Chair Powell himself is probably feeling somewhat bullet proof halfway through his second and final term.
But one should be much less confident in this view and its support from past Fed election cycles and models in an era in which the Fed is under vastly greater regulatory oversight and pressure from Congress than ever before. Two of the most highly polarizing Presidential candidates on record and their wildly divergent platforms also merit consideration and one of them will decide who gets Powell’s job after May 2026. Powell is a team guy who wouldn’t want to do anything that would jeopardize the Federal Reserve’s standing with other stakeholders unless he had strong evidence and confidence to back him up.
CENTRAL BANKS—STRUGGLING WITH A STRONG DOLLAR AND THE FED
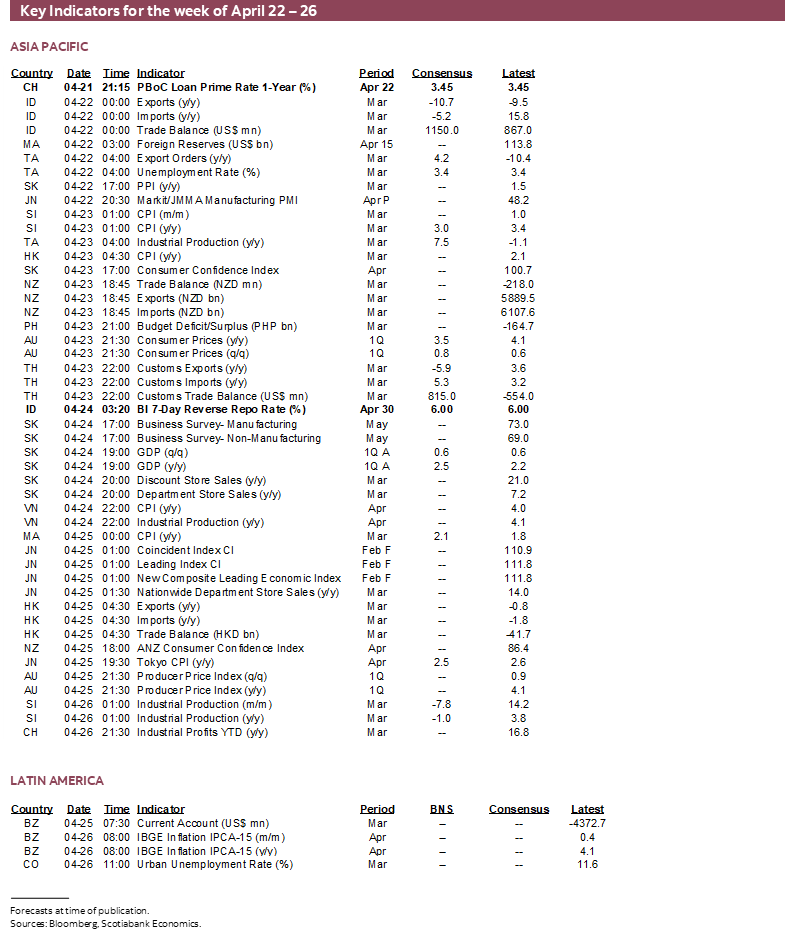
This could be another key meeting for the Bank of Japan that will dominate developments across global central banks this week. There will also be decisions from Bank Indonesia, Turkey’s central bank and the Russians while the BoC issues its not-minutes account of the last meeting and Chinese banks are likely to hold.
Bank of Japan—How High Will Ueda Go?
No change in the target rate of 0.1% is expected when the statement is released late on Thursday evening (ET) ahead of Governor Ueda’s press conference on Friday. Forecast updates will be delivered with this decision and could be key in terms of further informing market pricing for roughly an additional 20bps of tightening later this year. An added key could be guidance on whether and when to begin shrinking the size of the BoJ’s massive balance sheet after ending yield curve control at the last meeting.
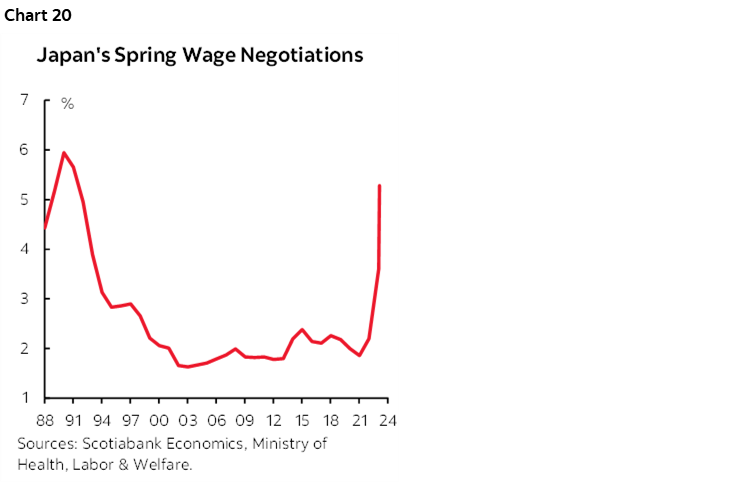
New developments since the last full forecast meeting into the January 22nd decision and the subsequent March 18th decision to hike 10bps have been material but somewhat conflicting. Forecasts will have to incorporate the outcome of the Spring Shunto union wage negotiations that set wage hikes at about 5.3% this year for under 20% of Japanese workers, up from 3.6% last year for the fastest back-to-back years in decades (chart 20). A hot Spring gain after the prior year’s rise was generally expected but they have concrete evidence now.
Further, oil prices have moved higher since the January forecast update with WTI about US$9 higher. Japan is a heavy importer of energy and BoJ research offers evidence of pass through into core inflation over about a one-year period of time.
Amplifying this effect and other import price pressures has been the fact that the yen has depreciated by about another 4% to the USD since the January meeting. USD strength on pushed-out Fed easing has complicated matters for several central banks as indicated by concerns expressed this past week by officials from Japan and South Korea.
This latter point could be key. Not long ago it seemed like the Fed was on track to begin cutting around mid-year while the BoJ was hiking which raised concern about potential policy error at the BoJ by zigging when the Fed is zagging. That risk has turned around since then but may still keep the BoJ in watch mode toward the Fed.
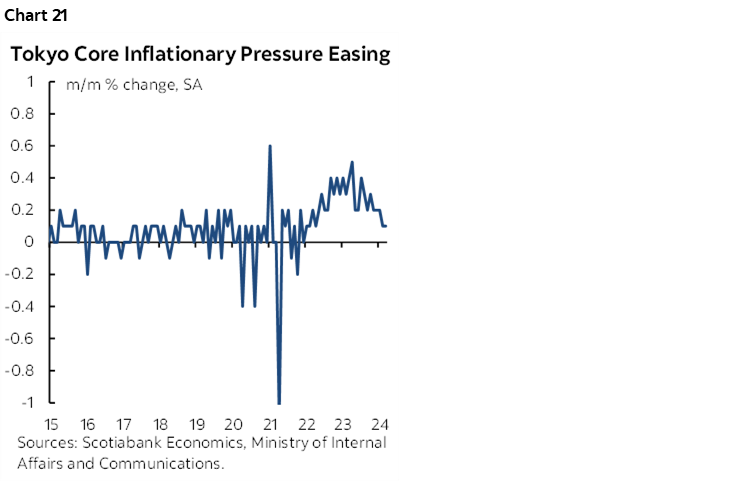
There is just one problem. Core inflation has been sharply waning on the highest frequency m/m basis for about the past year and is running at close to zero now (chart 21). The Tokyo CPI gauge will be updated on Thursday just ahead of the BoJ meeting and could further inform Ueda’s confidence in nearer-term risks.
Ueda is unlikely to guide future actions at this meeting and to instead let the forecasts do the talking for now as further evidence is gathered. Still, its last forecast of 2.4% core inflation this year and 1.8% next year might be revised higher with somewhat further confidence toward durably achieving 2%.
The BoC’s Not-Minutes and Macklem’s Roundtable Remarks
The Bank of Canada updates its Summary of Deliberations to the process leading up to the policy communications on April 10th (recap here) on Wednesday. That meeting ended on a somewhat dovish sounding note that Governor Macklem reinforced in his joint panel appearance with Chair Powell this past week. A recent media roundtable threw renewed doubt into the picture.
It’s doubtful that the Summary of Deliberations will contain material information and I would expect the broad message to continue to indicate that they are encouraged by the Q1 soft patch for core inflation but want more evidence. In my opinion, the BoC should require a lot more evidence before the doves on Governing Council outnumber the relatively more hawkish voices.
Governor Macklem’s comments during a media roundtable on Friday while attending World Bank/IMF Spring meetings sounded like a June decision will go right down to the wire with extreme data dependence. Markets didn’t really react to his comments because that’s probably because they are already pricing only part of a quarter point cut for June anyway and therefore get the data dependent angle.
We are fully dependent upon media reporting across various outlets in the absence of a transparent press conference or transcript which drives varying reporting and doubts over accuracy. Here are some accounts.
Dow Jones said Macklem had this to say:
"Between now and our June decision, we'll get further pieces of data. And we're going to be looking for evidence that the progress [on inflation] is sustained. We're encouraged by the progress we've made. We just need to see it for longer to be confident that the progress toward price stability will be maintained."
So bring on February GDP on April 30th, jobs and wages on May 10th, CPI on May 21st and Q1 GDP with March GDP on May 31st and developments in the Spring housing market. Plus whatever happens to oil prices and broader markets in addition to external developments.
MNI said that Macklem emphasized the importance of considering spikes in oil prices and did not signal whether the data to date would justify lowering borrowing costs in June.
Macklem also said that the Federal Budget did not significantly change the fiscal track according to Bloomberg. Our view is that the spending adds a little more to growth after the increased spending by provinces this past Budget season and that whether fiscal guardrails can be met significantly depends upon uncertainty about how much revenue a hike in the capital gains tax will generate.
A key issue is whether the recent inflation soft patch is sustainable. The US had its soft patch in Q4 and then core inflation rebounded in Q1. Canada had much stronger m/m readings for core inflation gauges in Q4 and then stumbled into a soft patch in Q1. Correlations between the two countries’ inflation gauges are shown elsewhere in this publication and may suggest that Canada could converge higher on core readings once again and in addition to reason to view the recent soft patch as perhaps temporarily driven by factors like El Nino and government pressure on some industries.
Bank Indonesia—Resuming Hikes?
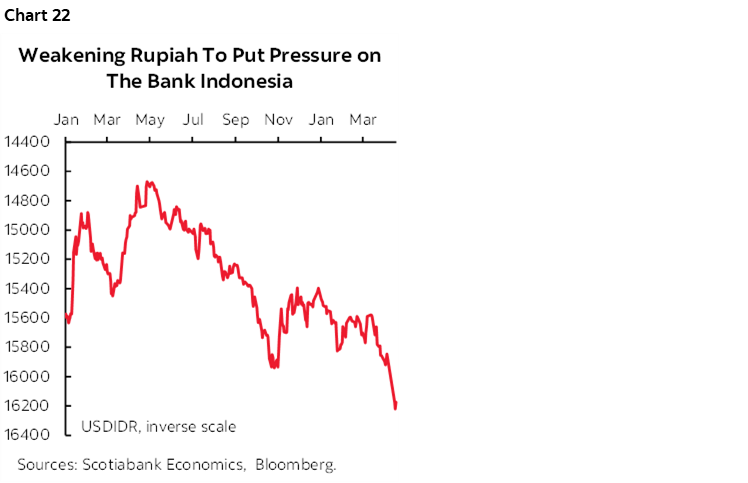
Consensus is somewhat divided on what Indonesia’s central bank might do on Wednesday. Most within consensus expect it to hold, but a significant minority expect it to hike by 25bps. With the Federal Reserve’s rate cuts being pushed down and out for this year, the hot money spread has caused the rupiah to fall out of favour in FX markets. The currency has sharply depreciated (chart 22) and it’s something that BI takes very seriously given the implications for imported inflation and financial stability.
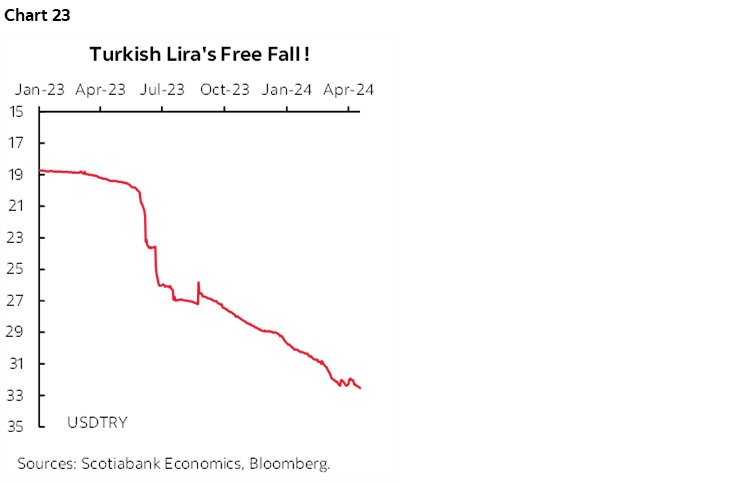
Turkey—You Think Your Borrowing Costs are High?
Another rate hike after the surprise 500bps hike to 50% on March 21st cannot be ruled out. Turkish core inflation moved up to 75.2% y/y in March to set a new pandemic-era high. You might say let bygones be bygones, except that’s a bit tougher at such extreme levels especially since the lira has been on a tumbling path for so long and given that the Fed’s cuts keep getting pushed out (chart 23). Governor Fatih Karahan said this past week while attending IMF/World Bank Spring meetings that another hike could be delivered if inflation is expected to further deteriorate.
China’s LPRs Not Expected to Change
China’s banks are expected to leave their 1-year and 5-year Loan Prime Rates unchanged at 3.95% and 3.45% respectively on Sunday night (ET). The decision would follow the PBOC’s decision to leave its 1-year Medium-Term Lending Facility Rate unchanged at 2.5% this past week and a small upside surprised on Q1 GDP growth along with an upward revision to the prior quarter.
Russia—Break a Leg. No Really
Russia’s central bank is expected to hold at 16% on Friday.
EARNINGS DELUGE
A big week for earnings lies ahead.
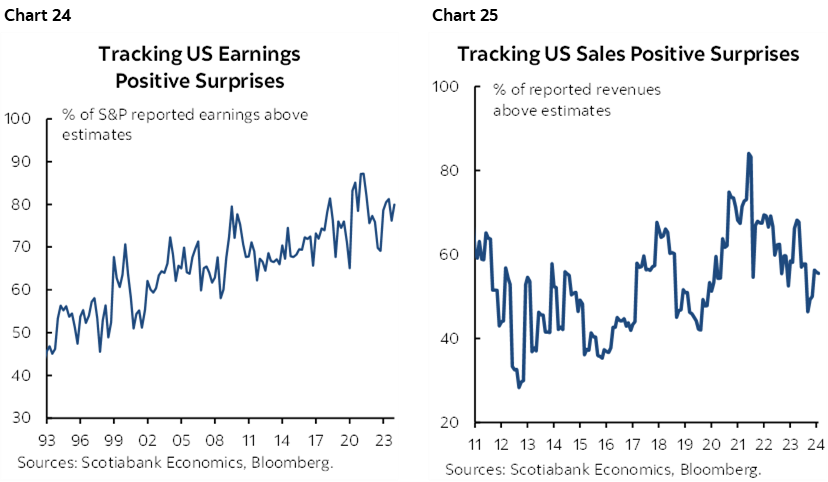
On the US side, 157 S&P500 firms will release earnings reports including names like Meta Platforms, Alphabet, Tesla, Ford, UPS, GE, Boeing, Caterpillar, Intel, and Microsoft. The earnings season is mixed so far with just 70 out of 500 firms out, as the earnings beat ratio remains high, but the revenue beat ratio is a coin-toss and other earnings details by sector and company have been highly variable (charts 24, 25).
In Canada, 26 firms on the TSX will report including names like CN, Rogers, Metro, and Bombardier. It’s too early to assess the tone of the Canadian earnings season with just half a dozen TSX-listed firms having released thus far.
GLOBAL MACRO—STALLED GLOBAL PROGRESS?
Here’s the rest of the week’s global line-up with emphasis upon key releases in the US and Canada, Australia and Eurozone. The Australian and Eurozone inflation metrics could inform whether or not it’s just the US that is seeing a resurgence of inflationary pressures.
Purchasing Managers’ Indices to Kick Off the Week
The monthly wave of purchasing managers’ indices will unfold over the start of the week. Australia and Japan update first on Monday night (ET) with India, France, Germany, the Eurozone tally, the UK and then the US all coming on Tuesday morning.
How Did Canadian Consumers Fare This March Break?
Canada faces light developments this week after a jam-packed stretch of developments. Wednesday’s retail sales report will be watched for February revisions and the preliminary estimate for March. Statcan had guided that February’s nominal sales were tracking roughly unchanged (+0.1% m/m). The preliminary estimate is always subject to high revision risk because of its reliance upon a highly incomplete sample of survey responses. Details like what happened to volumes and the first estimate for March’s sales including Spring break and an earlier than normal Good Friday may matter more.
United States—A Few Other Gems
Core PCE inflation will dominate attention this week amid an otherwise lighter sprinkling of macro reports.
- New home sales (Tuesday): If a surge in model home foot traffic offers any indication, then new home sales during March could take off.
- Durable goods orders (Wednesday): Durables are expected to jump on airplane orders with Boeing posting 113 in March versus 15 in February and just 3 in January; key, however, will be core capital goods orders that are expected to post a small gain.
- Income and spending (Friday): Income growth is expected to accelerate alongside strong growth in personal spending given the already known 1.1% m/m jump in the retail sales control group that serves as input to the total consumption figures and offers substantial correlation.
Other minor US releases will include potential retail sales revisions on Tuesday plus the Richmond Fed’s manufacturing gauge, the advance merchandise trade measure on Thursday, and then weekly initial jobless claims and pending home sales for March on Thursday.
Australian Core Inflation Still Too Hot?
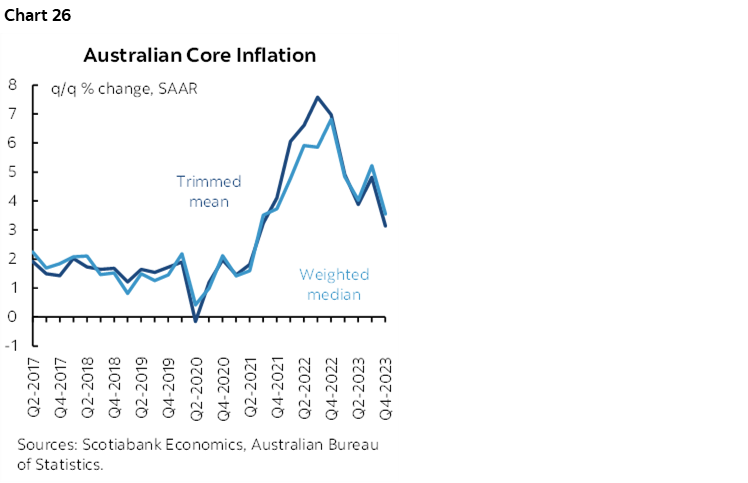
RBA-watchers will have a keen eye on Australia’s inflation updates on Tuesday night (ET). Key will be the Q1 trimmed mean and weighted median gauges that cooled somewhat in Q4 after a hotter run, but that continued to signal pressures above the RBA’s 2–3% inflation target range (chart 26). Most estimates expect these core gauges to remain above-target. Also watch the breakdown between tradeables inflation and nontradeables particularly after markets focused upon this past week’s NZ nontradeables figure that was hotter than expected.
Stalled Progress by Eurozone Inflation Expectations?
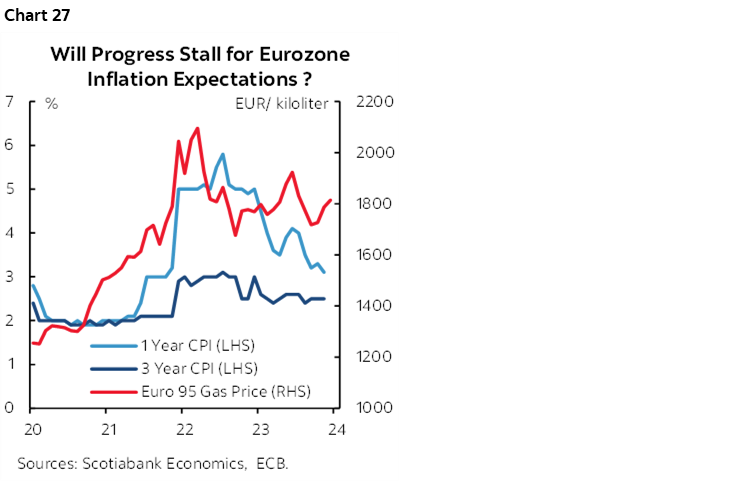
The ECB’s latest gauges of inflation expectations for March (Friday) will be second-last updates before the important June meeting. Progress may have stalled out if not reversed given pressures on Brent crude prices (chart 27).

DISCLAIMER
This report has been prepared by Scotiabank Economics as a resource for the clients of Scotiabank. Opinions, estimates and projections contained herein are our own as of the date hereof and are subject to change without notice. The information and opinions contained herein have been compiled or arrived at from sources believed reliable but no representation or warranty, express or implied, is made as to their accuracy or completeness. Neither Scotiabank nor any of its officers, directors, partners, employees or affiliates accepts any liability whatsoever for any direct or consequential loss arising from any use of this report or its contents.
These reports are provided to you for informational purposes only. This report is not, and is not constructed as, an offer to sell or solicitation of any offer to buy any financial instrument, nor shall this report be construed as an opinion as to whether you should enter into any swap or trading strategy involving a swap or any other transaction. The information contained in this report is not intended to be, and does not constitute, a recommendation of a swap or trading strategy involving a swap within the meaning of U.S. Commodity Futures Trading Commission Regulation 23.434 and Appendix A thereto. This material is not intended to be individually tailored to your needs or characteristics and should not be viewed as a “call to action” or suggestion that you enter into a swap or trading strategy involving a swap or any other transaction. Scotiabank may engage in transactions in a manner inconsistent with the views discussed this report and may have positions, or be in the process of acquiring or disposing of positions, referred to in this report.
Scotiabank, its affiliates and any of their respective officers, directors and employees may from time to time take positions in currencies, act as managers, co-managers or underwriters of a public offering or act as principals or agents, deal in, own or act as market makers or advisors, brokers or commercial and/or investment bankers in relation to securities or related derivatives. As a result of these actions, Scotiabank may receive remuneration. All Scotiabank products and services are subject to the terms of applicable agreements and local regulations. Officers, directors and employees of Scotiabank and its affiliates may serve as directors of corporations.
Any securities discussed in this report may not be suitable for all investors. Scotiabank recommends that investors independently evaluate any issuer and security discussed in this report, and consult with any advisors they deem necessary prior to making any investment.
This report and all information, opinions and conclusions contained in it are protected by copyright. This information may not be reproduced without the prior express written consent of Scotiabank.
™ Trademark of The Bank of Nova Scotia. Used under license, where applicable.
Scotiabank, together with “Global Banking and Markets”, is a marketing name for the global corporate and investment banking and capital markets businesses of The Bank of Nova Scotia and certain of its affiliates in the countries where they operate, including; Scotiabank Europe plc; Scotiabank (Ireland) Designated Activity Company; Scotiabank Inverlat S.A., Institución de Banca Múltiple, Grupo Financiero Scotiabank Inverlat, Scotia Inverlat Casa de Bolsa, S.A. de C.V., Grupo Financiero Scotiabank Inverlat, Scotia Inverlat Derivados S.A. de C.V. – all members of the Scotiabank group and authorized users of the Scotiabank mark. The Bank of Nova Scotia is incorporated in Canada with limited liability and is authorised and regulated by the Office of the Superintendent of Financial Institutions Canada. The Bank of Nova Scotia is authorized by the UK Prudential Regulation Authority and is subject to regulation by the UK Financial Conduct Authority and limited regulation by the UK Prudential Regulation Authority. Details about the extent of The Bank of Nova Scotia's regulation by the UK Prudential Regulation Authority are available from us on request. Scotiabank Europe plc is authorized by the UK Prudential Regulation Authority and regulated by the UK Financial Conduct Authority and the UK Prudential Regulation Authority.
Scotiabank Inverlat, S.A., Scotia Inverlat Casa de Bolsa, S.A. de C.V, Grupo Financiero Scotiabank Inverlat, and Scotia Inverlat Derivados, S.A. de C.V., are each authorized and regulated by the Mexican financial authorities.
Not all products and services are offered in all jurisdictions. Services described are available in jurisdictions where permitted by law.